
ABSTRACT
The performance of seven operational high-resolution satellite-based rainfall products – Africa Rainfall Estimate Climatology (ARC 2.0), Climate Hazards Group InfraRed Precipitation with Stations (CHIRPS), Precipitation Estimation from Remotely Sensed Information using Artificial Neural Networks (PERSIANN), African Rainfall Estimation (RFE 2.0), Tropical Applications of Meteorology using SATellite (TAMSAT), African Rainfall Climatology and Time-series (TARCAT), and Tropical Rainfall Measuring Mission (TRMM) daily and monthly estimates – was investigated for Burkina Faso. These were compared to ground data for 2001–2014 on a point-to-pixel basis at daily to annual time steps. Continuous statistics was used to assess their performance in estimating and reproducing rainfall amounts, and categorical statistics to evaluate rain detection capabilities. The north–south gradient of rainfall was captured by all products, which generally detected heavy rainfall events, but showed low correlation for rainfall amounts. At daily scale they performed poorly. As the time step increased, the performance improved. All (except TARCAT) provided excellent scores for Bias and Nash–Sutcliffe Efficiency coefficients, and overestimated rainfall amounts at the annual scale. RFE performed the best, whereas TARCAT was the weakest. Choice of product depends on the specific application: ARC, RFE, and TARCAT for drought monitoring, and PERSIANN, CHIRPS, and TRMM daily for flood monitoring in Burkina Faso.
1. Introduction
West Africa is increasingly affected by the impacts of climate change. Natural disasters cause considerable losses, both economically and socially. An analysis of rainfall data in West Africa from 1896 to 2006 showed that the average annual amount of rainfall during the four decades considered (1970–2009) was below the annual average registered during the period 1900–1970 (Ibrahim et al. Citation2012). Two extreme events demonstrated the fragility of the Sahelian natural resources. These were the droughts of 1972–1973 and 1984–1985 (Herceg, Sobel, and Sun Citation2007; Landsberg Citation1975), which caused loss of human life and livestock in the semi-arid region. Since the 1970s, Burkina Faso has experienced years of drought to the point of drought becoming almost chronic. Recurrent weather anomalies create several droughts (causing desertification) in the north, and floods in the south. Since agriculture – the main economic sector, which employs more than 80% of the country’s working population – is prone to recurrent natural disasters, food insecurity and malnutrition rates remain chronically high. The government is in the process of developing early warning systems (EWSs) with a multi-hazard approach, and integrating disaster risk management and climate change adaptation into local development plans. The objective is to forewarn extreme climate events and to mitigate the impacts.
Reliable information on precipitation at sufficiently detailed spatial and temporal scales is essential for EWSs. However, West Africa has an extremely low density of reliable weather stations that provide accurate rainfall measurements over long time periods. This limits the use and analysis of such data. Meanwhile, global and continental remote-sensing precipitation products are becoming increasingly available with reasonable spatial and temporal resolutions for application in hydrological and climate studies. These may provide an alternative for traditionally measured rainfall at weather stations. A major advantage of using such data is the improved spatial distribution compared with weather stations. Two types of sensors are commonly used in satellite rainfall-estimation algorithms, each with its own particular strengths and limitations. Thermal infrared (TIR) sensors on geostationary satellites produce high spatial coverage with continuous temporal coverage, covering almost the whole globe every one hour or less. TIR information based on the cloud-top brightness temperature is particularly valuable for the distinction between raining and non-raining; however, it is rather poor in the estimation of the actual rainfall amount since the sensor signal does not penetrate the clouds. On the other hand, the passive microwave (PM) sensors on polar-orbiting satellites identify the precipitation particles by scattering due to the large ice particles present in the clouds. PM is better at estimating the rainfall amount owing to the increased direct physical relationship between the sensor signal and rainfall, but runs at a much lower temporal frequency and coarser spatial resolution (Thiemig et al. Citation2013). To leverage the complementary strengths, several satellite products seek to combine the favourable characteristics of the different data sources using various combining strategies (Asadullah, McIntyre, and Kigobe Citation2008; Hirpa, Gebremichael, and Hopson Citation2010; Thiemig et al. Citation2012). With multiple satellite products currently available, it is important to assess their quality regarding precision and uncertainty, as well as their advantages and drawbacks, before they can be integrated into operational applications for decision-making, such as EWS for severe weather, drought, and flood monitoring, disaster risk management, climate change adaptation, integrated water resources management, and large-scale water balance estimations, which are of particular interest in Africa (Thiemig et al. Citation2012).
There are a number of efforts to compare satellite rainfall products with rain-gauge measurements over the Sahel (Ali et al. Citation2005; Gosset et al. Citation2013; Jobard et al. Citation2011; Lamptey Citation2008; Laurent, Jobard, and Toma Citation1998; Nicholson et al. Citation2003a, Citation2003b; Roca et al. Citation2010). However, these studies are mainly conducted at the regional scale considering many countries with different physical and climatic conditions. According to Toté et al. (Citation2015), results from such studies show large differences in algorithm performance depending on location, topography, local climate, and season (Maidment et al. Citation2013). Although few, some studies have been performed at the country scale to evaluate satellite rainfall products. In Africa, these studies include Angola (Pombo, de Oliveira, and Mendes Citation2015), Ethiopia and Zimbabwe (Dinku et al. Citation2007; Diro et al. Citation2009; Hirpa, Gebremichael, and Hopson Citation2010), Kenya (Tucker and Sear Citation2001), Mozambique (Toté et al. Citation2015), and Uganda (Asadullah, McIntyre, and Kigobe Citation2008; Maidment et al. Citation2013). None of these studies was carried out for a West African country. Moreover, it is relevant to assess several high spatial resolution products at multi-temporal scales for a specific region in order to determine which products are favourable for which specific uses.
The primary objective of this study was to assess the accuracy of remotely sensed precipitation products in a semi-arid zone in West Africa and the implications for specific use in an operational EWS. We evaluated seven satellite-based rainfall products by comparing their estimates with ground observations from nine weather stations spread across Burkina Faso. We used seven statistical indicators within both continuous and categorical statistics and compared four different time accumulations, that is, daily, dekadly, monthly, and annual precipitation values.
2. Location of research
Burkina Faso is a landlocked semi-arid Sahelian country with a population of about 17 million. It is located in the area of the loop of the Niger River in the heart of West Africa, between 9°20ʹ and 15°05ʹ N and 2°20ʹ E and 5°30ʹ W. Burkina Faso is a flat country with nearly 90% of its land between 250 and 300 m altitude. A plateau extends over three quarters of the country. The highest region of the country is in the west: here the peak of Ténakourou rises up to 749 m. The lowest area, less than 160 m, is on the edge of the Pendjari in the southeast of the country and the lowest point is located at 135 m. At its closest point, the Atlantic Ocean is 500 km from Burkina Faso’s southern border. The country covers an area of 274,200 km2 and borders with six countries: Mali to the north and west, Côte d’Ivoire, Ghana, Togo, and Benin to the south, and Niger to the east.
The climate of Burkina Faso, which is tropical with Sahelian dominance, is characterized by two contrasting seasons: (1) a wet season from May to September, dominated by humid southwest monsoon winds from the Gulf of Guinea; and (2) a dry season extending from October to April, with a cold period extending from December to February and a warm period from March to May. The cold period is characterized by hot and dry dust-laden winds from the northeast, known as the Harmattan. May and October are the transitional months. The alternation of the two seasons is determined by the movement of the Inter-Tropical Front. The spatial distribution of annual rainfall varies between 300 mm and 1200 mm from the north to the south. The values of potential evapotranspiration (ETP) decrease from more than 2260 mm year–1 in the Sahel region in the north to less than 1800 mm year–1 in the south Sudanian region in the southwest. The highest values are observed in February and March, whereas the lowest values are during July–September, the months in which the ETP is offset by the rainfall.
3. Data set-up
3.1 Rain gauge data
Nine synoptic weather stations are more or less equally distributed across Burkina Faso (see ). Their altitude varies between 270 and 460 m above sea level (masl). Daily total precipitation observations were obtained from the Global Surface Summary of the Day (GSOD), provided and hosted by the National Climatic Data Centre (NCDC) of the National Oceanic and Atmospheric Administration (NOAA). For the period 2001–2014, some 37,664 daily observations collected over the nine synoptic stations (82% of the possible data usable in that 14 year period) were used in the evaluation. provides details of the stations’ locations.
Table 1. Overview of the nine weather stations in Burkina Faso and observations used in the validation.
Figure 1. Relief map of Burkina Faso with synoptic stations location and location within Africa.
3.2 Satellite products characteristics
This section provides a brief description of the seven gridded satellite rainfall products that were compared to rain-gauge data in this study (see ). These products were selected because of their long time series availability; their spatial and temporal resolutions, which make them particularly suitable for hydrological applications; their near-real-time availability; and their public domain availability. We analysed data from six different sources, namely Africa Rainfall Estimate Climatology version 2 (ARC 2.0), Climate Hazards Group InfraRed Precipitation with Stations (CHIRPS), Precipitation Estimation from Remotely Sensed Information using Artificial Neural Networks (PERSIANN), African Rainfall Estimation version 2 (RFE 2.0), Tropical Applications of Meteorology using SATellite (TAMSAT), African Rainfall Climatology and Time-series (TARCAT), and Tropical Rainfall Measuring Mission (TRMM) Multisatellite Precipitation Analysis (TMPA) product. For the latter we used the 3B42 daily product and 3B43 monthly products.
Table 2. Summary of the seven satellite products used.
RFE is developed by the NOAA Climate Prediction Center (CPC) (Herman et al. Citation1997). It is mainly produced for Famine Early Warning Systems Network to assist in disaster-monitoring activities over Africa. The input data for RFE 2.0 comprise four operational sources: (1) daily Global Telecommunications System (GTS) rain-gauge data, (2) Advanced Microwave Sounding Unit (AMSU)-based rainfall estimates, (3) Special Sensor Microwave Imager (SSM/I)-based estimates, and (4) the Geostationary Operational Environmental Satellite (GOES) precipitation index (GPI) calculated from cloud-top infrared (IR) temperatures on a half-hourly basis. The ARC is based on the same algorithm used in RFE 2.0 (Xie and Arkin Citation1995). The latest version ARC 2.0 is very similar to that of RFE 2.0, but uses inputs from two sources: (1) 3 hourly geostationary IR data centred over Africa from the European Organisation for the Exploitation of Meteorological Satellites (EUMETSAT), and (2) quality-controlled GTS gauge observations reporting 24 hours rainfall accumulations over Africa. However, there are differences between ARC and RFE in the use of polar-orbiting PM and geostationary IR data. ARC uses only 3 hourly IR data instead of 30 min, and does not include PM estimates, which RFE does.
The CHIRPS data set was developed by the US Geological Survey (USGS) and the Climate Hazards Group at the University of California, Santa Barbara (UCSB). The data inputs used for CHIRPS creation were: (1) the Climate Hazards Precipitation Climatology (CHPClim); (2) quasi-global geostationary TIR satellite observations from two NOAA sources, the CPC and the National Climatic Data Center (NCDC); (3) atmospheric model rainfall fields from the NOAA Climate Forecast System, version 2 (CFSv2); (4) the TRMM 3B42 product from NASA; and (5) in situ precipitation observations obtained from a variety of sources including national and regional meteorological services (Funk et al. Citation2014).
The PERSIANN (Hsu et al. Citation1997; Novella and Thiaw Citation2013, Citation2010) Climate Data Record (PERSIANN-CDR) was developed by scientists at the Center for Hydrometeorology and Remote Sensing, University of California, Irvine (Ashouri et al. Citation2015). The input data for the PERSIANN-CDR algorithm comes from: (1) Gridded Satellite Data (GridSat-B1) from the International Satellite Cloud Climatology Project (ISCCP) B1 Infrared Window (IRWIN) Channel, and (2) Global Precipitation Climatology Project (GPCP) v2.2.
TARCAT v2.0 is produced by TAMSAT data and a ground-based observations research group of the University of Reading, UK. It is based on Meteosat TIR imagery from EUMETSAT. Its algorithm is locally calibrated using historical ground-based rain-gauge records (Maidment et al. Citation2014; Tarnavsky et al. Citation2014).
The TRMM is a joint space mission between NASA and the Japan Aerospace Exploration Agency (JAXA) designed to monitor and study tropical and subtropical precipitation and the associated release of energy. The most widely used outputs are the TMPA 3 hourly (TRMM 3B42) accumulated to daily, and monthly (TRMM 3B43) products (Maidment et al. Citation2014). The TMPA depends on input from a variety of sensors and sources: the TRMM Precipitation Radar (PR), the TRMM Microwave Imager (TMI), the Advanced Microwave Scanning Radiometer for the Earth Observing System (AMSR-E) on Aqua, the SSM/I and the Special Sensor Microwave Imager/Sounder (SSMIS) both on Defense Meteorological Satellite Program (DMSP), the AMSU-B and the Microwave Humidity Sounder (MHS) both on the NOAA satellite series, the IR data collected by the international constellation of geosynchronous earth orbit (GEO) satellites, and the GPCP precipitation gauge analysis from the Global Precipitation Climatology Centre (GPCC). Some of these sensors are no longer functional (Huffman and Bolvin Citation2013). The TRMM 3B42 V7 and TRMM 3B43 V7 products have been used in this study.
4. Materials and methods
4.1 Validation process
Validation was performed for the overlapping period of the different sources, that is, 2001–2014. Since the stations are too sparse, only nine weather stations for 274,200 km2 (), we only performed a point-to-pixel analysis (Cohen Liechti et al. Citation2012; Thiemig et al. Citation2012). We extracted satellite estimates for the satellite products for the point-based station locations instead of interpolating the gauge measurements into a gridded product. According to Toté et al. (Citation2015), the use of point data results in a demanding validation process; the variance of satellite estimates is fundamentally smoother in space and time as they represent spatial averages over grid cells, and some systematic differences between the point observations and pixel estimates are to be expected. For comprehensive evaluation, the comparison of satellite estimates data and the rain-gauge data was conducted at four temporal scales, that is, daily, dekadal, monthly, and annual. When available, the daily rainfall data were accumulated to dekadal, monthly, and annual totals. The first two dekads of each month comprise 10 days and the last decade consists of the remaining 8–11 days depending on the month. Only dekads and months with complete daily observations, and years with at least 95% of the daily observations available in the rainy season period were retained for the comparison. This resulted in 13,511 dekadal totals, 3458 monthly totals, and 327 annual totals over the nine synoptic stations for the satellite products during the 14 years of study. provides an overview of observations used per synoptic station.
Table 3. Number of daily ground observations and aggregated totals per synoptic station used in the study.
4.2 Validation statistics
The method used in this study was based on the results of the 3rd Algorithm Intercomparison Project of the GPCP (Ebert Citation1996). This method included pairwise comparison statistics to evaluate the performance of the satellite products in estimating the amount of rainfall, and categorical statistics used to assess rain detection capabilities. Five statistical indictors, summarized in , were computed for the pairwise comparison statistics: (1) the Pearson correlation coefficient (r) is used to evaluate how well the estimates corresponded to the observed values; (2) the Mean Error (ME) estimates the average estimate error – a positive ME shows that the estimated rainfall is generally overestimated, while a negative sign shows it is generally underestimated; (3) the Bias reflects the degree to which the measured value is over- or underestimated (Duan, Bastiaanssen, and Liu Citation2012); (4) the root mean square error (RMSE) is a frequently used measure of differences between two variables – it measures the average magnitude of the estimate errors: lower RMSE values indicate greater central tendencies and generally smaller extreme errors; (5) the Nash–Sutcliffe Efficiency coefficient (E) shows how well the estimate predicted the observed time series, and it varies from minus infinity to one: negative values mean that the gauge mean is better than the satellite-based estimate, zero means that the gauge mean is as good as the estimate, and 1 corresponds to a perfect match between gauge measurements and satellite-based estimates (Toté et al. Citation2015).
Table 4. Continuous statistics (, gauge rainfall measurement;
, average gauge rainfall measurement;
, satellite rainfall estimate;
, average satellite rainfall estimate; and
, number of data pairs) and categorical statistics (
, number of hits;
, number of false alarms; and
, number of misses).
Two statistical indicators based on a contingency table were computed for the categorical statistics: (6) the Probability of Detection (POD) indicates what fraction of the observed events was correctly estimated, and (7) the False Alarm Ratio (FAR) indicates what fraction of the predicted events did not actually occur.
Attention should be given to some statistics over others depending on the application of satellite products (Toté et al. Citation2015). For flood forecasting and hydrological purposes, it is important to avoid underestimations of rainfall events and rainfall amounts, and then avoid ME < 0 and low POD. In contrast, for drought monitoring, overestimations must be avoided, and then avoid ME > 0 and high FAR. Products with high r and E and low RMSE have to be considered for general purposes.
5. Results and discussion
5.1 Daily comparison
All daily satellite-based rainfall estimates – i.e. the ARC, CHIRPS, PERSIANN, RFE, and TRMM 3B42 data – and the rain-gauge data were compared at the point-based station locations scale. All of the daily satellite products data and the rain-gauge data are weakly related. The best performance was observed with CHIRPS data (r = 0.47), but this showed poor correlation with the rain-gauge data. The loss of more localized convective rainfall is possible regarding the type of comparison. Therefore, it could be expected that differences occur between rain-gauge and satellite data.
5.2 Dekadal comparison
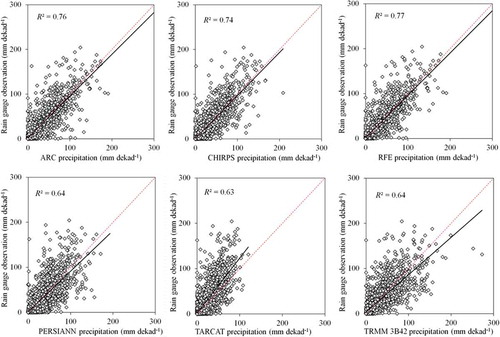
The daily precipitation data were accumulated to dekadal total precipitation for rain-gauge data and the daily satellite products. With the dekadal TARCAT product, the dekadal total precipitations from the six data sets were compared at the point-based station locations scale. shows the scatter plots of data from rain-gauge stations against the different satellite-based rainfall estimates. The statistical indicators are shown in . The number of comparison pairs was 2252 (50% of the entire data range used) for point-based evaluation during the 14 year period for each of the satellite products data sets, except for TARCAT (2251 pairs). Good agreement with the rain-gauge data was observed for all the satellite products (r ≥ 0.80). Whereas RFE data presented the best correlation (r = 0.88) and the greatest E (0.40), TARCAT data showed the smallest but good r (0.80) and the weakest E (–0.03). The best Bias (0.99) and the best ME (–0.22 mm dekad–1) were for CHIRPS, whereas TARCAT presented lower Bias (0.74) and the worst ME (–5.42 mm dekad–1); however, both had the highest RMSE (21.98 mm dekad–1). With negative values of ME, all satellite products underestimated rainfall, except for PERSIANN, which overestimated it. PERSIANN also presented both the highest POD and the highest FAR, which were previously found for the Sahel (Novella and Thiaw Citation2010). PERSIANN is therefore less suitable for drought-monitoring applications in Burkina Faso. TRMM 3B42 values of POD and FAR were close to those of CHIRPS. This was expected since CHIRPS uses TRMM 3B42 estimates as input. With both the lowest POD and the lowest FAR, TARCAT showed the weakest performance for continuous statistics (r, ME, RMSE, Bias, and E), followed by TRMM 3B42. Although RFE was the best of the satellite products, which is in full agreement with the other findings for West Africa (Jobard et al. Citation2011), it was followed closely by ARC and CHIRPS, whereas TARCAT had the lowest performance. TARCAT was also outperformed by CHIRPS and RFE in Mozambique (Toté et al. Citation2015).
Table 5. Dekadal statistical indicators.
Figure 2. Scatter plots of dekadal accumulated rainfall from rain-gauge stations versus ARC, CHIRPS, PERSIANN, RFE, TARCAT, and TRMM 3B42 data at the point-based station locations scale.
5.3 Monthly comparison
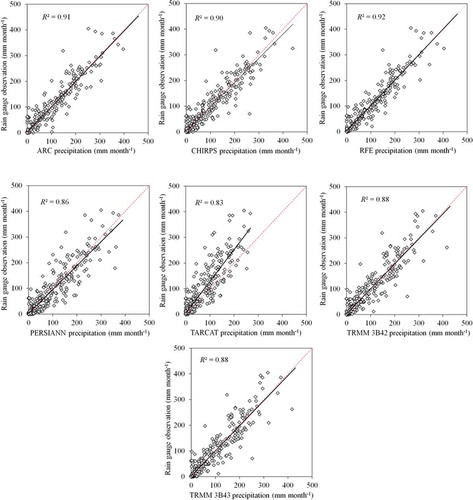
The daily satellite-based rainfall data were accumulated to monthly total rainfall for rain-gauge data, ARC, CHIRPS, PERSIANN, RFE, TARCAT, and TRMM 3B42. With the monthly TRMM 3B43 product, the monthly total precipitations from seven data sets were compared at the point-based station locations scale. shows the scatter plots of data from rain-gauge stations against each of the satellite-based rainfall estimates. The statistical indicators are listed in . There are in total 494 comparison pairs (33% of the entire data range used) for each of all the satellite products data sets for point-based evaluation during the 14 year period. Excellent agreement with the rain-gauge data was observed for all of the satellite products. The best correlation was for RFE (r = 0.96), whereas TARCAT presented the weakest but still excellent score (r = 0.91). All the satellite products presented Bias scores close to the perfect score of 1.00, except for TARCAT, which has the weakest Bias (0.73). The best score for ME (–0.57 mm month–1) was for CHIRPS, and the best E (0.62) was for RFE. The worst scores for both were observed for TARCAT (ME = −14.49 mm month–1; E = −0.11). With negative ME scores, all the satellite products underestimated rainfall, except PERSIANN. Moreover, RFE gave the best RMSE score (26.84 mm month–1), whereas TARCAT had the highest RMSE (42.14 mm month–1). This higher precision at the monthly scale than at the daily or dekadal scale is due to the fact that the errors at the sub-monthly scale are nearly symmetrical and thus can cancel each other out after the aggregation. As expected, TARCAT showed both the lowest POD and the lowest FAR, whereas the best POD and the highest FAR were observed for TRMM 3B43, followed closely by PERSIANN. However, all satellite products presented POD scores higher than 0.90 (except TARCAT) and FAR scores lower than 0.40. It was previously found that RFE, PERSIANN, and TRMM 3B42 demonstrated a good POD of rainy events for the Volta River basin (Thiemig et al. Citation2012). RFE stood out from the other products, but it was followed closely by ARC and CHIRPS; TARCAT demonstrated the worst performance for the continuous statistics. For the categorical statistics, TARCAT also had the worst POD score, whereas its FAR score was extremely low.
Table 6. Monthly statistical indicators.
Figure 3. Scatter plots of monthly accumulated rainfall from rain-gauge stations versus ARC, CHIRPS, PERSIANN, RFE, TARCAT, TRMM 3B42, and TRMM 3B43 data at the point-based station locations scale.
The satellite products were also analysed to evaluate their performance for different rain intensities at the monthly scale. Monthly scale is the smallest temporal resolution at which all the satellite products could be evaluated together. The monthly precipitations were grouped into six classes, that is, 0, >0–25, >25–100, >100–200, >200–300, and >300 mm month–1. depicts the occurrence frequencies of monthly precipitation at the point-based station locations scale in different precipitation intensity ranges and their relative contributions (RCs) to the total precipitation for rain-gauge data, ARC, CHIRPS, PERSIANN, RFE, TARCAT, TRMM 3B42, and TRMM 3B43. The occurrence frequency (OF) is equal to the number of rainy months within a class divided by the total number of rainy months. RC is equal to the sum of precipitation within a class divided by the total precipitation (Junzhi, A-Xing, and Zheng Citation2012).
Figure 4. Occurrence frequencies of monthly precipitation in different precipitation intensity ranges and their relative contributions to total precipitation. ‘Occurrence’ in the legend means the occurrence frequency of each class, and ‘Contribution’ means the relative contribution of each class.
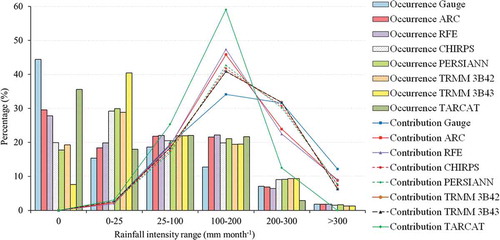
All the satellite-based rainfall products underestimated the occurrence frequencies of zero precipitation. The occurrence frequencies were calculated with confidence intervals estimated at 95% confidence level. The lowest difference was for TARCAT (6–10%). The rain-gauge data showed an OF of 44 ± 4%, whereas TARCAT presented an OF of 36 ± 2%. There were medium differences among ARC (13–17%), RFE (14–19%), and rain-gauge data, and the differences were great for CHIRPS (22–27%), TRMM 3B42 (23–28%), and PERSIANN (24–29%). The biggest difference was for the monthly TRMM 3B43 product (8 ± 1% OF of zero precipitation cf. rain-gauge data, 44 ± 4%). Although the differences between the occurrence frequencies of TARCAT and TRMM3B42 with other satellite products were significant, they were inexistent between ARC (30 ± 2%) and RFE (28 ± 2%), and among TRMM3B42 (19 ± 2%), CHIRPS (20 ± 2%), and PERSIANN (18 ± 2%). For rainfall intensities lower than 200 mm month–1, all the satellite-based rainfall products showed overestimation. In the range 0–25 mm month–1, the differences between rain-gauge data values (OF = 15 ± 3%) and satellite-based rainfall products were smaller for TARCAT (OF = 18 ± 2%), ARC (OF = 18 ± 2%), and RFE (OF = 20 ± 2%), and greater with TRMM 3B42 (OF = 29 ± 2%), CHIRPS (OF = 29 ± 2%), and PERSIANN (OF = 30 ± 2%). The greatest difference was denoted for TRMM 3B43 (40 ± 3% OF cf. rain-gauge data, 15 ± 3%). This overestimation can be the result of the sensors’ inability to differentiate between drizzly days and rainy days as their spatial scales are much larger than the point locations of rain gauges (Thiemig et al. Citation2012; Toté et al. Citation2015). This suggestion is supported by the fact that as the spatial resolution of the satellite products decreased, the overestimation was generally higher. In the 25–100 mm month–1 class, there were small and insignificant differences between rain-gauge data and satellite products (2–3%). Differences increased with variation between 6% and 9% for the precipitation intensities in the 100–200 mm month–1 class. However, there was no difference among satellite products. Rainfall intensities of 200–300 mm month–1 were slightly underestimated by TARCAT (OF = 3 ± 1%), whereas no significant difference was observed between rain-gauge data (OF = 7 ± 2%) and ARC, RFE, CHIRPS, PERSIANN, TRMM 3B42, and TRMM 3B43. For the occurrence frequencies over 300 mm month–1, the differences between rain-gauge observations and the satellite products were almost null and not significant with about 2% as OF, except for TARCAT, which predicted no such rainfall event.
All the satellite-based rainfall products and the rain-gauge data had the same trend in the RCs for all rainfall intensities classes. The trend presented an increase from 0 to 200 mm month–1 with a decrease beyond (). However, the RC of TARCAT products was the highest during the increase, up to 200 mm month–1, and the lowest during the decrease, indicating that TARCAT detected little high-intensity rainfall, and thus must be avoided for flood monitoring, and extreme wet climate events in Burkina Faso. Similar results were obtained for Mozambique (Toté et al. Citation2015). As with the rain-gauge measurements, all the satellite-based rainfall products presented a peak in rainfall intensity in the 100–200 mm month–1 class. All the satellite products indicated more than 40% of RC, whereas rain-gauge data showed only 34 ± 15% for a confidence level of 95%. However, there was insignificant difference between rain-gauge data and satellite products except for TARCAT (RC = 59 ± 7%). The contribution of TARCAT decreased quickly and indicated 12 ± 6% for the 200–300 mm month–1 class, whereas ARC and RFE showed about 23 ± 5%, and CHIRPS, PERSIANN, TRMM 3B42, and TRMM 3B43 indicated approximately the same contribution of 32 ± 5% as rain-gauge data (RC = 32 ± 19%). TARCAT contribution was null for rainfall intensity over 300 mm month–1, while the other satellite-based rainfall products seemed to indicate the same values per pair of satellite products. TRMM 3B42 and TRMM 3B43 indicated a contribution of 6 ± 4%, CHIRPS and PERSIANN showed a contribution of 8 ± 5%, and ARC and RFE presented 9 ± 5% as contribution. The daily estimates of ARC and RFE on 1 September 2009 indicated that these products were also able to detect the heavy rainfall that caused flooding in Ouagadougou. Moreover, all of the satellite products indicated similar contribution as rain-gauge data, which showed a contribution of 12 ± 10%. This leads to the conclusion that all the satellite products, except TARCAT, were capable of detecting high-intensity rainfall events over 300 mm month–1, and determining the rainfall amount of those events. The most likely reason for this is the poor capacity of the TIR sensor to estimate the actual rainfall amount since the sensor signal does not penetrate the clouds (Thiemig et al. Citation2013). Toté et al. (Citation2015) also note that RFE, CHIRPS, and TARCAT overestimated low rainfall values and underestimated high values. Previous studies (Asadullah, McIntyre, and Kigobe Citation2008; Huffman et al. Citation2007) also note that TRMM 3B42 was better at reporting the occurrence of rainfall than the amounts. Moreover, TARCAT showed the highest underestimations for very high rainfall events, whereas CHIRPS underestimated the frequency of 0 mm rainfall events and overestimated the frequency of low-rainfall events (0–25 mm month–1). Toté et al. (Citation2015) suggest that TARCAT is designed as a reliable drought-monitoring product, whereas CHIRPS might be more useful for flood monitoring.
5.4 Annual comparison
The monthly accumulated rainfall data were further accumulated to annual total precipitation for rain-gauge data, ARC, CHIRPS, PERSIANN, RFE, TARCAT, TRMM 3B42, and TRMM 3B43. compares the annual precipitation from rain-gauge data with each of the satellite-based rainfall estimates at the point-based station locations scale. The statistical indicators are provided in . The number of comparison pairs was 47 (i.e. 37% of the entire data range used) for point-based evaluation during the 14 year period for each of the satellite products data sets, except TARCAT (45 pairs or 36% of the entire data range). Strong agreement with the rain-gauge data was observed for all of the satellite products. The best correlation was denoted for RFE (r = 0.85), whereas TARCAT presented the weakest but still good r score (0.70). All the satellite products presented Bias scores approximately equal to 1, except TARCAT, which had the weakest Bias (0.77). All satellite products overestimated rainfall with positive ME values, except TARCAT. The worst ME (–250.44 mm year–1) and E (–0.30) were observed for TARCAT, whereas ARC showed the lowest ME (11.49 mm year–1) and RFE presented the highest E (0.75). The lowest RMSE score (104.48 mm year–1) was observed for RFE and the highest RMSE score (238.89 mm year–1) was attributed to TARCAT. Moreover, RFE was the best among all of the compared satellite products, whereas TARCAT had the worst performance. Thiemig et al. (Citation2012) suggest that RFE and TRMM 3B42 gave good to intermediate results for hydrological modelling in the lowland areas of Volta River basin, where it is better to refrain from the use of PERSIANN.
Table 7. Annual statistical indicators.
Figure 5. Scatter plots of annual accumulated rainfall from rain-gauge stations versus ARC, CHIRPS, PERSIANN, RFE, TARCAT, TRMM 3B42, and TRMM 3B43 data at the point-based station locations scale.
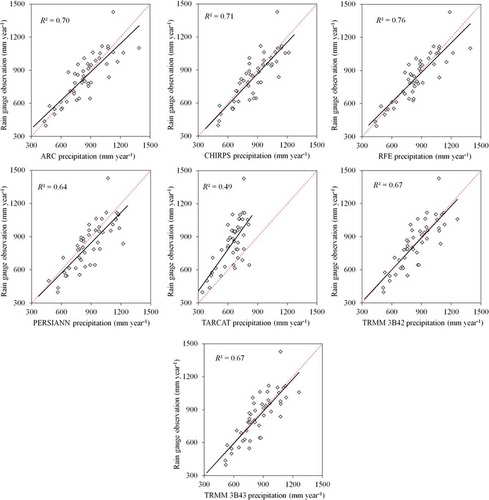
shows the mean (2001–2014) total annual rainfall for ARC, CHIRPS, PERSIANN, RFE, TARCAT, TRMM 3B42, and TRMM 3B43 products. The general north–south gradient of rainfall was captured by all of the analysed products. TRMM 3B42 and TRMM 3B43 showed similar spatial patterns over land. ARC and RFE also presented similar spatial patterns over land, but with slightly less differentiation in rainfall intensity. CHIRPS spatial differentiation was close to those of ARC and RFE, except that it seemed to underestimate high rainfall intensities detected by those products. PERSIANN had the same spatial differentiation as TRMM 3B42 and TRMM 3B43, but it was predisposed to detect high rainfall intensities. TARCAT had lower estimates for annual total rainfall. The TARCAT product showed the least spatial differentiation although its spatial resolution was the highest compared with the lowest spatial resolution products, that is, TRMM 3B42, TRMM 3B43, and PERSIANN. Comparing the RFE, CHIRPS, and TARCAT products in Mozambique (Toté et al. Citation2015), researchers also found that TARCAT had the least spatial differentiation.
Figure 6. Mean (2001–2014) total annual rainfall for the different satellite-based rainfall products.
6. Conclusions
The evolution and availability of continental and global satellite-based rainfall products with high spatial and temporal resolution are increasingly facilitating and stimulating the implementation of climatic early warning activities in data-scarce regions. However, the accuracy, strengths, and weaknesses of these satellite products must be assessed before they are used for any specific application. In this study, the performance of the satellite products in estimating and reproducing rainfall was investigated for Burkina Faso, West Africa. Seven satellite-based rainfall data sets – ARC 2.0, CHIRPS, PERSIANN, RFE 2.0, TARCAT, TRMM 3B42, and TRMM 3B43 – were compared and evaluated using rain-gauge data for a 14 year period (2001–2014). A point-to-pixel evaluation was carried out at daily, dekadal, monthly, and annual temporal scales, using continuous statistics and categorical statistics.
All the daily products performed poorly. They showed underestimation of rainfall amounts, and they were weakly correlated with rain-gauge data (r < 0.50). This might be due to the loss of more localized convective rainfall regarding the type of comparison. At the dekadal scale, good agreements with rain-gauge data were observed for all the satellite products (r ≥ 0.80). Except for PERSIANN, which gave an overestimation, all the other satellite products underestimated rainfall amounts. Good Bias scores were achieved by all of the satellite products, except for TARCAT, which had the lowest performance for both continuous and categorical statistics, but an excellent FAR. RFE was the best product, with good scores in both continuous and categorical statistics; it was closely followed by ARC and CHIRPS. In light of these results, it should be excellent to good using ARC, RFE, and TARCAT for drought monitoring, whereas PERSIANN, CHIRPS, and TRMM 3B42 should be preferred for flood monitoring in Burkina Faso.
As the evaluation time step increased, the performance of the satellite-based rainfall products improved. All the satellite-based rainfall products data were in excellent to good agreement with the rain-gauge data at monthly and annual temporal scales. They also exhibited excellent Bias scores and good E scores, except for TARCAT. The best performance was demonstrated by RFE, with the highest scores in statistics at both monthly and annual scales, whereas TARCAT was outperformed by all the other products. However, all the satellite-based rainfall products showed high correlation (r > 0.90 at the monthly scale, and r ≥ 0.70 at the annual scale) with the rain-gauge data. All the satellite products underestimated rainfall amounts at the monthly scale, except for PERSIANN, and they all overestimated rainfall at the annual scale, except for TARCAT.
Overall, satellite-based rainfall products generally showed overestimation of rainfall events under 200 mm month–1 and underestimation of higher values. As the spatial resolution of the satellite products increased, so did the overestimation. This may be linked to the sensors’ inability to discriminate between drizzly days and rainy days. For the occurrence frequencies of zero precipitation, satellite-based rainfall products demonstrated underestimation of rain-gauge observations. Moreover, analysis showed that monthly precipitations are mainly in the 100–200 mm month–1 range. All the satellite-based rainfall products showed a peak in this range, but the TARCAT had the highest peak. TARCAT gave zero contribution for rainfall intensity over 300 mm month–1, whereas the other satellite-based rainfall products seemed to indicate the same values as the rain gauges. Generally, except TARCAT, the satellite products could detect heavy rainfall events, and estimate the rainfall amounts of those events.
All the satellite products were capable of depicting the general north–south gradient of rainfall over the study area. TRMM 3B42 and TRMM 3B43 products presented the most differentiation in spatial pattern, whereas TARCAT showed the least spatial differentiation although its spatial resolution is the highest. This lack of precision may be the result of the fact that the TARCAT algorithm is based only on TIR.
In summary, satellite products showed diverse performance depending on several factors. Satellite products using a combination of TIR, PM, and GTS data as input demonstrated better performance than those using fewer sources. Moreover, the good performance of some satellite products may be due to their smaller grid size as it reduces the effect of pixel-to-point comparison (Cohen Liechti et al. Citation2012). However, the best product depends on the specific application, and time step is of great importance in evaluating the quality of satellite products. Estimates at a daily or shorter time step are essential for driving rainfall run-off models used for flood forecasting and river management (Grimes, Pardo-Igúzquiza, and Bonifacio Citation1999). For operational agricultural and early warning activities, dekadal time step can be used to identify periods of low or heavy rainfall that may lead to either drought or flood. As for overall water resource assessment of river basins, monthly and seasonal time steps can provide results that could be considered useful (Bajracharya et al. Citation2015). Although results in this study present similarities to those found for the Sahel (Novella and Thiaw Citation2010), there are also differences. For the Sahel, PERSIANN had the highest percentage of observations closest to ground reports, and TARCAT yielded the lowest RMSE score among RFE, ARC, TRMM 3B42, and PERSIANN (Novella and Thiaw Citation2010). Conversely, TARCAT exhibited the highest RMSE score and PERSIANN the highest overestimation in this current study. This report highlights the need for local- or country-scale evaluation of rainfall products for their use in specific applications, instead of relying on regional-scale evaluation, which can lead to some discrepancies. On the other hand, contradictory results were found with studies performed in East Africa (Asadullah, McIntyre, and Kigobe Citation2008; Dinku et al. Citation2007). However, these studies were conducted in complex high-elevation terrain, whereas our study was performed in a relatively flat terrain. This may significantly impact the validation results (Novella and Thiaw Citation2010).
Since there were gaps in rain-gauge data used in this study, it is suggested that further studies be carried out for specific drought and flood years, with complete daily rain-gauge data. Moreover, it seems relevant to use more rain-gauge stations in future studies, so that the spatial patterns of rainfall using satellite products can be investigated, and a pixel-to-pixel analysis can be applied to conduct in-depth analysis.
Acknowledgements
The authors acknowledge NASA, NOAA, the University of Reading, and the University of California for providing easy access to the satellite-based rainfall products. This work was supported by the Global Rice Science Partnership (GRiSP); and the project ‘Improving rice productivity in lowland ecosystems of Burkina Faso, Mali and Nigeria through marker-assisted recurrent selection for drought tolerance and yield potential’ (Project Number: G7010.04.01) funded by the Global Challenge Program (GCP).
Disclosure statement
No potential conflict of interest was reported by the authors.
Additional information
Funding
References
- Ali, A., A. Amani, A. Diedhiou, and T. Lebel. 2005. “Rainfall Estimation in the Sahel. Part II: Evaluation of Rain Gauge Networks in the CILSS Countries and Objective Intercomparison of Rainfall Products.” Journal of Applied Meteorology 44 (11): 1707–1722. doi:10.1175/JAM2305.1.
- Asadullah, A., N. McIntyre, and M. Kigobe. 2008. “Evaluation of Five Satellite Products for Estimation of Rainfall over Uganda/Evaluation de cinq produits satellitaires pour l’estimation des précipitations en Ouganda.” Hydrological Sciences Journal 53 (6): 1137–1150. doi:10.1623/hysj.53.6.1137.
- Ashouri, H., K.-L. Hsu, S. Sorooshian, D. K. Braithwaite, K. R. Knapp, L. D. Cecil, B. R. Nelson, and O. P. Prat. 2015. “PERSIANN-CDR: Daily Precipitation Climate Data Record from Multisatellite Observations for Hydrological and Climate Studies.” Bulletin of the American Meteorological Society 96 (1): 69–83. doi:10.1175/BAMS-D-13-00068.1.
- Bajracharya, S. R., W. Palash, M. S. Shrestha, V. R. Khadgi, C. Duo, P. J. Das, and C. Dorji. 2015. “Systematic Evaluation of Satellite-Based Rainfall Products over the Brahmaputra Basin for Hydrological Applications.” Advances in Meteorology 2015: 1–17. doi:10.1155/2015/398687.
- Cohen Liechti, T., J. Matos, J.-L. Boillat, and A. Schleiss. 2012. “Comparison and Evaluation of Satellite Derived Precipitation Products for Hydrological Modeling of the Zambezi River Basin.” Hydrology and Earth System Sciences 16 (2): 489–500. doi:10.5194/hess-16-489-2012.
- Dinku, T., P. Ceccato, E. Grover‐Kopec, M. Lemma, S. Connor, and C. Ropelewski. 2007. “Validation of Satellite Rainfall Products over East Africa’s Complex Topography.” International Journal of Remote Sensing 28 (7): 1503–1526. doi:10.1080/01431160600954688.
- Diro, G., D. Grimes, E. Black, A. O’Neill, and E. Pardo‐Iguzquiza. 2009. “Evaluation of Reanalysis Rainfall Estimates over Ethiopia.” International Journal of Climatology 29 (1): 67–78. doi:10.1002/joc.1699.
- Duan, Z., W. Bastiaanssen, and J. Liu. 2012. “Monthly and Annual Validation of TRMM Mulitisatellite Precipitation Analysis (TMPA) Products in the Caspian Sea Region for the Period 1999–2003.” Paper presented at the 2012 IEEE International Geoscience and Remote Sensing Symposium (IGARSS), Germany, July 22–27.
- Ebert, E. E. 1996. Results of the 3rd Algorithm Intercomparison Project (AIP-3) of the Global Precipitation Climatology Project (GPCP). Research Rep. 55. Melbourne: Bureau of Meteorology Research Centre.
- Funk, C. C., P. J. Peterson, M. F. Landsfeld, D. H. Pedreros, J. P. Verdin, J. D. Rowland, B. E. Romero, G. J. Husak, J. C. Michaelsen, and A. P. Verdin. 2014. “A Quasi-Global Precipitation Time Series for Drought Monitoring.” Data Series 832. Vol. 4. Reston, VA: U.S Geological Survey. doi:10.3133/ds832.
- Gosset, M., J. Viarre, G. Quantin, and M. Alcoba. 2013. “Evaluation of Several Rainfall Products Used for Hydrological Applications over West Africa Using Two High-Resolution Gauge Networks.” Quarterly Journal of the Royal Meteorological Society 139 (673): 923–940. doi:10.1002/qj.2130.
- Grimes, D., E. Pardo-Igúzquiza, and R. Bonifacio. 1999. “Optimal Areal Rainfall Estimation Using Raingauges and Satellite Data.” Journal of Hydrology 222 (1–4): 93–108. doi:10.1016/S0022-1694(99)00092-X.
- Herceg, D., A. H. Sobel, and L. Sun. 2007. “Regional Modeling of Decadal Rainfall Variability over the Sahel.” Climate Dynamics 29 (1): 89–99. doi:10.1007/s00382-006-0218-5.
- Herman, A., V. B. Kumar, P. A. Arkin, and J. V. Kousky. 1997. “Objectively Determined 10-Day African Rainfall Estimates Created for Famine Early Warning Systems.” International Journal of Remote Sensing 18 (10): 2147–2159. doi:10.1080/014311697217800.
- Hirpa, F. A., M. Gebremichael, and T. Hopson. 2010. “Evaluation of High-Resolution Satellite Precipitation Products over Very Complex Terrain in Ethiopia.” Journal of Applied Meteorology and Climatology 49 (5): 1044–1051. doi:10.1175/2009JAMC2298.1.
- Hsu, K.-L., X. Gao, S. Sorooshian, and H. V. Gupta. 1997. “Precipitation Estimation from Remotely Sensed Information Using Artificial Neural Networks.” Journal of Applied Meteorology 36 (9): 1176–1190. doi:10.1175/1520-0450(1997)036<1176:PEFRSI>2.0.CO;2.
- Huffman, G. J., and D. T. Bolvin. 2013. TRMM and Other Data Precipitation Data Set Documentation, 1–40. Greenbelt, MD: NASA.
- Huffman, G. J., D. T. Bolvin, E. J. Nelkin, D. B. Wolff, R. F. Adler, G. Gu, Y. Hong, K. P. Bowman, and E. F. Stocker. 2007. “The TRMM Multisatellite Precipitation Analysis (TMPA): Quasi-Global, Multiyear, Combined-Sensor Precipitation Estimates at Fine Scales.” Journal of Hydrometeorology 8 (1): 38–55. doi:10.1175/JHM560.1.
- Ibrahim, B., J. Polcher, H. Karambiri, and B. Rockel. 2012. “Characterization of the Rainy Season in Burkina Faso and It’s Representation by Regional Climate Models.” Climate Dynamics 39 (6): 1287–1302. doi:10.1007/s00382-011-1276-x.
- Jobard, I., F. Chopin, J. C. Berges, and R. Roca. 2011. “An Intercomparison of 10-Day Satellite Precipitation Products during West African Monsoon.” International Journal of Remote Sensing 32 (9): 2353–2376. doi:10.1080/01431161003698286.
- Junzhi, L., Z. A-Xing, and D. Zheng. 2012. “Evaluation of TRMM 3B42 Precipitation Product Using Rain Gauge Data in Meichuan Watershed, Poyang Lake Basin, China.” Journal of Resources and Ecology 3 (4): 359–366. doi:10.5814/j.issn.1674-764x.2012.04.009.
- Lamptey, B. L. 2008. “Comparison of Gridded Multisatellite Rainfall Estimates with Gridded Gauge Rainfall over West Africa.” Journal of Applied Meteorology and Climatology 47 (1): 185–205. doi:10.1175/2007JAMC1586.1.
- Landsberg, H. E. 1975. “Sahel Drought: Change of Climate or Part of Climate?” Archiv für Meteorologie, Geophysik und Bioklimatologie, Serie B 23 (3): 193–200. doi:10.1007/BF02246775.
- Laurent, H., I. Jobard, and A. Toma. 1998. “Validation of Satellite and Ground-Based Estimates of Precipitation over the Sahel.” Atmospheric Research 47–48: 651–670. doi:10.1016/S0169-8095(98)00051-9.
- Maidment, R. I., D. Grimes, R. P. Allan, E. Tarnavsky, M. Stringer, T. Hewison, R. Roebeling, and E. Black. 2014. “The 30 Year TAMSAT African Rainfall Climatology and Time Series (TARCAT) Data Set.” Journal of Geophysical Research: Atmospheres 119 (18): 10,619–610,644. doi:10.1002/2014JD021927.
- Maidment, R. I., D. I. Grimes, R. P. Allan, H. Greatrex, O. Rojas, and O. Leo. 2013. “Evaluation of Satellite-Based and Model Re-Analysis Rainfall Estimates for Uganda.” Meteorological Applications 20 (3): 308–317. doi:10.1002/met.1283.
- Nicholson, S. E., B. Some, J. McCollum, E. Nelkin, D. Klotter, Y. Berte, B. Diallo, I. Gaye, G. Kpabeba, and O. Ndiaye. 2003a. “Validation of TRMM and Other Rainfall Estimates with a High-Density Gauge Dataset for West Africa. Part II: Validation of TRMM Rainfall Products.” Journal of Applied Meteorology 42 (10): 1355–1368. doi:10.1175/1520-0450(2003)042<1355%3AVOTAOR><1355:VOTAOR>2.0.CO;2.
- Nicholson, S. E., B. Some, J. McCollum, E. Nelkin, D. Klotter, Y. Berte, B. Diallo, et al. 2003b. “Validation of TRMM and Other Rainfall Estimates with a High-Density Gauge Dataset for West Africa. Part I: Validation of GPCC Rainfall Product and Pre-TRMM Satellite and Blended Products.” Journal of Applied Meteorology 42 (10): 1337–1354. doi:10.1175/1520-0450(2003)042<1337:VOTAOR>2.0.CO;2.
- Novella, N., and W. Thiaw. 2010. Validation of Satellite-Derived Rainfall Products over the Sahel, 1–9. Camp Springs, MD: Wyle Information Systems/CPC/NOAA.
- Novella, N. S., and W. M. Thiaw. 2013. “African Rainfall Climatology Version 2 for Famine Early Warning Systems.” Journal of Applied Meteorology and Climatology 52 (3): 588–606. doi:10.1175/JAMC-D-11-0238.1.
- Pombo, S., R. P. de Oliveira, and A. Mendes. 2015. “Validation of Remote-Sensing Precipitation Products for Angola.” Meteorological Applications 22 (3): 395–409. doi:10.1002/met.1467.
- Roca, R., P. Chambon, I. Jobard, P.-E. Kirstetter, M. Gosset, and J. C. Bergès. 2010. “Comparing Satellite and Surface Rainfall Products over West Africa at Meteorologically Relevant Scales during the AMMA Campaign Using Error Estimates.” Journal of Applied Meteorology and Climatology 49 (4): 715–731. doi:10.1175/2009JAMC2318.1.
- Tarnavsky, E., D. Grimes, R. Maidment, E. Black, R. P. Allan, M. Stringer, R. Chadwick, and F. Kayitakire. 2014. “Extension of the TAMSAT Satellite-Based Rainfall Monitoring over Africa and from 1983 to Present.” Journal of Applied Meteorology and Climatology 53 (12): 2805–2822. doi:10.1175/JAMC-D-14-0016.1.
- Thiemig, V., R. Rojas, M. Zambrano-Bigiarini, and A. De Roo. 2013. “Hydrological Evaluation of Satellite-Based Rainfall Estimates over the Volta and Baro-Akobo Basin.” Journal of Hydrology 499: 324–338. doi:10.1016/j.jhydrol.2013.07.012.
- Thiemig, V., R. Rojas, M. Zambrano-Bigiarini, V. Levizzani, and A. De Roo. 2012. “Validation of Satellite-Based Precipitation Products over Sparsely Gauged African River Basins.” Journal of Hydrometeorology 13 (6): 1760–1783. doi:10.1175/JHM-D-12-032.1.
- Toté, C., D. Patricio, H. Boogaard, R. Van der Wijngaart, E. Tarnavsky, and C. Funk. 2015. “Evaluation of Satellite Rainfall Estimates for Drought and Flood Monitoring in Mozambique.” Remote Sensing 7 (2): 1758–1776. doi:10.3390/rs70201758.
- Tucker, M., and C. Sear. 2001. “A Comparison of Meteosat Rainfall Estimation Techniques in Kenya.” Meteorological Applications 8 (1): 107–117. doi:10.1017/S1350482701001098.
- Xie, P., and P. A. Arkin. 1995. “An Intercomparison of Gauge Observations and Satellite Estimates of Monthly Precipitation.” Journal of Applied Meteorology 34 (5): 1143–1160. doi:10.1175/1520-0450(1995)034<1143:AIOGOA><1143:AIOGOA>2.0.CO;2.