
 ?Mathematical formulae have been encoded as MathML and are displayed in this HTML version using MathJax in order to improve their display. Uncheck the box to turn MathJax off. This feature requires Javascript. Click on a formula to zoom.
ABSTRACT
This study is aimed at demonstrating the application of vegetation spectral techniques for detection and monitoring of the impact of oil spills on vegetation. Vegetation spectral reflectance from Landsat 8 data were used in the calculation of five vegetation indices (normalized difference vegetation index (NDVI), soil adjusted vegetation index (SAVI), adjusted resistant vegetation index 2 (ARVI2), green-infrared index (G-NIR) and green-shortwave infrared (G-SWIR) from the spill sites (SS) and non-spill sites (NSS) in 2013 (pre-oil spill), 2014 (oil spill date) and 2015 (post-oil spill) for statistical comparison. The result shows that NDVI, SAVI, ARVI2, G-NIR and G-SWIR indicated a certain level of significant difference between vegetation condition at the SS and the NSS in December 2013. In December 2014 vegetation conditions indicated higher level of significant difference between the vegetation at the SS and NSS as follows where NDVI, SAVI and ARVI2 with p-value 0.005, G-NIR – p-value 0.01 and G-SWIR p-value 0.05. Similarly, in January 2015 a very significant difference with p-value <0.005. Three indices NDVI, ARVI2 and G-NIR indicated highly significant difference in vegetation conditions with p-value <0.005 between December 2013 and December 2014 at the same sites. Post-spill analysis shows that NDVI and ARVI2 indicated low level of significance difference p-value <0.05 suggesting subtle change in vegetation conditions between December 2014 and January 2015. This technique may help with the real time detection, response and monitoring of oil spills from pipelines for mitigation of pollution at the affected sites in mangrove forests.
1. Introduction
One of many critical global environmental problems is human and ecological exposure to hazardous wastes from agriculture, industrial, military, oil and mining activities. These wastes often include heavy metals, hydrocarbons and other organic chemicals (Slonecker et al. Citation2010). According to the European Environmental Agency (EEA Citation2007), there were about 242,000 contaminated sites in European Economic Area (EEA) countries that are in need of clean-up or remediation with about 80,000 sites having been cleaned-up. The main source of contamination are municipal and industrial waste disposals, mining and military sites no longer in operation, present and past industrial plants such as metallurgical, chemical, oil and wood (Agostini et al. Citation2007). This amount of waste has been predicted to increase by up to 50% by 2025. The EEA also reported in 2007 that heavy metals and mineral oil caused 37.3% and 33.7% of soil contamination respectively. The application of remote sensing for oil or hydrocarbon leaks detection, monitoring and remediation of contaminated sites dates back to the 1970s, initially through the use of aerial photographs (Casciello et al. Citation2007). In recent studies, ultraviolet (UV), thermal infrared and microwave sensors have been shown to have the potential for detecting oil pollution (Brekke and Solberg Citation2005; Fingas and Brown Citation1997). Recent developments in geospatial sensors, data analysis and communication technologies has presented new opportunities. There are a number of remote sensing images that can be used for monitoring oil pipeline and spills which include airborne and satellite radar, LIDAR, hyperspectral and multispectral sensors (Jha, Levy, and Gao Citation2008). Information on oil-contaminated sites during remediation process is important to policy makers and environmental observers on regular basis. Satellite sensors repeatedly observe wide areas of Earth’s surface, and continually acquire spatial information of ground features and environmental changes. Remote sensing images has been used for detection of stressed vegetation from hazardous liquid leakage, quantification of pollution/stress level and monitoring polluted sites after remediation (Van Der Werff et al. Citation2008). These studies have shown the capability of remote sensing for detection of environmental stress resulting from oil leaks from pipelines without direct contact (Da Silva et al. Citation2005). An increasingly common application of remotely sensed data is change detection where the state of an object or phenomenon over different period of time can be assessed (Singh Citation1989). Oil spill on the immediate natural environment can induce stress on the surrounding natural vegetation (Freedman Citation1995; Li, Ustin, and Lay Citation2005). The natural vegetation serves as a medium for water and gas atmospheric exchange, source and sink in biogeochemical cycles (Castell, Terradas, and Tenhunen Citation1994; Schulze, Beck, and Hohenstein Citation2005; Schulze Citation1986). Thus, any alterations in the plant biogeochemical cycle due to impact of oil, the vegetation can be used as a proxy to detect presence of pollution. Changes in vegetation spectral reflectance could be associated with stress from oil pollution (Noomen and Skidmore Citation2008). The detection, site characterization and remediation of polluted sites is typically a long and costly endeavour (Slonecker et al. Citation2010; Van Der Werff et al. Citation2008). As a result of expenses and time involved in the traditional methods of investigating environmental contamination or pollution, remote sensing offers an alternative efficient tool that is time saving, cost effective and non-destructive for detection of vegetation affected by oil spill (Van Der Meer et al. Citation2006; Van Der Werff et al. Citation2007; Hausamann, Zirnig, and Schreier Citation2003).
Historically, it has been documented that loss of pristine mangrove forest in the Nigeria’s Niger Delta are associated with exploration, extraction, transportation and refining of oil. For example, it has been reported by the Nigerian Federal Ministry of Environment that an estimated 13 million barrels of oil were lost in to the mangrove forest since production started in 1958–2014 (Langeveld and Delany, 2014). These oil spills from oil related activities in the region has remained in the environment for many years without been noticed at early stage as traditional (inspection by foot, helicopters etc.) method of detection and monitoring of the affected sites are limited by difficult access to such areas. The lack of full utilization of space technology had contributed negatively in tackling environmental/oil pollution in mangrove forest in Nigeria’s Niger Delta region. Thus, application of space technology backed by policy will improve timely identification, detection and restoration of widespread forest damages as a results of oil activities. This will help in reducing the large scale impact of oil spills on the mangrove forest if the oil spills are detected at early stage. The lack of early detection of mangrove forest affected by these oil spills in some areas the oil remain in the environment without clean-up and restoration (e.g. Ogoniland, Nigeria) United Nations Environmental Programme (UNEP Citation2011). In 2011, the UNEP investigation report recommended the cleaned-up and restoration of the affected sites. In June 2016, the Federal Government of Nigeria adopted the UNEP recommendation to begin the remediation and recovery process of the areas affected by oil pollution.
Studies have shown that oil-impacted mangroves suffer from very harmful to less harmful effects from oil exposure (Hoff et al. Citation2002; Lewis Citation1983). Vegetation health and vigour can be affected by hydrocarbons through spillage onto roots, stems, leaves and soil (UNEP Citation2011; Van Der Meijde et al. Citation2009; Lin et al. Citation2002). Simonich and Hites (Citation1995), explained that settling down of hydrocarbon particulates and it gaseous contents on leaves and intake via leaf stomata may affect the vegetation. Noomen (Citation2007) have shown that hydrocarbons may have a negative effect on plants and that lack of oxygen in soil environment coupled with increase in Carbon Dioxide (CO2) are some of the factors that are responsible for the stress in plants. In response to oil spill concentration, the colour of plant leaves changes with a loss of photosynthesis pigments (Pezeshki et al. Citation2000; Yang et al. Citation2000). Leaf spectral reflectance can be measured to determine whether leaf reflectance responses to plant stress may differ according to the agent of stress and species (Carter Citation1993). The mineral alteration that occurs in the soil and geobotanical anomaly (e.g. abnormal behaviour of vegetation) that reflected in the portion of the electromagnetic spectrum has become evidence for detecting hydrocarbon leakage (Noomen and Skidmore Citation2008) from the oil facilities.
Various remote sensing techniques have been used for detection of oil spill impacts on vegetation including vegetation indices (Li, Ustin, and Lay Citation2005). Relationship between plant vitality and oil/gas pollution can be assessed using spectral indicators (Van Der Meer et al. Citation2002; Arellano et al. Citation2015). Khanna et al. (Citation2013), used vegetation indices including NDVI from Airborne Visible/Infrared Imaging Spectrometer (AVIRIS) data to detect vegetation stress and recovery from oil spills in wetland areas of Louisiana, USA. Hyperspectral AVIRIS data sets were used to investigate vegetation stress due to the oil spill at the Jornada Long Term Ecological Research (LTER), New Mexico (Li, Ustin, and Lay Citation2005). These studies demonstrated the potential capability of vegetation indices in determining the variation in vegetation spectra affected by oil pollution. It has also been shown that vegetation indices such as modified normalised difference vegetation index (mNDVI) and Normalised Difference Infrared Index (NDII) were effective in conjunction with biogeochemical data to analyse changes in Gulf Coast wetlands affected by oil spills (Mishra et al. Citation2012). In previous work we evaluated the capabilities of twenty vegetation indices derived from Landsat 5 and 7, only five (normalised difference vegetation index (NDVI), soil adjusted vegetation index (SAVI), adjusted resistant vegetation index 2 (ARVI2), green-infrared index (G-NIR) and green-shortwave infrared (G-SWIR) have shown potential for detection and monitoring of vegetation affected by oil spills. This study builds on the findings of (Adamu, Tansey, and Ogutu Citation2015) to demonstrate the potential application of these five indices derived from Landsat 8. This work focuses on vegetation indices derived from newly Landsat 8 data used for spatial and temporal analysis of oil spill sites. The findings could benefit not only the remote sensing community but other environmental agencies, government, non-governmental, cooperate organisations etc. for the purpose of detecting and monitoring of contaminated and remediated site not only oil spill sites.
2. Study area
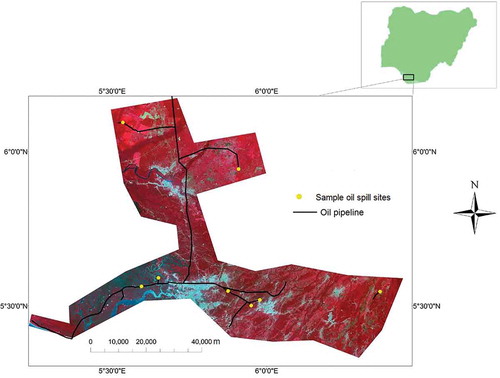
The study site is located in Warri, South West in the Nigeria’s Niger Delta located at 4°33ʹ27.77”N, 6°52ʹ34.43”E with ground area of 1,722 km2 (). The region experiences moderate rainfall and humidity for most of the year. The climate is equatorial and marked by two distinct seasons: the dry season and the rainy season. The physical environment of the Niger Delta region generally harbours a wide variety of trees and plants including different kinds of mangrove trees, grasses, herbs and climbers that are attributed to the depositional nature of the shoreline (Ashton-Jones Citation1998). The rhizophora racemosa also known as red mangrove occupies more than 90% of the saline swamps and dominates the main vegetation of the mangrove swamps in the region (Mmom and Arokoyu Citation2010). The Avicennia Africana also known as White mangrove is found sparsely distributed amongst the Red mangrove and survives in less water-logged areas. There are common vegetation where salt water content is not too high includes ferns (acrostichum aureum), Nympa Palm (Nympa fruticans), and herbs (paspalum vaginatum) (UNEP Citation2011; Adoki Citation2013). The mangrove swamp in the eastern flank of the Niger Delta is the conspicuous presence Nympa palm, an exotic species. In the saltwater zone (Rhizophora Mangle) vegetation type is restricted to the coastal strip, which varies in width. The mangroves in this study sites are dense and in full canopies in some areas may have been affected by human activities such as agriculture. Where oil pollution occurred beneath the canopies the vegetation may damage depending on the size and severity of the oil. For example, areas with a severe oil impact beneath the vegetation canopy may show a change in leaf colour that may result in the death of the plant.
Figure 1. The insert figure is the location of country/province/the Nigeria’s Niger Delta’ (image data false colour composite (bands 5, 4 and 3)), pipeline and oil spill sites.
3. Data and method
Cloud cover in the Niger Delta persists for most of the wet season and only partially clears in the dry season. Therefore, it is appropriate to obtain a cloud free data that fall in the dry season in the months of December and January. Thus, for this study, images acquired on the 20 December 2013, 23 December 2014 and 10 January 2015 were used. are the nine oil sample spill sites showing the difference in time (number of days) between the oil spill and image acquisition date, spill location and quantity of oil spill in barrels (bbl). The oil spill data were obtained from Nigeria Oil Spill Detection and Response Agency (NOSDRA) [http://nosdra.gov.ng/] achieves at https://oilspillmonitor.ng/.
Table 1. Information on oil spill data for the study site.
3.1. Remote sensing approach to vegetation stress
Much of the previous literature outlined in the previous section have used vegetation indices derived from hyperspectral data for detection of vegetation affected by oil spills. However, relatively few of these studies focused on indices derived from broadband multispectral data. This study will focus on the application of five vegetation indices derived from Landsat 8 sensor (where spectral bands Blue = Band 2 (0.45–0.51µm), Green = Band 3 (0.53–0.59 µm), Red = Band 4 (0.64–0.67 µm), NIR = Band 5 (0.85–0.88 µm), SWIR I = Band 6 (1.57–1.65 µm) and SWIR II = Band 7 (2.11–2.29 µm))
Spectral bands (Red and NIR) combination used in the calculation of NDVI has been shown to demonstrate unique spectral characteristics for the detection of vegetation stress. For example, the red band is sensitive to changes in chlorophyll contents in the visible spectrum and the NIR has a capacity to characterise vegetation varieties and conditions. The index has been successfully used for characterising vegetation cover and it is still considered a great potential for application in environmental monitoring because of it low cost compared to hyperspectral data (Rouse et al. Citation1973; Running et al. Citation1994).
The SAVI index developed by Huete (Citation1988) and Huete et al. (Citation1992) incorporated an adjustment factor of canopy background and atmospheric conditions to address noise found in NDVI. This index is useful for addressing the soil and atmospheric effects (Rondeaux, Steven, and Baret Citation1996).
The ARVI2 index was designed to be resistant to atmospheric effects and more sensitive to a wide range of chlorophyll concentrations. Both NDVI and ARVI2 are sensitive to vegetation fraction and to rate of absorption of photosynthetic solar radiation (Gitelson, Kaufman, and Merzlyak Citation1996; Kaufman and Tanre Citation1992).
The G-NIR index is a simple combination of green and near-infrared reflectance values. The green band has the capacity to assess plant vigour while the NIR characterise vegetation internal structure (Sripada et al. Citation2005). It has also shown potential to discriminate between vegetation affected by oil spill and unaffected both spatially and temporally (Adamu, Tansey, and Ogutu Citation2015).
The G-SWIR-based) indices have a capacity to predict and sense nitrogen in plants (Herrmann et al. Citation2010). SWIR is also capable of discriminating moisture content of soil and vegetation (Karnieli et al. Citation2001) therefore G-SWIR could be useful in detecting changes in vegetation affected by oil spill.
3.2. Image data
Landsat 8 OLI images were collected on path 189 and row 57 are Level 1 terrain corrected products for 20 December 2013 (pre-spill), 23 December 2014 (oil spill date) and 10 January 2015 (post spill) were used in the study. The images were acquired with minimal cloud cover <26% at the scenes centre. The images were radiometrically calibrated (i.e. the images were converted from digital number (DN) to radiance image) in a band-interleaved-by-line (BIL) format with a scale factor of 1.0 (μW cm–2 sr–1 nm–1). The calibrated images were then used as the input files ready to apply the Fast Line-of-sight Atmospheric Analysis of Spectral Hypercubes (FLAASH) routine available on the Exelis Environment Visual Information. The input information for the FLAASH e.g. flight date and time, sensor altitude and location, scene centre location, sensor type etc. required for the processing of the images were obtained from the metadata file extension (.MTL file). The average ground elevation is set at 0.4 km for the location of the study sites and pixel size of 30m used for the adjacency correction. The location of the study area is a tropical zone, thus, the atmospheric model is set as tropical. Water column multiplier is not applicable in this work because the sensor does not have the appropriate bands to perform the retrieval. In this case the water retrieval was set to ‘No’ option and column water vapour amount is determined by selected atmospheric model. The minimum initial visibility is 40 km and aerosol model is rural aerosol retrieval is set at 2-Band Kaufman-Tanre (K-T).
3.3. Data analysis
The reflectance data from the three Landsat 8 images were used in the calculation of the five vegetation indices for 18 sample sites (i.e. 9 oil spill sites (SS) identified along the oil pipeline route and 9 stratified randomly selected non-spill sites (NSS) for the years 2013, 2014 and 2015. The vegetation type (mangrove forest) where these samples were collected have similar biophysical characteristics. Samples at the NSS were chosen where there are no oil facilities and used as control points. At each of the oil spill point nine pixels around the polluted pixel (in a 3 × 3 window pixels) were sampled for extracting vegetation spectra and used for calculation of the vegetation indices. This was done because oil from spills may migrate from point of source thereby affecting neighbouring surroundings. For example, in Nigeria by law oil pipeline routes (right-of-way) of pipelines shall be 30 m wide from each side (Edjenekpo Citation2015; Konne Citation2014; UNEP Citation2011). Therefore, the nine pixels from Landsat data is buffered at around 100 m within the pipeline corridor. The reflectance spectra for each pixel were calculated and then averaged the computed indices from the nine pixels to represent each spill sites for analysis. This technique was replicated in the selection and computation of samples at the non-spill sites (i.e. vegetation not affected by pollution) away from oil facilities.
Vegetation condition on the 20 December 2013 (pre-spill), 23 December 2014 (spill-date) and 10 January 2015 (post-spill) was assessed from satellite data, statistically tested and compared. Thus, the following assumptions were tested using a paired t-test statistics: i) that spatially, vegetation affected by oil spills at the SS will spectrally respond differently with the ones at the NSS in 2014 (spill-date), ii) vegetation at the SS will spectrally respond indifferently with the ones at the NSS on the 20 December 2013 (pre-spill) and 10 January 2015 (post-spill), and iii) temporally, spectral response of vegetation affected by oil spills in 2014 at the SS will differ with ones obtained in 2013/2014 and 2014/2015. Meanwhile, it is expected that vegetation conditions may remain relatively invariant at the NSS in 2013, 2014 and 2015. Note that both SS in 2013 and NSS (2013, 2014 and 2015) were used as a control points in this analysis.
4. Results
In this section, we first analysed difference in vegetation at the SS and the ones at the NSS in 2014 in section 4.1. We also show the significant difference in vegetation between the SS and NSS in 2013, 2014 and 2015. In section 4.2 change in vegetation conditions at the SS and NSS from pre-spill, spill date and post-spill were analysed.
4.1. Impact of oil spill on vegetation
To determine whether vegetation affected by oil spills at the SS respond spectrally different with the ones at the NSS, vegetation indices obtained from 23 December 2014 was used. The calculated indices are expected to show low values at the SS and high values at the NSS in the 23 December 2014 (i.e. oil spill date). shows the difference between vegetation indices obtained at SS and NSS at the oil spill sites in 2014.
Figure 2. Box plot for the calculated mean of the 5 vegetation indices from (SS) and (NSS) sites for the 18 sample points each in 23 December 2014, where Q stands for quartile.
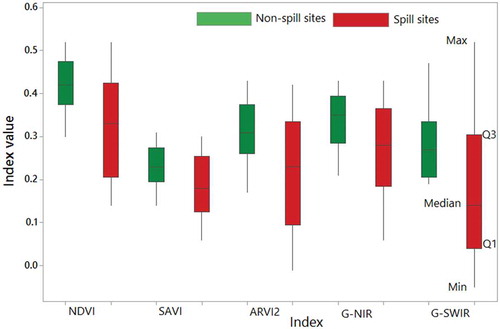
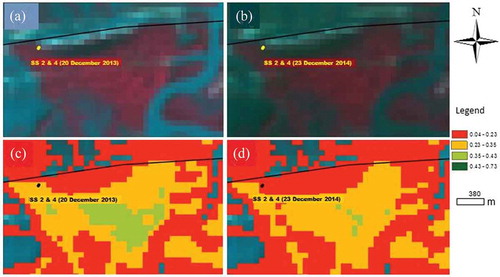
Figure 3. Oil spill sites (SS2 and SS4) detected by Landsat data (a & b) and NDVI (c & d) for 20 December 2013 and 23 December 2014.
demonstrates the result of the t-test was computed to determine if there are significant differences between the vegetation indices at the SS and NSS in 2014. The results show that four vegetation indices (NDVI, SAVI, ARVI2 and G-NIR) indicated higher level of significant difference between the ones obtained at the SS and NSS, only G-SWIR indicated low level of significant difference at p-value 0.05.
Table 2. A comparison of p-value from paired t-test analysis for the study sites (SS and NSS sites) in 23 December 2014.
4.2. Change detection of vegetation conditions at the SS and NSS
In vegetation indices obtained from 23 December 2013 Landsat 8 image at the both SS and NSS were statistically compared. The results show that the five vegetation indices indicated a level of significant difference with p-value <0.05. In 23 December 2014 three indices (NDVI, SAVI and ARVI2) indicated higher level of significant difference between the vegetation at SS and NSS with p-value <0.005. In the post-spill image in 10 January 2015 which has a small time difference with the image in 23 December 2014 showed almost the similar results with that of 2014. For example, NDVI and ARVI2 indicated a highly significant difference with p-value <0.005 between SS and NSS while SAVI and NIR level of significant difference with p-value <0.01. G-SWIR remain relatively the same (no change) in 2013, 2014 and 2015.
Table 3. Analysis of change detection using paired t-test statistics of means of vegetation indices at the SS and NSS.
To further explain the vegetation status at the SS before and after oil spill, the vegetation conditions at the SS before oil spill in 20 December 2013 and 23 December 2014 show that NDVI, ARVI2 and G-NIR indicated higher level of significant difference with p-value 0.005 in . This is because in 2013 vegetation at these spill sites did not experience oil spill. In vegetation condition at pre-supposed SS and NSS in 2013 exhibited low level of significant difference compared to 2014. Thus, spectral changes exhibited by vegetation at these sites in 2013 (pre-spill) may not be related to oil spill. SAVI and G-SWIR indicated no significance. Similarly, at the same sites vegetation response to oil spill in 23 December 2014 and after spill in 10 January 2015, NDVI, SAVI and G-NIR indicated level of significant difference with p-value <0.05. Vegetation indices e.g. SAVI indicated very significant level with (p-value <0.005) and G-SWIR (p-value <0.0001) between December 2014 and 10 January 2015. The three indices (NDVI, ARVI2 and G-NIR) suggests some evidence of plant spectral alterations/changes in vegetation affected by oil pollution between 20 December 2013 and 23 December 2014 at the same sites. In , the 23 December 2014/10 January 2015 show that vegetation conditions between the periods did not change significantly compare to the ones observed in 20 December 2013 and 23 December 2014. The level of significant difference between SS and NSS in 2014 in depends on the volume of the oil and severity on vegetation at SS. Also, since there was no oil spill incident at the SS in 2013 it would be expected that vegetation at the NSS may not differ at high significant level as in 2014. However, a noticeable difference between the two sites could be due to other stressors (anthropogenic and natural) which may not be related to oil spill. Thus, the mean significant difference between SS and NSS in 2013 may be small (as shown in ) compare with the ones in 2014 and 2015 in .
Table 4. shows the t-test analysis of the mean values for indices of vegetation affected by oil spill at the SS.
5. Discussion
5.1. Vegetation response to oil spill
The activity of oil production and transportation in the Niger Delta remains one of the main sources of oil pollution affecting mangrove forest. Pollution leads to leaf defoliation and deformation, changes in vegetation density and distribution of plants (Hoff et al. Citation2002). Changes in mangrove canopy properties from oil spills can be diagnosed through the change in leaf spectral reflectance (Van Der Meer et al. Citation2002). One of the important remote sensing tool used for monitoring oil affected mangroves in the study is the leaf spectral changes as an indicator for detecting vegetation impacted by the oil spills (Hoff et al. Citation2002; Arellano et al. Citation2015). The presence of hydrocarbons in forest sites seems to produce a change in the internal structure of the plant that results in low reflectance values and gas affected areas may also be responsible for low vegetation density (Noomen Citation2007). Thus, vegetation condition in oil affected mangroves can be detected by analysing the leaf spectral reflectance and the vegetation indices derived from these spectral bands (Oliveira, Crosta, and Goncalves Citation1997).
5.1.1. Effects of oil spill on the vegetation indices at the SS and NSS in 2014
In the box plot shows that the five indices (NDVI, SAVI, ARVI2, G-NIR and G-SWIR) show a capacity to detect changes in vegetation chlorophyll content, leaf internal structure and water contents in leaf that relates to stress. Research has attributed these biochemical alterations in forest areas where oil facilities are located (Arellano et al. Citation2015; Noomen et al. Citation2012). Data in shows that there is a high level of significant difference between vegetation at the SS and NSS (NDVI, SAVI, ARVI2 and G-NIR), this might suggest that vegetation at the SS responded spectrally different with the ones at the NSS. The performance of these indices e.g. NDVI could be related to their sensitivity to changes in leaf chlorophyll content and internal structure as demonstrated in (Gitelson, Kaufman, and Merzlyak Citation1996). ARVI2 performance can also be attributed to its ability to resist atmospheric effect while SAVI is designed to address the background noise present in NDVI. These characteristics have made them potentially capable to detect changes in spectral properties of vegetation affected by oil spills and ability to discriminate them from the ones at the NSS as found in (Adamu, Tansey, and Ogutu Citation2015). The low levels of chlorophyll recorded by these spectral bands can be as a result of vegetation stress as it may reduce photosynthetic activity in vegetation affected by oil spills at the investigated sites (SS) in 23 December 2014. Therefore, the differences in the vegetation spectral properties at the SS and NSS could be used to suggest the basis on the result in that vegetation at SS may have been exhibiting symptoms of stress due to oil spills compare to the ones at NSS in 23 December 2014. These results show that some vegetation indices were able to spatially discriminate between vegetation conditions at the areas oil spills were recorded (SS) and where no spills (NSS).
5.1.2. Spatial and temporal changes in vegetation condition between SS and NSS
It is equally important to assess the general vegetation conditions in the study area before and after oil spill to determine if they differ with ones found at the SS and NSS over time (2013, 2014 and 2015). The results in show that vegetation conditions in 20 December 2013 between the SS and the NSS sites were at low level of significant different with p-value <0.05 for all the five indices. Similarly, for 23 December 2014 (year of oil spill) the results of three indices (NDVI, SAVI and ARVI2) indicated higher level of significant difference with p-value <0.005 between vegetation conditions at the SS and NSS. G-SWIR indicated a low level of significance with a p-value <0.05 between the two SS and NSS. In 2015, which was used as the post-spill year, significant difference was observed between vegetation at the SS and NSS and only G-SWIR maintaining consistency over the period (2013, 2014 and 2015). The G and SWIR band may have influenced the result as it is sensitive on peak of vegetation and useful for assessing plant vigour and water contents in plants but appear less sensitive in this study. In Adamu, Tansey, and Ogutu (Citation2015), the combination of spectral bands from R and NIR indicated consistent sensitivity. It is expected that this index will provide contrasting information on plant vigour and water contents at SS and NSS. Notwithstanding evidence from this result may suggest that vegetation spectral difference 2013 between SS and NSS were relatively similar. In 2014 vegetation status at the SS and NSS appears to differ with the ones at NSS which could be as a result of spectral changes in vegetation affected by oil spill. The post-spill analysis which did not present much difference with the ones in 23 December 2014 suggest that vegetation conditions between SS and NSS in 10 January 2015 may still be under stress due to the influence of oil residues at the spill sites.
The 23 December 2014 image was used for the observation of the oil spill impact and the post-spill in 10 January 2015 have only 16 days difference in acquisition. This possibly indicates that the time difference influences the sensor’s ability to detect any subtle change in vegetation spectral reflectance at the SS. The purpose of using the 2015 image was to examine the changes in vegetation as a recovery from an oil spill that took place in 2014. Unfortunately, it did not indicate any significant change which could be due to a slower recovery of the vegetation. More research on this issue is needed.
5.1.3. Temporal changes in vegetation condition between SS
The assumption that the vegetation condition at the same spill site in 20 December 2013 (pre-spill) and 23 December 2014 (spill-date) could differ. Two indices SAVI and G-SWIR did not detect any significant differences in vegetation at the SS in January 2013 and 10 January 2014. But NDVI, ARVI2 and G-NIR indicated a significant difference during the same period and sample points. In contrast, the post spill scenario there are highly significant differences in vegetation condition in 23 December 2014 and 10 January 2015 indicated by G-SWIR with p-value <0.0001, NDVI and SAVI with p-value <0.005 and least significance from ARVI2 and G-NIR with p-value <0.05. In Figure4 below there are two sample sites 2 and 4 where oil spill events took place twice at different dates and in the same place.
5.2. Visual interpretation of detected oil spill sites
A visual interpretation of the spill sites detected by Landsat using NDVI in 2013 and 2014 is shown in (–). The image (a and b) and NDVI (c and d) of 2013 showing vegetation at the spill site before the oil spill in (–) compared with (,). The vegetation cover in NDVI map of 2013 (()) appeared educed in 2014 (()).
Figure 4. Oil spill sites (SS2 and SS4) detected in (b) Landsat data shown in Google Earth image of (a) February 2010, (c) June 2015 and (d) NDVI overlaid on 10 January 2015 Google image.
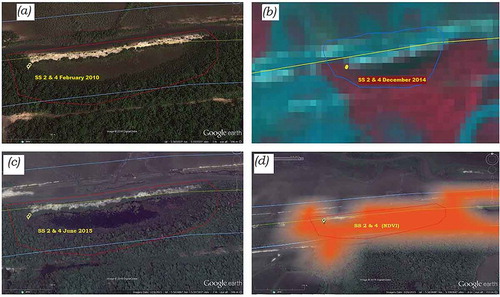
, SS 2 and SS 4 were detected by these indices derived from 2014 data. In the figure a pre-spill image from Google Earth for 10 February 2010 (()) was used as the 2013 was not available. As observed in the image (()) the vegetation appearance changed compare with the one in post-spill image 2015 (()). The Landsat data for 23 December 2014 used for the detection (()) and the NDVI overlaid on the post-spill image 2015 (()). The events at these sites for example SS2 occurred on the 25 November 2014 and about 5000 bbl volume of oil spilt in to the environment. Four weeks (28 days) after the oil spill the image was acquired on the 23 December 2014 which the sensor was able to record the spectral changes in vegetation affected. Other spill sites appear to show a subtle change in the vegetation due to oil spill size and gap in number of days between the oil spill event and image acquisition dates. The subtle spectral changes in vegetation at other SS were not effectively detected using 30m resolution compared to SS2 & SS4. From these analyses, it can be stated that the NDVI, SAVI, ARVI2 and G-NIR could be used to characterise the impacts of oil spill on vegetation health. The G-SWIR seemed inconsistent in showing the impacts of oil spills on vegetation which contradicts it performance in Adamu, Tansey, and Ogutu (Citation2015).
5.3. Implications for oil spill detection and monitoring
The development of effective strategies to plan for and respond to oil spills is predicated on a suitable methodology to accurately classify remotely sensed information. Previous works suggested strategies applied to mangrove forest have been confined to utilising methodologies that in many cases are expensive, time consuming, limited in spatial and temporal coverage or unsuitable in detecting oil spills under canopy cover (Hoff et al. Citation2002; Van Der Meer et al. Citation2006; Fingas and Brown Citation1997). These techniques are therefore considered inappropriate for the purpose of the accurate detection of oil spills and the advisement of suitable containment and clean-up models in regions where mangrove forests are ecologically important and need to be carefully managed. This has prompted the introduction of an alternative methodology, as developed in this study, which maintains the effectiveness of detecting oil spills while reducing costs and increasing the spatio-temporal resolution of post-event monitoring. The technique described in this paper is demonstrated as an effective tool in the early detection of oil spills in areas of poor accessibility (e.g. 28 days post-event; ) and hence enhances the ability to quickly respond to spill events. Other studies, Duke and Burns (Citation1999) for example, have similarly observed oil spill-induced stress on plants within this short time scale of detection, a feature which may be dependent on the volume of the oil spill (Adamu, Tansey, and Ogutu Citation2016; Pezeshki et al. Citation2000). For comparatively larger oil spills a 30m resolution sensor was found to be sufficient in detecting changes in the spectral reflectance of affected plant material. Oil spills of a lesser volume, meanwhile, appear to have a subtle impact on vegetation with mapping limited by the resolution of the sensor. The ability to monitor the recovery of vegetation post-spill was also assessed through the use of Google Earth imagery collected on an annual basis from 2014 to 2016. Studies have shown that the residue from oil spills may remain in the environment several months post event (Yim et al. Citation2011). This study demonstrates how oil spill detection should be able to facilitate information provision to local authorities and how this technique can be useful for to oil spill response in mangrove areas. This was done to provide information on areas where response may be needed for mitigating the impact of oil spill on vegetation at early stage. Post-spill data assessed and monitor the remediation/clean-up process of the affected sites. Secondly, vegetation at the SS and NSS were used to discriminate between vegetation affected by the oil spill and unaffected ones.
The performance of these indices in this study could have been influenced by variation between individual pigments between the same vegetation type, physical environment, climatic conditions, volume of oil spill, image and spill date. For instance, number of days between the oil spill and image is one day minimum and the maximum is six months. Thus, in this study it might be possible that sensor may have not recorded subtle spectral changes in vegetation properties due to low volume of oil spill at some spill sites and sensor spatial characteristics. However, as observed at some spill sites (SS2 and SS4) where there was large oil spill, the sensor resolution was able to detect the spectral changes in vegetation resulting from oil spill () after 28 days of oil spill. Also, it is very important to note that not all stressed vegetation may be related with oil spills. For example, environmental conditions can be an agent of stress that may lead to dehydration in vegetation (Carter Citation1993). Droughts lower water potentials in plants and subsequently decrease transpiration. Stress conditions that induced damage in vegetation could be from biotic, abiotic and anthropogenic stressors (Yim et al. Citation2011). Biotic stress in vegetation includes disease infection, competition and herbivory and the abiotic includes temperature, water, chemical and mechanical stress (Schulze, Beck, and Hohenstein Citation2005). Stress in vegetation from anthropogenic activities, for example in the Niger Delta region are related to the process of exploration and exploitation of oil and gas resources (UNEP Citation2011). The exploration process includes removal of vegetation for site selection, facility construction and operations (Gitelson, Kaufman, and Merzlyak Citation1996; Kaufman and Tanre Citation1992). Vegetation can be affected by chemical substances and other wastes that are released into the soil during operation activities (Sripada et al. Citation2005). Thus, identifying and monitoring of anthropogenic stress on vegetation such as oil spills can be validated using a priori knowledge of the oil facility sites, oil spill record and GPS location of the affected sites.
6. Conclusions
We have shown that there is great potential of using vegetation indices derived from Landsat 8 for detection and monitoring of oil spill in oil producing environments. The technique could also be useful for monitoring environmental compliance in oil producing areas where polluted sites may require remediation or clean-up. For example, the clean-up process of contaminated sites in Ogoniland Nigeria which has been recommended by UNEP report in 2011 has started in June 2016. The results in this study is essential not only to the oil industry but to government and non-governmental environmental agencies who are responsible for safe guarding natural environment. Local authorities could benefit from the effective and low cost of monitoring oil facilities using space technologies. With the recent launch of Sentinel 2 offering free data with high spatial resolution of 10m and temporal resolution of 12 days could also be useful for detecting small spill sites with lower volume of oil spill. Further study will require considering other factors such as how variations in local physical environment, vegetation plant species type (as the respond differently to oil spill), oil type (as different types of oil vary in severity to plants), satellite sensor characteristics (e.g. spectral and spatial resolution), time gap between spill and image date and volume of oil that could be influential. In conclusion, the study has demonstrated potential application of remote sensing techniques such as vegetation indices to detect and monitor vegetation affected by oil spills in mangrove forest. It worth to suggest that this technique could be applied for early mitigation response to reduce the impact on the environment before it cause a large scale damage.
Acknowledgments
This work is supported and funded by the Petroleum Technology Development Fund (PTDF) under the Federal Government of Nigeria [PTDF/E/OSS/PHD/AB/347/11] and Modibbo Adama University of Technology (MAUTECH) Yola, Nigeria [MAUTECH/R/SP1132/Vol.1].
Disclosure statement
No potential conflict of interest was reported by the authors.
Related Research Data
References
- Adamu, B., K. Tansey, and B. Ogutu. 2015. “Using Vegetation Spectral Indices to Detect Oil Pollution in the Niger Delta.” Remote Sensing Letters 6 (2): 145–154. doi:10.1080/2150704x.2015.1015656.
- Adamu, B., K. Tansey, and B. Ogutu. 2016. “An Investigation into the Factors Influencing the Detectability of Oil Spills Using Spectral Indices in an Oil-Polluted Environment.” International Journal of Remote Sensing 37 (10): 2166–2185. doi:10.1080/01431161.2016.1176271.
- Adoki, A. 2013. “Trends in Vegetation Cover Changes in Bonny Area of the Niger Delta.” Journal of Applied Sciences and Environmental Management 17 (1): 89–103.
- Agostini, P., C. Carlon, A. Critto, and A. Marcomini. 2007. “A Step toward Contaminated Megasite Management: Six European Experiences at Comparison.“Landfill Research Trends, edited by A. A. Velini. 47–73.
- Arellano, P., K. Tansey, H. Balzter, and D. S. Boyd. 2015. “Detecting the Effects of Hydrocarbon Pollution in the Amazon Forest Using Hyperspectral Satellite Images.” Environmental Pollution 205: 225–239. doi:10.1016/j.envpol.2015.05.041.
- Ashton-Jones, N. 1998. The Human Ecosystems of the Niger Delta: An ERA Handbook. Benin-City, Nigeria: Environmental Rights Action.
- Brekke, C., and A. H. S. Solberg. 2005. “Oil Spill Detection by Satellite Remote Sensing.” Remote Sensing of Environment 95 (1): 1–13. doi:10.1016/j.rse.2004.11.015.
- Carter, G. A. 1993. “Responses of Leaf Spectral Reflectance to Plant Stress.” American Journal of Botany 80 (3): 239–243. doi:10.2307/2445346.
- Casciello, D., T. Lacava, N. Pergola, and V. Tramutoli. 2007. Robust Satellite Techniques (RST) for Oil Spill Detection and Monitoring. Paper Presented at the Analysis of Multi-Temporal Remote Sensing Images, 2007. MultiTemp 2007. International Workshop on the.
- Castell, C., J. Terradas, and J. D. Tenhunen. 1994. “Water Relations, Gas Exchange, and Growth of Resprouts and Mature Plant Shoots of Arbutus Unedo L. And Quercus Ilex L.” Oecologia 98 (2): 201–211. doi:10.1007/bf00341473.
- Da Silva, H. V., C. K. Morooka, I. R. Guilherme, T. C. Da Fonseca, and J. R. P. Mendes. 2005. “Leak Detection in Petroleum Pipelines Using a Fuzzy System.” Journal of Petroleum Science and Engineering 49 (3): 223–238. doi:10.1016/j.petrol.2005.05.004.
- Duke, N. C., and K. A. Burns. 1999. Fate and Effects of Oil and Dispersed Oil on Mangrove Ecosystems in Australia. Townsville, Australia: Australian Institute of Marine Science.
- Edjenekpo, L. E. 2015. “Employee Perception of Nigerian Content, Corporate Social Responsibility and Sustainability Issues in the Oil and Gas Equipment and Service Industry in the Niger Delta: 2010 and Beyond.” Corporate Social Responsibility and Sustainability Issues in the Oil and Gas Equipment and Service Industry in the Niger Delta. doi:10.2139/ssrn.2552934
- EEA. 2007. EEA Environmental Statement 2007. Copenhagen, Denmark: European Environment Agency
- Fingas, M. F., and C. E. Brown. 1997. “Review of Oil Spill Remote Sensing.” Spill Science & Technology Bulletin 4 (4): 199–208. doi:10.1016/S1353-2561(98)00023-1.
- Freedman, B. 1995. Environmental Ecology: The Ecological Effects of Pollution, Disturbance, and Other Stresses. San Diego: Academic Press.
- Gitelson, A. A., Y. J. Kaufman, and M. N. Merzlyak. 1996. “Use of a Green Channel in Remote Sensing of Global Vegetation from EOS-MODIS.” Remote Sensing of Environment 58 (3): 289–298. doi:10.1016/S0034-4257(96)00072-7.
- Hausamann, D., W. Zirnig, and G. Schreier. 2003. Monitoring of Gas Transmission Pipelines–A Customer Driven Civil UAV Application. Paper presented at the ODAS Conference.
- Herrmann, I., A. Karnieli, D. J. Bonfil, Y. Cohen, and V. Alchanatis. 2010. “SWIR-based Spectral Indices for Assessing Nitrogen Content in Potato Fields.” International Journal of Remote Sensing 31 (19): 5127–5143. doi:10.1080/01431160903283892.
- Hoff, R., P. Hensel, E. Proffitt, P. Delgado, G. Shigenaka, R. Yender, and A. J. Mearns. 2002. “Oil Spills in Mangroves. Planning & Response Considerations. National Oceanic and Atmospheric Administration (NOAA).” EUA. Technical Report.
- Huete, A. R. 1988. “A Soil-Adjusted Vegetation Index (SAVI).” Remote Sensing of Environment 25 (3): 295–309. doi:10.1016/0034-4257(88)90106-X.
- Huete, A. R., G. Hua, J. Qi, A. Chehbouni, and W. J. D. Van Leeuwen. 1992. “Normalization of Multidirectional Red and NIR Reflectances with the SAVI.” Remote Sensing of Environment 41 (2–3): 143–154. doi:10.1016/0034-4257(92)90074-T.
- Jha, M. N., J. Levy, and Y. Gao. 2008. “Advances in Remote Sensing for Oil Spill Disaster Management: State-Of-The-Art Sensors Technology for Oil Spill Surveillance.” Sensors 8 (1): 236–255. doi:10.3390/s8010236.
- Karnieli, A., Y. J. Kaufman, L. Remer, and A. Wald. 2001. “AFRI — Aerosol Free Vegetation Index.” Remote Sensing of Environment 77: 10–21. doi:10.1016/S0034-4257(01)00190-0.
- Kaufman, Y. J., and D. Tanre. 1992. “Atmospherically Resistant Vegetation Index (ARVI) for EOS-MODIS.” IEEE Transactions on Geoscience and Remote Sensing 30 (2): 261–270. doi:10.1109/36.134076.
- Khanna, S., M. J. S. Susan, L. Ustin, A. Koltunov, R. F. Kokaly, and D. A. Roberts. 2013. “Detection of Salt Marsh Vegetation Stress and Recovery after the Deepwater Horizon Oil Spill in Barataria Bay, Gulf of Mexico Using AVIRIS Data.” PLoS One 8 (11): e78989. doi:10.1371/journal.pone.0078989.
- Konne, B. R. 2014. “Inadequate Monitoring and Enforcement in the Nigerian Oil Industry: The Case of Shell and Ogoniland.” Cornell Int’l LJ 47: 181.
- Lewis, R. R., 1983. “Impact of Oil Spills on Mangrove Forests.” In Biology and Ecology of Mangroves, edited by H. J. Teas, 8: 171–183. Dordrecht: Springer.
- Li, L., S. L. Ustin, and M. Lay. 2005. “Application of AVIRIS Data in Detection of Oil-Induced Vegetation Stress and Cover Change at Jornada, New Mexico.” Remote Sensing of Environment 94 (1): 1–16. doi:10.1016/j.rse.2004.08.010.
- Lin, Q., I. A. Mendelssohn, M. T. Suidan, K. Lee, and A. D. Venosa. 2002. “The Dose-Response Relationship between No. 2 Fuel Oil and the Growth of the Salt Marsh Grass, Spartina Alterniflora.” Marine Pollution Bulletin 44 (9): 897–902. doi:10.1016/S0025-326X(02)00118-2.
- Mishra, D. R., H. J. Cho, S. Ghosh, A. Fox, P. B. Christopher Downs, T. Merani, P. Kirui, N. Jackson, and S. Mishra. 2012. “Post-Spill State of the Marsh: Remote Estimation of the Ecological Impact of the Gulf of Mexico Oil Spill on Louisiana Salt Marshes.” Remote Sensing of Environment 118: 176–185. doi:10.1016/j.rse.2011.11.007.
- Mmom, P. C., and S. B. Arokoyu. 2010. “Mangrove Forest Depletion, Biodiversity Loss and Traditional Resources Management Practices in the Niger Delta, Nigeria.” Research Journal of Applied Sciences, Engineering and Technology 2 (1): 28–34.
- Noomen, M. F. 2007. Hyperspectral Reflectance of Vegetation Affected by Underground Hydrocarbon Gas Seepage. The Netherlands: Enschede, Wageningen University.
- Noomen, M. F., and A. K. Skidmore. 2008. “The Effects of High Soil CO2 Concentrations on Leaf Reflectance of Maize Plants.” International Journal of Remote Sensing 30 (2): 481–497. doi:10.1080/01431160802339431.
- Noomen, M. F., van der Werff, M. A. Herald, and F. D. van der Meer. 2012. “Spectral and Spatial 561 Indicators of Botanical Changes Caused by Log-Term Hydrocarbon Seepage.” Ecological 562 Informatics 5: 55–64. doi:10.1016/j.ecoinf.2012.01.001.
- Oliveira, W. J. D., A. P. Crosta, and J. L. M. Goncalves. 1997. “Spectral Characteristics of Soils and Vegetation Affected by Hydrocarbon Gas: A Greenhouse Simulation of the Remanso Do Fogo Seepage.” Paper presented at the Twelfth International and Workshops on Applied geologic remote Sensing, Denver, CO.
- Pezeshki, S. R., M. W. Hester, Q. Lin, and J. A. Nyman. 2000. “The Effects of Oil Spill and Clean-Up on Dominant US Gulf Coast Marsh Macrophytes: A Review.” Environmental Pollution 108 (2): 129–139. doi:10.1016/S0269-7491(99)00244-4.
- Rondeaux, G., M. Steven, and F. Baret. 1996. “Optimization of Soil-Adjusted Vegetation Indices.” Remote Sensing of Environment 55 (2): 95–107. doi:10.1016/0034-4257(95)00186-7.
- Rouse, J. W. Jr., R. H. Haas, J. A. Schell, and D. W. Deering. 1973. “Monitoring the Vernal Advancement and Retrogradation (Green Wave Effect) of Natural Vegetation.” Progress Reports RSC 1978-1 93. Texas A & M University
- Running, S. W., C. O. Justice, V. Salomonson, J. Barker, D. Hall, Y. J. Kaufmann, A. H. Strahler, et al. 1994. “Terrestrial Remote Sensing Science and Algorithms Planned for EOS/MODIS.” International Journal of Remote Sensing 15 (17): 3587–3620. doi:10.1080/01431169408954346.
- Schulze, E. D. 1986. “Carbon Dioxide and Water Vapor Exchange in Response to Drought in the Atmosphere and in the Soil.” Annual Review of Plant Physiology 37 (1): 247–274. doi:10.1146/annurev.pp.37.060186.001335.
- Schulze, E. D., E. Beck, and K. M. Hohenstein. 2005. “Environment as Stress Factor: Stress Physiology of Plants.” In Plant Ecology, 702. Berlin Heidelberg: Springer-Verlag.
- Simonich, S. L., and R. A. Hites. 1995. “Organic Pollutant Accumulation in Vegetation.” Environmental Science & Technology 29 (12): 2905–2914. doi:10.1021/es00012a004.
- Singh, A. 1989. “Review Article Digital Change Detection Techniques Using Remotely-Sensed Data.” International Journal of Remote Sensing 10 (6): 989–1003. doi:10.1080/01431168908903939.
- Slonecker, T., G. B. Fisher, D. P. Aiello, and B. Haack. 2010. “Visible and Infrared Remote Imaging of Hazardous Waste: A Review.” Remote Sensing 2 (11): 2474–2508. doi:10.3390/rs2112474.
- Sripada, R. P., R. W. Heinigerb, J. G. Whitec, and A. D. Meijer. 2005. “Aerial Colour Infrared Photography for Determining Early In-Season Nitrogen Requirements in Corn.” Agronomy Journal 98 (4): 968–977. doi:10.2134/agronj2005.0200.
- UNEP. 2011. “Environmental Assessment of Ogoniland.” UNEP Nairobi. Geneva, Switzerland: United Nations Environment Programme.
- Van Der Meer, F., M. Van Der Meijde, J. Kooistra, H. M. A. Van Der Werff, and M. F. Noomen. 2006. “Detection of Hazardous Gas Leakage from Pipelines Using Anomalous Spectral Reflectance Features of Vegetation.” In Global Developments in Environmental Earth Observation from Space: Proceedings of the 25th Symposium of the European Association of Remote Sensing Laboratories (Earsel), A. Marçal edited by. 6-11 June, 2005. Porto, Portugal: Rotterdam, Millpress.
- van der Meer, F., P. van Dijk, H. van der Werff, and H. Yang. 2002. “Remote Sensing and Petroleum Seepage: A Review and Case Study.” Terra Nova 14: 1–17. doi:10.1046/j.1365-3121.2002.00390.x.
- van der Meijde, M., H. M. A. van der Werff, P. F. Jansma, F. D. van der Meer, and G. J. Groothuis. 2009. “A Spectral-Geophysical Approach for Detecting Pipeline Leakage.” International Journal of Applied Earth Observation and Geoinformation 11 (1): 77–82. doi:10.1016/j.jag.2008.08.002.
- van der Werff, H., M. van der Meijde, F. Jansma, F. van der Meer, and G. J. Groothuis. 2008. “A Spatial-Spectral Approach for Visualization of Vegetation Stress Resulting from Pipeline Leakage.” Sensors 8 (6): 3733–3743. doi:10.3390/s8063733.
- van der Werff, H. M. A., M. F. Noomen, M. van der Meijde, and F. D. van der Meer. 2007. “Remote Sensing of Onshore Hydrocarbon Seepage: Problems and Solutions.” Geological Society, London, Special Publications 283 (1): 125–133. doi:10.1144/sp283.11.
- Yang, H., F. V. D. Meer, J. Zhang, and S. B. Kroonenberg. 2000. “Direct Detection of Onshore Hydrocarbon Microseepages by Remote Sensing Techniques.” Remote Sensing Reviews 18 (1): 1–18. doi:10.1080/02757250009532381.
- Yim, U. H., S. Y. Ha, J. G. An, J. H. Won, G. M. Han, S. H. Hong, M. Kim, J. H. Jung, and W. J. Shim. 2011. “Fingerprint and Weathering Characteristics of Stranded Oils after the Hebei Spirit Oil Spill.” Journal of Hazardous Materials 197: 60–69. doi:10.1016/j.jhazmat.2011.09.055.