
 ?Mathematical formulae have been encoded as MathML and are displayed in this HTML version using MathJax in order to improve their display. Uncheck the box to turn MathJax off. This feature requires Javascript. Click on a formula to zoom.
ABSTRACT
Fast and accurate object detection in aerial images remains a challenging task. Usually, to better describe an object, oriented bounding boxes (OBBs) can better fit objects. Due to high background complexity and large object scale variation, single-angle anchor-based two-stage detectors are widely adopted, which offer better accuracy. However, the single-angle prediction has a small error tolerance for objects with a large aspect ratio, and the hyperparameters of the anchor-based network are difficult to adjust, and the number of hyperparameters is extremely large. Furthermore, the two-stage detection inference speed is slow, and it is difficult to achieve real-time detection. In this paper, we propose Dual-Det, a keypoint-based oriented object detector. We firstly propose a dual-angle with a short-side and ratio regression strategy (DASR), which uses the object centre and the length and angles of two diagonals to represent an object. A short side guided (SSG) loss is further added to guide the direction of the diagonal regression box. To improve the detection performance for dense and tiny objects, a lightweight supervised pixel attention learner is finally proposed. The experiment results show that Dual-Det achieves 90.23 mAP at 46FPS on HRSC2016, 90.83
mAP at 46FPS on UCAS-AOD and 72.00
mAP at 0.018 s per image in the inference phase on DOTA. The code will be open source on https://github.com/gqy4166000/ijrs_dasr.
1. Introduction
With the development of remote sensing technology in recent years, the public remote sensing data are available for open access. However, most of these datasets are labelled similarly to natural image datasets, which use horizontal bounding boxes (HBBs) to depict objects (Wu et al. Citation2019; Wu et al. Citation2020). Due to the characteristics of the object distribution in remote sensing images, this kind of label method and regression method easily generates too large of an overlap between two adjacent objects. Because Non-Maximum Suppression (NMS) will suppress each object and lead to serious numbers of missed detections. Besides, HBBs will mix a large amount of background in the detection area, which is not conducive to the improvement of the detection quality. The labelling method of oriented bounding boxes (OBBs) can overcome these problems. OBBs introduce direction information to make labels closer to real objects. In the case of dense objects, it reduces the overlap between boxes. Therefore, oriented object detection is more necessary in the field of remote sensing object detection.
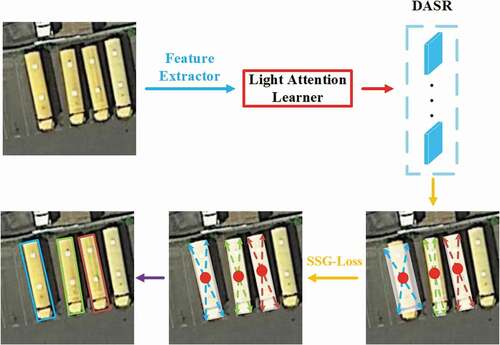
Figure 1. A pipeline of the proposed method has been shown here. A group of feature maps with the size of the input is obtained after the feature extractor, and the light attention learner is used to highlight the foreground and finally output five sets of heatmaps. This method is called DASR. The final result can be decoded after the SSG loss to correct the angle and diagonal length based on the short side of the object
For the choice of basic framework, most of the currently successful detectors are based on the RCNN framework(Cheng, Zhou, and Han Citation2016; Deng et al. Citation2017; Long et al. Citation2017). This framework use a region proposal network (RPN) to regress a large number of candidate regions based on anchors and then perform detailed classification and further regression correction of each region. However, due to the introduction of orientation information, the number of anchors required increases exponentially, so this kind of framework is undoubtedly cumbersome and inefficient. Therefore, the emerging anchor-free framework, which is comparable with RCNN framework in accuracy, is more suitable for remote sensing oriented object detection. For the choice of how to accurately locate the target direction, part of the work regards the problem as a key point regression problem. They locate objects by directly predicting the coordinates of endpoints, such as (,
,
,
) or (
,
,
)(Jiang et al. Citation2017), where
. To be specific, there are two solutions adopting this method. One is to use a fully connected structurethe to output the coordinates of each region proposal in the two-stage network (Liao et al. Citation2018; Xia et al. Citation2018; Yang et al. Citation2019a). The advantage is that a region corresponds to a set of coordinates. However, how to arrange and combine the coordinates is not considered. The calculated loss will fluctuate greatly, despite the target is the same. The other solution is applied to the point-based network(Zhou, Zhuo, and Philipp Citation2019). It predicts all endpoints by outputting a binary heatmap and combining the endpoints belonging to the same object through a certain logic. But different objects have different difficulties in predicting the endpoints, it is difficult to find the appropriate logic. Thus, the
-based method is proposed. This method constructs oriented bounding boxes by adding angle parameter
(Ding et al. Citation2019; Liu et al. Citation2017; Ma et al. Citation2018), and its form is (
,
,
,
,
); However, the predicted angle is very unstable due to the periodicity. Another part of the work is inspired by the segmentation field and uses binary segmentation maps to locate targets. However, due to the large number of dense small objects in remote sensing images, determining the boundaries between objects is still a challenging problem.
In this paper, we propose a fast and efficient point-based oriented object detector called Dual-Det. To be more specific, we introduce a dual-angle with short-side and ratio regression strategy (DASR), which can represented oriented objects using (,
,
,
,
,
) instead of using (
,
,
,
,
). This strategy improves the performance of the regression with rare time costs, especially objects such as harbours, vehicles, etc., which have a large aspect ratio. Besides, we design a short-side guided loss (SSG) to further guide the regression direction of the diagonal regression boxes. Finally, a light attention learner is designed to reduce the false detection of small and dense objects. We evaluate and test the performance of Dual-Det on three public datasets, (Xia et al. Citation2018), HRSC2016 (Liu et al. Citation2016b) and UCAS-AOD (Zhu et al. Citation2015), and compare its performance with those of the state-of-the-art detectors. Dual-Det achieves excellent detection performance under the premise of rapid detection. In summary, our contribution has three points:
• We present a novel oriented objects representation strategy called DASR. This strategy improve the performance of the regression with rare time cost, especially objects with large aspect ratios.
• We propose a novel loss (SSG loss) to guide the DASR. The loss deepens the coupling between the two angles and the diagonal length during the iteration through the short-side, and fixes some extreme cases of DASR.
• We propose a lights attention learner to improve the performance on small and dense objects with rare time cost, and achieve competitive results with a fast speed.
2. Related work
2.1. Overview
The emergence of deep learning technology makes the application field of remote sensing image develop rapidly. For instances, Hong et al. (Citation2021b) proposes a general multimodal deep learning framework to provide a baseline solution for pixel-level RS image classification tasks using multimodal data. miniGCN(Hong et al. Citation2021a) greatly reduces the computational complexity of traditional graph convolutional network through ingenious design, and proposes the trainable minibatch strategy to jointly use graph convolutional networks and convolutional neural networks. And in the object detection field, the emergence of R-CNNs(Girshick et al. Citation2014; Girshick Citation2015; Lin et al. Citation2017a; Dai et al. Citation2016) has greatly improved the overall object detection accuracy. Compared with deep learning technology, the method (such as HOG(Dalal and Triggs Citation2005)) of manually selecting features and then classifying them by using classifiers is clumsy and inaccurate. At present, most object (Ding et al. Citation2019; Azimi et al. Citation2019; Wu et al. Citation2019; Yang et al. Citation2018, Citation2018a; Liu and Mattyus Citation2015) in the remote sensing field is also based on the R-CNN framework, especially the representative Faster-RCNN (Ren et al. Citation2017) detector.
2.2. Anchor-based oriented object detectors
Some early oriented object detectors draw on the idea of Faster-RCNN, change the regression method of the second step, and obtain rotation information based on the HRPs (Jiang et al. Citation2017). However, this strategy may result in a large amount of background being included, that is, a misalignment problem is generated. Many works(Liu et al. Citation2017; Ma et al. Citation2018) try to solve this problem by predicting the rotation region proposals, and letting the two stages learn the direction information at the same time. Rotation region proposal networks(Ma et al. Citation2018) and other methods have achieved promising detection results by using a Rotation Region-of-Interest pooling layer which is based on rotated anchors, but this method also causes a dramatic increase in the number of anchors. With an input size of 1024 1024, the total number of anchors will exceed 1 million, which greatly increases the calculation parameters and hyperparameter selection complexity. The RoI-Transformer(Ding et al. Citation2019) avoids the problem of the explosion in the number of anchors by adding the RRoI learner module on the basis of HRPs. SCRDet (Yang et al. Citation2019b) uses a multi-dimensional attention network to suppress the noise impact. However, these two-stage networks based on the RCNN framework all have high computational complexity, especially in remote sensing datasets, where the computational costs are much higher than that of natural images. Among the images obtained by cropping the DOTA dataset with a subsize of 1024
1024, the number of objects in a single picture may reach 1,000
2,000. Therefore, thousands of RoIs will be input into the second stage to ensure that missed detection does not occur. TextBoxes++(Liao, Shi, and Bai Citation2018) based on the SSD(Liu et al. Citation2016a) network improvement directly regresses the 8 vertices of an oriented bounding box. The RRD (Liao et al., Citation2018) further improves the performance of SSD by using oriented response networks to extract rotation-sensitive text features and then adding maximum pooling to the classification branch to extract features that are not sensitive to classification. However, the accuracy of the one-stage detector is generally inferior to that of the two-stage network.
2.3. Anchor-free oriented object detectors
The early exploration of anchor-free networks is YOLO(Redmon et al. Citation2016). However, in addition to YOLOv1, both YOLOv2 (Redmon and Farhadi Citation2017) and v3 (Redmon and Farhadi Citation2018) use anchor to improve accuracy. FCOS(Tian et al. Citation2019) propose a one-stage full convolution detector with anchor-free and proposal-free, which can be comparable to the two-stage detector in the accuracy. Inspired by the algorithm, Both AF-RPN(Zhong, Sun, and Huo Citation2019) and APE (Zhou, Wu, and Du Citation2019) utilize anchor-free RPN networks, which use shrunk segmentation labels instead of anchors. Among these methods, APE has achieved top-level detection results on the ODAI dataset, but due to the use of the Cascade-RCNN(Cai and Vasconcelos Citation2018) structure, it still needs a large time cost.
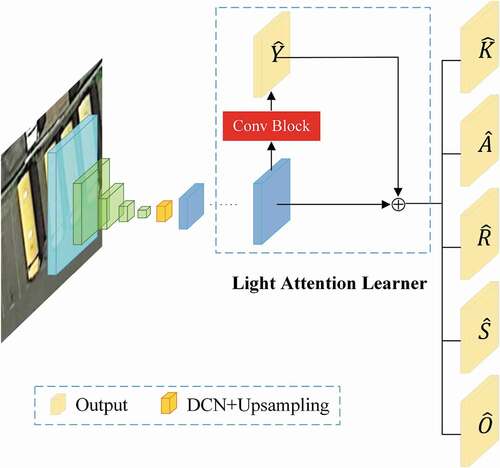
Figure 2. The network architecture of Dual-Det. A deformable convolution(DCN) is applied between downsampling and upsampling, which is shown as the Orange feature map in the figure. The light yellow heatmap is the output involved in the loss calculation. Conv Block is a small convolution module with detailed structure in .Section 3.4
2.4. Keypoint-based oriented object detectors
The emergence of CornerNet(Law and Deng Citation2018) opens the door for detecting objects based on key points. CornerNet uses corner pooling to detect a diagonal point outside an object to represent an object, but this difficult to apply in oriented object detection. ExtremeNet(Zhou, Zhuo, and Philipp Citation2019) can detect irregular objects by detecting the four extreme points, but computational load is even much larger than that of the normal two-stage network. CenterNet (Zhou, Wang, and Philipp Citation2019) with high real-time performance simultaneously treats an object as a centre point and directly regresses the length and width. -DET (Wei et al. Citation2019) treats the rotating target as pairs of middle lines and predicts the intersection point. This paper considers the above aspects and proposes a novel method for oriented object detection in aerial images.
3. Proposed method
3.1. Overview
We first present the proposed keypoint-based method framework as shown in . Unlike traditional object detection tasks, we use the location of the centre point to determine the distribution of objects. For a input image, we predict the heatmap
to predict the centre point, where
is the number of object categories, and
is the downsampling factor. For the centre point
of each object, the position corresponding to the output heatmap is
, and the discretization error can be computed as
. Heatmap
is used to compensate for the discretization error caused by downsampling, and the factor
, which is the same that in as CenterNet. The label setting and prediction method of the centre point followed those of CenterNet. The difference is that we use heatmap
to predict the angles of two diagonal lines. Heatmap
is responsible for predicting the length of the short side, and heatmap
regresses the ratio of the short side and diagonal lines. The detector outputs a total of
heatmaps. The architecture is shown in . We choose ResNet18 (He et al. Citation2016) as the backbone and use the deformable convolution (DCN) (Dai et al. Citation2017) to improve the elasticity of the receptive field of the shallow network.
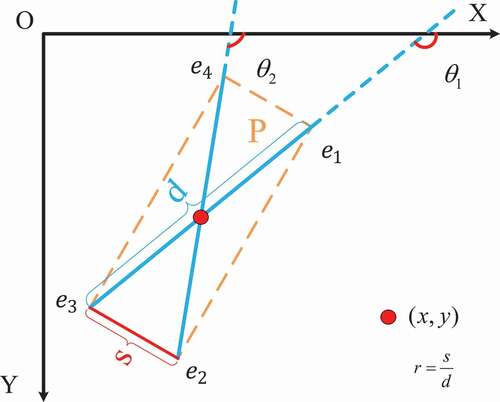
Figure 3. Illustration of the proposed regression strategy for an oriented object. We utilize to represent the box
3.2. DASR regression strategy
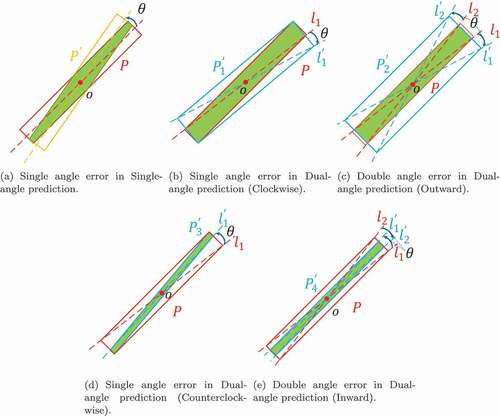
Our proposed method relies on two diagonal angles of the oriented object, as shown in . We find that when using a single-angle prediction to describe the direction, especially an object with a large aspect ratio such as a bridge or harbour, if the prediction of the other parameters is completely accurate, a small error in the angle still greatly reduces the Intersection over Union (IoU) between the prediction box and ground truth box as shown in . The use of a dual-angle prediction can be divided into four cases as shown in
(e), where the red rectangle
is the ground truth and the blue rectangle
is the prediction box.
and
are the diagonals of
and
, respectively. Case (b):
deviates from
clockwise by
degrees, and the other angle is accurate. Case (c):
deviates from
clockwise by
degrees, and
deviates from
counterclockwise by
degrees. Case (d):
deviates from
counterclockwise by
degrees, and the other angle is accurate. Case (e):
deviates from the angle of
counterclockwise by
degrees, and
deviates from the angle of
clockwise by
degrees. If
deviates from the angle of
counterclockwise by
degrees, and
deviates from
counterclockwise by
degrees, it is the same as figure (a); therefore, it is not listed separately. In Cases of (b) and (c), there can still be a great intersection (green area) between
and
which is higher than that of Case (a); and Cases (d) and (e) are even worse than that of (a). However, because of the prediction of the double angles to represent, the angle losses of Case (c) and Case (e) will be double the calculation losses, which can be easily corrected during the iteration. To solve Case (d), we propose the SSG loss to compensate in Section 3.3.
Figure 4. Comparison of the errors between dual-angle prediction and single-angle prediction. The red box is the ground truth,
is the error box and the green area is the intersection of the two boxes. See Section 3.2 for details
An intuitive illustration of the proposed representation is depicted in . For a given oriented object (orange dotted yellow rectangle), the angles between the two diagonal lines (blue rays) and the X coordinate axis are
and
, respectively. The coordinates
are the centre of the object, and the solid red line is the short side of the target. We use
to represent the target
, where
is defined as follows:
where is the short side length of the object and
is the diagonal length. Let
respectively be the right, bottom, left and top endpoints of box
. We can decode the coordinates of the four vertices through the above variables as follows:
3.3. SSG loss
In order to fix Case (d) and further improve the stability of the regression, we designed the SSG loss based on rectangular geometry. We found that in edge regression process, the accuracy of the short side is higher than that of the long side. We verify our supposition on the validation set of the DOTA(Xia et al. Citation2018) dataset. We use CenterNet (Zhou, Wang, and Philipp Citation2019), which is extended for oriented object detection with a single-angle output as the baseline; that is, the object is represented by . Let
, and regress the object based on
and
, respectively. where
and
. The experimental results are shown in . The prediction result based on the short side method is much higher than that based on the long edge, especially for the harbour and bridge categories, and it is also higher than the baseline. We think that the receptive field of each point on heatmap can more easily to completely cover the short edge of object, especially for the bridge and harbour categories.
Table 1. Different results for short-side-based, long-side-based and the baseline
According to the geometric relationship of the prediction box in , we find that the angle between the two diagonal lines and,
and the length of the diagonal lines should meet the following conditions:
where . If
and
are all accurate,
should be infinitely close to
. Therefore, we designed the loss based on the short side to guide the process as follows:
According to EquationEq 1(1)
(1) and EquationEq 4
(4)
(4) , the common constant
is eliminated, and EquationEq 5
(5)
(5) is simplified as:
Figure 5. The detailed structure of light attention learning module
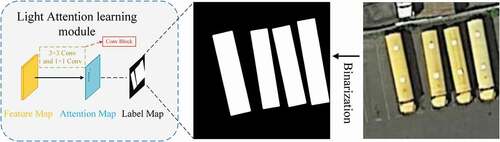
3.4. Light attention learner
In order to further improve the accuracy on small and dense objects, we propose a light attention learning module as shown in , and the detailed structure of light attention learning module has been shown in , which is a kind of supervised module. We obtain the Attention Map from the Feature Map of the last layer of the backbone network through a simple convolution structure called Conv Block (mentioned in ), where the structure consists of a 3
3 convolution, a ReLU activation function, and another 1
1 convolution. The label of the module is a 0–1 binary image (Label Map in ) generated by the truth value. Among them, the pixel value in the object truth box area of all categories is set to 1 (the white area in ), and the non-object area is set to 0 (the black area in the ). Since Gaussian kernel is not used to generate labels, there are only two categories of 0 and 1 in the Label Map, so Focal Loss(Lin et al. Citation2017b) is used as the loss function:
Finally, the Attention Map predicted by this module will be element-wise addition with the input feature map before the output head ( in ) to reinforce the features within the area containing the object. All positions on the Attention Map are involved in the loss calculation. The light attention learner has a simple structure and only contributes very little time cost to the inference.
3.5. Loss function
In Section 3.1, our proposed method has outputs, and each set of the outputs corresponds to a loss. The loss for centre-point heatmap
and offset heatmap
follow CenterNet
where is the corresponding prediction at the coordinate
of any position on the
heatmap,
and
are the hyperparameters of the focal loss(Lin et al. Citation2017b) and their values do not change, and
is the number of objects in the input images. We use an L1 loss at the angles of two diagonal lines and the short side, which is similar to EquationEq 9
(9)
(9) :
where and
are the ground truth of the angle and short side, respectively. The ratio loss
is the cross-entropy between
and ground truth
. The overall training objective is
We set the hyperparameters and
in all of our experiments to simply the balancing of each part.
4. Experiments
4.1. Datasets
For the experiments, we choose three datasets, DOTA, HRSC2016 and UCAS-AOD, for the oriented object detection in aerial images.
• DOTA. DOTA is a challenging and large remote sensing dataset for both horizontal and oriented objects. DOTA V1.0 contains 15 categories and 2806 images while V1.5 adds one category and adds numerous labels for small objects. The image size in this dataset is large, and the number of instances in a single image is very high. As with other works, we use the offical tools provided by the DOTA to crop the original image in the experiment, and verify the results on the server that is provided by DOTA. In our work, only oriented labels are used. We use both the training and validation sets for training and the testing set for testing. We crop a series of patches from the original images with a stride of 824. For those categories with a small number of samples, we do not perform any augmentation to avoid the effect of an imbalance between different categories. Finally, compared with the RoI Transformer (37,373 patches) and the official baseline implements (150,342 patches), we only use 19,219 patches. The short names for each category are as follows: baseball diamond (BD), ground track field (GTF), small vehicle (SV), large vehicle (LV), tennis court (TC), basketball court (BC), storage tank (ST), soccer-ball field (SBF), roundabout (RA), swimming pool (SP), and helicopter (HC). The FR-O and RoI Transformers are both official detectors provided by DOTA.
• HRSC2016. HRSC2016 is also an oriented object detection dataset of aerial images, but it is much smaller than DOTA. It contains remote sensing images of various ships, and the size of the images is below . Therefore, we directly resize all the images of the training and validation sets to (
) for training without any other tricks. We use the train-val data for training and testing on the test data set, as in other works ding2018learning.
• UCAS-AOD. The UCAS-AOD is a dataset widely used in oriented object detection in aerial images. It contains 2 categories and 1510 aerial images. There are 1000 plane images containing 7482 objects and 510 car images containing 7114 objects. In our experiments, we choose the oriented labels as research data and randomly select 1110 images for training and 400 images for testing, as in (Ding et al. Citation2019).
4.2. Implementation details
All the experiments are implemented using PyTorch 1.0 and 4 16GB NVIDIA Tesla V100 GPUs. To increase the detection speed as much as possible, we adopt ResNet-18 as the backbone in all the experiments and compare its results with the results of other detectors based on ResNet-101 or more complex backbones. The network is trained by the Adam (Kingma and Jimmy Citation2014) optimizer, and the learning rate is set to
at the beginning of training with a batch size of 64. The learning rate is decreased by
at epochs the 200 and 300, respectively. Random rotation (from
to
), scaling (from 0.5 to 1.5), and colour augmentation are used as data augmentation methods in all training processes. The specific parameters of the test phase will be described in detail in the relevant sections.
4.3. Ablation studies
To further illustrate the effectiveness of each part of our proposed work, we conduct a series of experiments on the DOTA validation dataset. We use CenterNet, which is extended for oriented object detection, as the baseline. The training parameters and settings are described in Section 4.2 and Section 4.1, respectively, and the modules are gradually added in the experiments. All the results are shown in , and our proposed method improved the mAP by a total of . We discuss the details in the following.
Table 2. Ablation studies of each component
4.3.1. DASR Strategy
The DASR regression strategy provides a very significant improvement since it outperforms the baseline by 2.61. Furthermore, the performance of some single categories, especially the
,
, and
categories, have very conspicuous improvements, which are 6.48
, 7.39
, and 10
, respectively. The details results of each category as shown in . For some categories with smaller aspect ratios, such as
,
-
, and
, our approach has barely improved; For some extremely large objects, such as
-
and
-
-
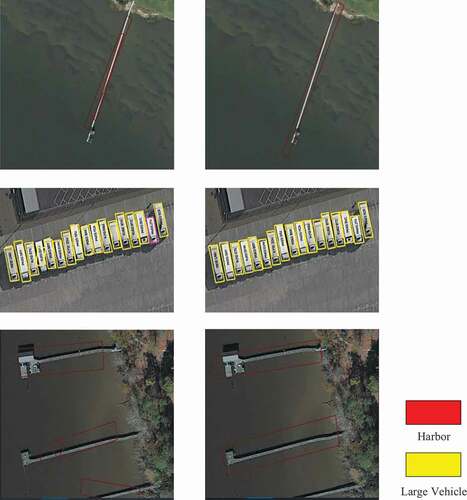
, the accuracy of DASR strategy decreases. We believe that the reason is that it is relatively difficult to predict the direction of the object with large body size, which makes the prediction of angle unstable and more likely to appear as shown in . After SSG loss and light attention learner are used, the detection accuracy of these categories rises to a certain extent, which further verifies the effectiveness of the proposed method. An intuitive result is shown in . Single-angle prediction often occurs when inaccurate angle prediction causes an object with a large length and width ratio to deviate greatly from the ground truth, as shown in (left). DASR prediction stabilizes the unstable prediction box and is closer to the ground truth box as shown in (right).
Table 3. Ablation studies of each component (the details of each category are given in ). LAL is the acronym for the
Figure 6. Comparison of using the DASR (right) and baseline (left) in the harbour and large vehicle categories
4.3.2. Short-side guided loss
The purpose of the SSG loss is to guide the network to avoid
mentioned in . We apply different settings in the experiments on the SSG loss, as shown in . Our SSG loss is a self-supervised loss, so we try to replace the parameters in the loss with the truth value. Where
refers to replacing
in the EquationEq 4
(4)
(4) ;
refers to replacing
in the EquationEq 5
(5)
(5) ;
refers to the original loss of not making parameter substitution. It can be seen that the participation of labels in the loss calculation will decrease the mAP. The reason is that excessively strong restrictions will lead the network to forcibly maintain the geometric characteristics between parameters, making DASR invalid. Therefore, we just use it to fine-tune the network. We add the SSG loss after 200 epochs training based on DASR and continue training to 300 epochs. shows a
improvement in the mAP.
Table 4. Comparison of different settings for the SSG loss
4.3.3. Light attention learner
A light attention learner is a simple structure used to further improve the accuracy of small or dense object detections. The total mAP increases by 1.25, as shown in , and the main improvement comes from
(6.17
),
(7.69
),
(4.56
) categories. We also compared the performance improvement of the addition and multiplication operations between the attention mask and the feature map the baseline, which improved by 1.25
and 0.48
, respectively. The multiplication operation greatly suppresses the background information, which significantly improves small object detections, but there is a certain drop for large and middle object detections.
4.3.4. Complexity analysis
We conduct complexity analysis experiments for each part of the study on DOTA dataset (). You can see that the individual parts have little impact on the memory and speed of the network. During the training phase, DASR and light attention learner with additional branches put a major burden on training speed and memory. SSG Loss does not add additional parameters in the structure, so it does not affect the memory occupation, but the loss of extra calculation makes the training speed slightly slower. In terms of the test speed, each part has no significant influence on the final speed, and the gap is in the microsecond level. Therefore, errors such as data loading and data post-processing will also have a great impact on the test speed.
Table 5. Comparison of the speed and memory of each component
4.4. Comparisons with State-of-the-art
We compared the performance of Dual-Det with those of state-of-the-art algorithms on three datasets: DOTA(Xia et al. Citation2018), HRSC2016 (Liu et al. Citation2016b) and UCAS- AOD (Zhu et al. Citation2015).
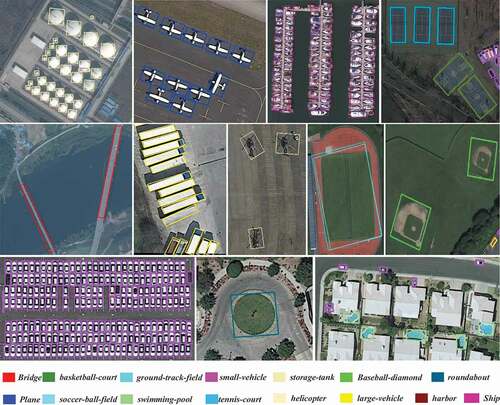
Figure 7. Visualization of detection results from Dual-Det in DOTA
4.4.1. Results on DOTA
As seen in , we compare the performance of our method with those of state-of-the-art detectors, which include both one-stage and two-stage algorithms. Compared to one-stage and two-stage methods, our detector has better performance in seven categories including ,
,
,
,
,
and
and worse performance in the six categories of
,
,
,
,
and
. However, compared to the performaces of one-stage detectors, our method achieves the best performances on the
,
,
and
categories. For the large-scale object categories (
,
,
, and
), the one-stage detector has obvious disadvantages compared to the two-stage networks. Although our method does not overcome those shortcomings, it still has competitive performance compared to the performances of one-stage detectors. For the
category, we observe that the recall in those categories is higher, but the accuracy is lower. We think that the reason is that the shallow network is not conducive to the classification of confusing categories. In single-scale testing, Dual-Det can reach 72.00
mAP in 0.018s (per image) in the inference phase, which is much faster than other one-stage and two-stage algorithms, and it is even 4 times faster than the fastest algorithm. In addition, the accuracy is also ahead of most of the others without the FPN structure in which only the output of the last feature map is used. DualDet-FT is the result of our flip test. During the test, we concatenate the image with horizontal flips and the original image as the input and take the average value of
,
, and
of the prediction result as the final prediction value. The other outputs keep the original image prediction value unchanged. We finally achieved 73.62
mAP in 0.026s (per image) in the inference phase, which is only a 44.4
decrease in the detection speed, but a 1.62
increase in the mAP. The Visualization results for each category on the DOTA dataset were shown in .
Table 6. Comparison with state-of-the-art detectors on DOTA
4.4.2. Results on HRSC2016
We compare the accuracy and speed of our method with those of other state-of-the-art detectors on the HRSC2016 test set in , Resdcn18 is the architecture that uses ResNet18 as the backbone. In the experiments, no other tricks are used except that the upper limit of the centre point is set as . The results show that although our method uses a low-complexity backbone, it still achieves the best detection performance based on the VOC07 AP metric, which is 0.97
mAP higher than
Det(Yang et al. Citation2019a) (the input size is 1024
1024). For fairness, we also reduce the input size to 800
800, and the results show that this change reduces the mAP by only a small amount and the methods still outperforms other detectors. Besides, we also calculated mAP based on the VOC12 AP metric like CenterMap-Net (Wang et al. Citation2021). It can be seen that no matter what the input size is, the performance of our low-complexity network is better than the other methods. In terms of detection speed, the low-complexity backbone gives our network a great advantage in speed, which is also proved by the results. Therefore, in many occasions requiring real-time performance, our method also has great practicability.
Table 7. Comparisons of the accuracy and speed with the state-of-the-art methods on HRSC2016. * means that the VOC12 AP metric is used
4.4.3. Results on UCAS-AOD
As seen in , we compare the performance of our method with the performance of other state-of-the-art detectors. We set the upper limit of the centre point as , and other settings are the same as for HRSC2016. We used the VOC07 and 12 AP metric to calculate mAP. The results show that our detector achieve competitive performance on this dataset on both metric. Besides, with this dataset, the inference speed can also reach 46FPS.
Table 8. Comparison with the state-of-the-art detectors on UCAS-AOD (Zhu et al. Citation2015). * means that the VOC12 AP metric is used
5. Conclusion
In this paper, we propose a one-stage object detection framework, Dual-Det, which is a real-time keypoint-based detector for oriented objects in aerial images. The DASR redesigns the regression method based on the prediction of the dual-angle and short side of a box. Furthermore, the SSG loss guides the DASR to more accurate results. Additionally, the attention learner strategy helps to locate small and dense objects. All these methods achieve considerable performance improvements. Our network runs at 46FPS with 90.23 mAP on the HRSC2016 dataset and at 46FPS (Frames Per Second) with 90.83
mAP on the UCAS-AOD dataset. We also achieve the relatively good speed-accuracy trade-off on the DOTA dataset with 72.00
mAP in 0.018 s (per image) and 73.62
mAP in 0.026 s (per image) in inference phase. Due to the low complexity of the backbone, Dual-Det has a fast detection speed, but its accuracy is still excellent. Experiments on three datasets show that the proposed method can achieve the state-of-the-art performance. Besides, we also would like to welcome other researchers optimize Dual-Det performance with a more complex backbone in the future.
6. List of acronyms
Disclosure statement
No potential conflict of interest was reported by the author(s).
References
- Azimi, S. M., E. Vig, R. Bahmanyar, M. Körner, and P. Reinartz. 2019. “Towards Multi-class Object Detection in Unconstrained Remote Sensing Imagery.” In Computer Vision – ACCV 2018, edited by C. V. Jawahar, L. Hongdong, G. Mori, and K. Schindler, 150–165. Cham: Springer International Publishing.
- Cai, Z., and N. Vasconcelos. 2018. “Cascade R-CNN: Delving Into High Quality Object Detection.” In 2018 IEEE/CVF Conference on Computer Vision and Pattern Recognition, Salt Lake City, UT, USA, 6154–6162.
- Cheng, G., P. Zhou, and J. Han. 2016. “Learning Rotation-invariant Convolutional Neural Networks for Object Detection in VHR Optical Remote Sensing Images.” IEEE Transactions on Geoscience and Remote Sensing 54 (12): 7405–7415. doi:https://doi.org/10.1109/TGRS.2016.2601622.
- Dai, J., Q. Haozhi, Y. Xiong, L. Yi, G. Zhang, H. Han, and Y. Wei. 2017. “Deformable Convolutional Networks.” In 2017 IEEE International Conference on Computer Vision (ICCV), Venice, Italy, 764–773.
- Dai, J., L. Yi, H. Kaiming, and J. Sun. 2016. “R-fcn: Object Detection via Region-based Fully Convolutional Networks.” In Advances in Neural Information Processing Systems, 379–387.
- Dalal, N., and B. Triggs. 2005. “Histograms of Oriented Gradients for Human Detection.” In 2005 IEEE Computer Society Conference on Computer Vision and Pattern Recognition (CVPR’05), Vol. 1, San Diego, CA, USA, 886–893
- Deng, Z., H. Sun, S. Zhou, J. Zhao, and H. Zou. 2017. “Toward Fast and Accurate Vehicle Detection in Aerial Images Using Coupled Region-based Convolutional Neural Networks.” IEEE Journal of Selected Topics in Applied Earth Observations and Remote Sensing 10 (8): 3652–3664. doi:https://doi.org/10.1109/JSTARS.2017.2694890.
- Ding, J., N. Xue, Y. Long, G.-S. Xia, and L. Qikai 2019. “Learning RoI Transformer for Oriented Object Detection in Aerial Images.” In 2019 IEEE/CVF Conference on Computer Vision and Pattern Recognition (CVPR), Long Beach, CA, USA, 2844–2853.
- Farhadi, A., and J. Redmon. 2018. “Yolov3: An Incremental Improvement.” In Computer Vision and Pattern Recognition, 1804–02767. Germany: Springer Berlin/ Heidelberg.
- Girshick, R. 2015. “Fast R-CNN.” In 2015 IEEE International Conference on Computer Vision (ICCV), Santiago, Chile, 1440–1448.
- Girshick, R., J. Donahue, T. Darrell, and J. Malik. 2014. “Rich Feature Hierarchies for Accurate Object Detection and Semantic Segmentation.” In 2014 IEEE Conference on Computer Vision and Pattern Recognition, Columbus, OH, USA, 580–587.
- He, K., X. Zhang, S. Ren, and J. Sun. 2016. “Deep Residual Learning for Image Recognition.” In 2016 IEEE Conference on Computer Vision and Pattern Recognition (CVPR), Las Vegas, NV, USA, 770–778.
- Hong, D., L. Gao, J. Yao, B. Zhang, A. Plaza, and J. Chanussot. 2021a. “Graph Convolutional Networks for Hyperspectral Image Classification.” IEEE Transactions on Geoscience and Remote Sensing 59 (7): 5966–5978. doi:https://doi.org/10.1109/TGRS.2020.3015157.
- Hong, D., L. Gao, N. Yokoya, J. Yao, J. Chanussot, Q. Du, and B. Zhang. 2021b. “More Diverse Means Better: Multimodal Deep Learning Meets Remote-Sensing Imagery Classification.” IEEE Transactions on Geoscience and Remote Sensing 59 (5): 4340–4354. doi:https://doi.org/10.1109/TGRS.2020.3016820.
- Jiang, Y., X. Zhu, X. Wang, S. Yang, L. Wei, H. Wang, F. Pei, and Z. Luo. 2017. “R2cnn: Rotational Region Cnn for Orientation Robust Scene Text Detection.” In arXiv Preprint arXiv:1706.09579.
- Kingma, D. P., and B. Jimmy. 2014. “Adam: A Method for Stochastic Optimization.” In arXiv Preprint arXiv:1412.6980.
- Law, H., and J. Deng. 2018. “CornerNet: Detecting Objects as Paired Keypoints.” In Computer Vision – ECCV 2018, edited by V. Ferrari, M. Hebert, C. Sminchisescu, and Y. Weiss, 765–781. Cham: Springer International Publishing.
- Liao, M., B. Shi, and X. Bai. 2018. “Textboxes++: A Single-shot Oriented Scene Text Detector.” IEEE Transactions on Image Processing 27 (8): 3676–3690. doi:https://doi.org/10.1109/TIP.2018.2825107.
- Liao, M., Z. Zhu, B. Shi, G.-S. Xia, and X. Bai. 2018. “Rotation-Sensitive Regression for Oriented Scene Text Detection.” In 2018 IEEE/CVF Conference on Computer Vision and Pattern Recognition, Salt Lake City, UT, USA, 5909–5918.
- Lin, T.-Y., P. Dollár, R. Girshick, H. Kaiming, B. Hariharan, and S. Belongie. 2017a. “Feature Pyramid Networks for Object Detection.” In 2017 IEEE Conference on Computer Vision and Pattern Recognition (CVPR), Honolulu, HI, USA, 936–944.
- Lin, T.-Y., P. Goyal, R. Girshick, H. Kaiming, and D. Piotr. 2017b. “Focal Loss for Dense Object Detection.” In 2017 IEEE International Conference on Computer Vision (ICCV), Venice, Italy, 2999–3007.
- Liu, K., and G. Mattyus. 2015. “Fast Multiclass Vehicle Detection on Aerial Images.” IEEE Geoscience and Remote Sensing Letters 12 (9): 1938–1942. doi:https://doi.org/10.1109/LGRS.2015.2439517.
- Liu, W., D. Anguelov, D. Erhan, C. Szegedy, S. Reed, F. Cheng-Yang, and A. C. Berg. 2016a. “SSD: Single Shot MultiBox Detector.” In Computer Vision – ECCV 2016, edited by B. Leibe, J. Matas, N. Sebe, and M. Welling, 21–37. Cham: Springer International Publishing.
- Liu, Z., H. Jingao, L. Weng, and Y. Yang. 2017. “Rotated Region Based CNN for Ship Detection.” In 2017 IEEE International Conference on Image Processing (ICIP), Beijing, China, 900–904.
- Liu, Z., H. Wang, L. Weng, and Y. Yang. 2016b. “Ship Rotated Bounding Box Space for Ship Extraction from High-resolution Optical Satellite Images with Complex Backgrounds.” IEEE Geoscience and Remote Sensing Letters 13 (8): 1074–1078. doi:https://doi.org/10.1109/LGRS.2016.2565705.
- Long, Y., Y. Gong, Z. Xiao, and Q. Liu. 2017. “Accurate Object Localization in Remote Sensing Images Based on Convolutional Neural Networks.” IEEE Transactions on Geoscience and Remote Sensing 55 (5): 2486–2498. doi:https://doi.org/10.1109/TGRS.2016.2645610.
- Ma, J., W. Shao, H. Ye, L. Wang, H. Wang, Y. Zheng, and X. Xue. 2018. “Arbitrary-oriented Scene Text Detection via Rotation Proposals.” IEEE Transactions on Multimedia 20 (11): 3111–3122. doi:https://doi.org/10.1109/TMM.2018.2818020.
- Redmon, J., S. Divvala, R. Girshick, and A. Farhadi. 2016. “You Only Look Once: Unified, Real-Time Object Detection.” In 2016 IEEE Conference on Computer Vision and Pattern Recognition (CVPR), Las Vegas, NV, USA, 779–788.
- Redmon, J., and A. Farhadi. 2017. “YOLO9000: Better, Faster, Stronger.” In 2017 IEEE Conference on Computer Vision and Pattern Recognition (CVPR), Honolulu, HI, USA, 6517–6525.
- Ren, S., H. Kaiming, R. Girshick, and J. Sun. 2017. “Faster R-CNN: Towards Real-Time Object Detection with Region Proposal Networks.” IEEE Transactions on Pattern Analysis and Machine Intelligence 39 (6): 1137–1149.
- Tian, Z., C. Shen, H. Chen, and H. Tong 2019. “FCOS: Fully Convolutional One-Stage Object Detection.” In 2019 IEEE/CVF International Conference on Computer Vision (ICCV), Seoul, Korea (South), 9626–9635.
- Wang, J., W. Yang, L. Heng-Chao, H. Zhang, and G.-S. Xia. 2021. “Learning Center Probability Map for Detecting Objects in Aerial Images.” IEEE Transactions on Geoscience and Remote Sensing 59 (5): 4307–4323. doi:https://doi.org/10.1109/TGRS.2020.3010051.
- Wei, H., Y. Zhang, Z. Chang, L. Hao, H. Wang, and X. Sun. 2020. “Oriented Objects as Pairs of Middle Lines.” ISPRS Journal of Photogrammetry and Remote Sensing 169: 268–279. doi:https://doi.org/10.1016/j.isprsjprs.2020.09.022.
- Wu, X., D. Hong, J. Chanussot, Y. Xu, R. Tao, and Y. Wang. 2020. “Fourier-Based Rotation-Invariant Feature Boosting: An Efficient Framework for Geospatial Object Detection.” IEEE Geoscience and Remote Sensing Letters 17 (2): 302–306. doi:https://doi.org/10.1109/LGRS.2019.2919755.
- Wu, X., D. Hong, J. Tian, J. Chanussot, L. Wei, and R. Tao. 2019a. “Orsim Detector: A Novel Object Detection Framework in Optical Remote Sensing Imagery Using Spatial-Frequency Channel Features.” IEEE Transactions on Geoscience and Remote Sensing 57 (7): 5146–5158.
- Wu, X., D. Hong, J. Tian, J. Chanussot, L. Wei, and R. Tao. 2019b. “Orsim Detector: A Novel Object Detection Framework in Optical Remote Sensing Imagery Using Spatial-frequency Channel Features.” IEEE Transactions on Geoscience and Remote Sensing 57 (7): 5146–5158.
- Xia, G.-S., X. Bai, J. Ding, Z. Zhu, S. Belongie, J. Luo, M. Datcu, M. Pelillo, and L. Zhang. 2018. “DOTA: A Large-Scale Dataset for Object Detection in Aerial Images.” In 2018 IEEE/CVF Conference on Computer Vision and Pattern Recognition, Salt Lake City, UT, USA, 3974–3983.
- Yang, X., F. Kun, H. Sun, J. Yang, Z. Guo, M. Yan, T. Zhan, and S. Xian. 2018a. “R2CNN++: Multi-dimensional Attention Based Rotation Invariant Detector with Robust Anchor Strategy.” arXiv Preprint arXiv:1811.07126 2: 7.
- Yang, X., Q. Liu, J. Yan, and L. Ang. 2019a. “R3DET: Refined Single-stage Detector with Feature Refinement for Rotating Object.” In arXiv Preprint arXiv:1908.05612.
- Yang, X., H. Sun, K. Fu, J. Yang, X. Sun, M. Yan, and Z. Guo. 2018b. “Automatic Ship Detection in Remote Sensing Images from Google Earth of Complex Scenes Based on Multiscale Rotation Dense Feature Pyramid Networks.” Remote Sensing 10 (1): 132. doi:https://doi.org/10.3390/rs10010132.
- Yang, X., J. Yang, J. Yan, Y. Zhang, T. Zhang, Z. Guo, X. Sun, and F. Kun 2019b. “SCRDet: Towards More Robust Detection for Small, Cluttered and Rotated Objects.” In 2019 IEEE/CVF International Conference on Computer Vision (ICCV), Seoul, Korea (South), 8231–8240.
- Zhang, Z., W. Guo, S. Zhu, and W. Yu. 2018. “Toward Arbitrary-oriented Ship Detection with Rotated Region Proposal and Discrimination Networks.” IEEE Geoscience and Remote Sensing Letters 15 (11): 1745–1749. doi:https://doi.org/10.1109/LGRS.2018.2856921.
- Zhong, Z., L. Sun, and Q. Huo. 2019. “An Anchor-free Region Proposal Network for Faster R-CNN-based Text Detection Approaches.” International Journal on Document Analysis and Recognition (IJDAR) 22 (3): 315–327. doi:https://doi.org/10.1007/s10032-019-00335-y.
- Zhou, X., D. Wang, and K. Philipp. 2019. “Objects as Points.” In arXiv Preprint arXiv:1904.07850.
- Zhou, X., J. Zhuo, and K. Philipp. 2019. “Bottom-Up Object Detection by Grouping Extreme and Center Points.” In 2019 IEEE/CVF Conference on Computer Vision and Pattern Recognition (CVPR), Long Beach, CA, USA, 850–859.
- Zhu, H., X. Chen, W. Dai, F. Kun, Y. Qixiang, and J. Jiao. 2015. “Orientation Robust Object Detection in Aerial Images Using Deep Convolutional Neural Network.” In 2015 IEEE International Conference on Image Processing (ICIP), Quebec City, QC, Canada, 3735–3739.
- Zhu, Y., J. Du, and W. Xueqing. 2020. “Adaptive Period Embedding for Representing Oriented Objects in Aerial Images.” IEEE Transactions on Geoscience and Remote Sensing 58 (10): 7247–7257. doi:https://doi.org/10.1109/TGRS.2020.2981203.