
 ?Mathematical formulae have been encoded as MathML and are displayed in this HTML version using MathJax in order to improve their display. Uncheck the box to turn MathJax off. This feature requires Javascript. Click on a formula to zoom.
ABSTRACT
Human-elephant conflict (HEC) is a significant conservation issue for Asian elephants (Elephas maximus) and an environmental and socioeconomic crisis in elephant range countries, including Sri Lanka. Approximately 14,897 HEC incidents were recorded in Sri Lanka between 2015 and 2021. In this study, we present a Sri Lanka-wide analysis to explore the impact of greenery change on HEC. Our sources were official government data, and land use and land cover maps developed using Sentinel-2 satellite imagery. We applied the support vector machine (SVM), random forest (RF), and object-based image analysis classifications to classify land cover into six categories. This classification scheme also considered the differences observed in Sri Lanka’s woody vegetation, consisting of forest, open forest, paddy fields, homestead gardens, and other crops. Analysis of the accuracies of the three types of classifiers confirmed that the supervised classification with two machine learning algorithms, RF and SVM, delivered a higher level of precision in land cover classification. RF was the best option, with a 97.34% overall accuracy and a 0.94 kappa coefficient, while SVM recorded a 94.68% overall accuracy and a 0.89 kappa coefficient. According to the findings, most HEC incidences were recorded in open forests (54%), while 62% were recorded within 2 km of the forest edge. Results indicated that HEC coincides with the human-occupied changed landscape adjacent to forest reservations and patches. The findings could be valuable for HEC management by identifying areas where elephants are most likely to conflict with humans, and the government may declare these as protected areas. Also, we propose an early warning system as an effective approach that helps detect and monitor elephant herds’ movement. Therefore, implementing long-term land use planning is crucial for protecting the forest and natural habitats, restoring elephant habitats, and mitigating HEC by minimizing human encroachment and promoting sustainable land use practices.
1. Introduction
1.1. Human elephant conflict and land cover and land use changes in Sri Lanka
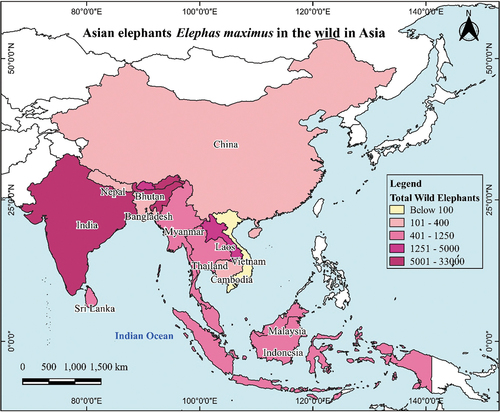
Human-elephant conflict (HEC) is an interaction between humans and elephants in which one species harms the other (Nguyen, Phan, and Chun-Hung Citation2022). HEC has been defined as ‘any disagreements or contentions related to destruction, loss of life or property, and interference with the rights of individuals or groups that are directly or indirectly related to elephants’ (KenyaWildlifeService Citation1994). It is also a significant conservation issue for Asian elephants (Elephas maximus). Also, it is considered one of the critical environmental and socioeconomic crises (Cabral de Mel et al. Citation2022) in 13 Asian countries: Bangladesh, Bhutan, Cambodia, China, India, Indonesia, Laos, Malaysia, Myanmar, Nepal, Sri Lanka, Thailand and Vietnam () (Fernando and Pastorini Citation2011).
Figure 1. Map of elephant-ranging countries in Asia showing the total numbers of wild elephants: Coordinate reference system (CRS); (WGS 84/UTM zone 44N) (Sukumar Citation2006).
This conflict arises due to the expanding overlap of human settlements and agricultural activities with the natural habitats of elephants, leading to conflicts and negative interactions between humans and elephants (Gunawansa et al. Citation2023). The phrase highlights the significant concern posed by HEC, emphasizing its importance in the context of Asian elephant conservation efforts. The Sri Lankan elephant (Elephas maximus maximus) has been listed as an endangered species by the International Union for the Conservation of Nature (IUCN Citation2020), which emphasizes the urgent need for conservation efforts to protect the remaining population and its habitat (Williams et al. Citation2008).
Inadequately managing elephant migrations and movements can lead to their encroachment into human settlements (Hossain et al. Citation2023), resulting in insecurity and restriction of freedom of movement due to the potential safety risks. Competition between humans and elephants for space and water has caused deaths and injuries and destroyed crops and infrastructure (Entekhabi et al. Citation2012). Furthermore, climate changes, deforestation, land degradation, increasing socioeconomic demands, and a growing population impose stress on land use (Yeshey et al. Citation2023), resulting in elephant attacks on humans (Zhang and Wang Citation2003). Land cover and land use (LCLU) changes are noted as one of the most significant environmental issues worldwide (Zarandian et al. Citation2023). Therefore, over the past decade, HEC has become a critical environmental issue in elephant-inhabiting countries, including Sri Lanka, with the intentional killing of elephants in retaliation for human actions such as habitat destruction and ivory poaching (Rathnayake et al. Citation2022).
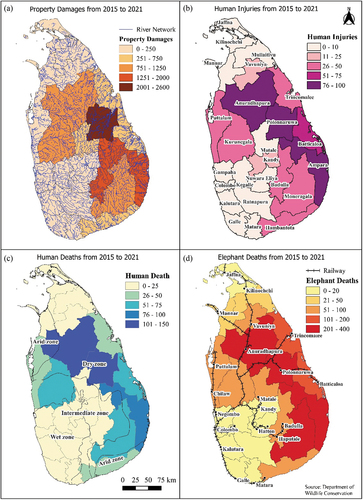
The conflict between elephants and humans has been a concern throughout history. The rural population in Sri Lanka has increased significantly from 8.25 million in 1960 to 17.98 million in 2021 (WorldBank Citation2023). Potential causes and contexts of HEC in Sri Lanka include the change in land cover due to changes in land use with respect to the expansion of human territories, the growth of rural populations, and the loss of elephant habitats for elephants (Anuradha et al. Citation2019). These contributing factors are primarily responsible for the worsening situation. Most current HEC mitigation tools lack the flexibility to accommodate the ecological needs of elephants and are ineffective in reducing HEC in the long term (Cabral de Mel et al. Citation2022). The maps in visualize the HEC in Sri Lanka from 2015 to 2021.
Figure 2. Distribution of four types of HEC incidents in Sri Lankan districts (a) property damage (2015–2021); (b) human injuries (2015 – 2021); (c) human deaths (2015–2021); (d) elephant deaths (2015–2021). Source: Department of Wildlife Conservation.
The distribution of government hospitals, HEC zones, and road networks in Sri Lanka has been strategically planned to ensure accessible healthcare services and efficient transportation throughout the country. Government hospitals are strategically located in different regions, including urban centres and rural areas, to address the healthcare requirements of the population effectively. illustrates the locations of hospitals in Sri Lanka and the existing road network.
Figure 3. Distribution of the government hospitals, HEC zone and road network of Sri Lanka (MOH Citation2023).
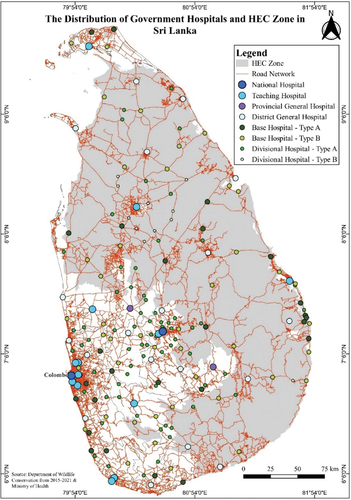
Transporting a patient to a hospital after an elephant attack can be particularly challenging for several reasons. First, many of these attacks occur in remote areas, making access to transportation difficult. Additionally, the potential danger posed by elephants in the area can delay transport and put the safety of patients and medical personnel at risk. Moreover, it can be more challenging to access transportation at night, further delaying the patient’s access to medical care. If the patient is seriously injured, the situation can become even more critical, as the nearest hospital may be too far to transport the patient in time.
The overall HEC level in the country during 2015–2021 in relation to administrative districts was most recorded in the dry zone, with the highest number in Polonnaruwa district with 3,105 incidents (). Climate zones have been overlaid to understand the regional distribution of each type of HEC. Much of the habitat area of elephants also coincides with areas of infrastructure such as road and rail networks. Elephant habitat also coincides with many rice-cultivated areas, irrigation tanks, forests, and reservoirs in Sri Lanka (Rathnayake et al. Citation2022).
Figure 4. Number of human and elephant deaths in districts, Udawalawe Elephant Transit Home (UETH), Horowpothana Elephant Holding Ground (HEHG), and Other Divisional Secretariat Divisions (ODSD) during the last seven years. Source: Department of Wildlife Conservation.
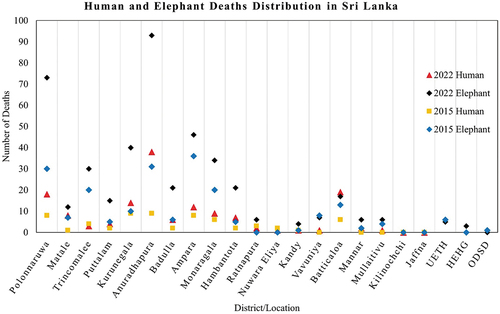
According to HEC data from the Department of Wildlife Conservation (DWC) of Sri Lanka, 14897 HEC incidents have been recorded in the last seven years. A total of 2,173 elephants and 708 humans lost their lives during this period. Remarkably, human deaths have doubled since 2015. Since 2003, 11405 incidents of property damage have been recorded due to HEC, and human injuries are more frequent, with 610 confirmed incidents. Property damage, which represents more than 72% of all HEC reports, has increased by more than 128% since 2015.
Considering the 2015 to 2022 period, there is some data fluctuation, but overall, the trend is increasing. In 2021, improvised explosive devices (Hakkapattas) were responsible for 69 elephant deaths; 64 were killed by electrocution, 45 were shot, six died in train accidents, and four were poisoned with toxic chemicals. Furthermore, in 2020, 69 elephants lost their lives due to these explosive devices, 66 were electrocuted, 46 were shot, three died in a train accident, and two were poisoned, highlighting the need to implement more effective measures to prevent such tragic incidents.
Elephants require a large area to meet their intake of about 150 kg of plant matter per day (Samansiri and Weerakoon Citation2007) and reproductive requirements. Changes in and around forest areas, both natural and artificial, directly impact elephant habitats (Anuradha et al. Citation2019). Behaviours will change with the greenness of the land cover as it alters in wet and dry conditions. As a result, an accurate forest map is vitally needed to track or estimate elephant populations. The size of an elephant’s home range varies depending on the availability and nature of the habitat (Marshal et al. Citation2010). Therefore, to identify HEC hotspots, an accurate forest map must be integrated with a GIS database.
Large-scale forest cover losses in Sri Lanka have increased in recent decades due to the breakdown of sustainable agriculture (Perera and Tsuchiya Citation2009; Perera et al. Citation2012; Ranagalage et al. Citation2020). When the British Empire took control in 1843, about 90% of Sri Lanka was covered by forests (Lindström Citation2011). From 2010 to 2019, the forest loss rate was dramatically high, which can be associated with the rapid infrastructure development of the country (Ranagalage et al. Citation2020; Sudhakar Reddy et al. Citation2016). In 2010, the World Food and Health Organization ranked Sri Lanka as the country with the fourth highest rate of deforestation (Jayasundara Citation2023; Perera Citation2021).
Due to rapid forest degradation, humans and elephants frequently come into contact with each other, with losses for both species. Crop fields and settlements have been particularly vulnerable hotspots where frequent HECs occurred. The situation will become more complicated in the near future because Sri Lankan elephants have a very limited area due to the country being an island.
1.2. Research objectives
HEC is one of the critical environmental issues in Sri Lanka; its relationship with LCLU change has not been established due to the lack of updated detailed forest cover changes in Sri Lanka. Therefore, creating an HEC hotspot map is essential to mitigate HEC in Sri Lanka. In this study, we aim to develop a satellite data fusion approach with GIS modelling to produce an accurate LCLU map to identify HEC risk zones in Sri Lanka.
2. Materials and methods
2.1. Study area
Through a detailed investigation of existing HEC records, the largest forest region in southeast Sri Lanka and its surrounding area was selected as the study area. This area of approximately 5,836 km2 () encompasses 14 divisional secretary’s divisions (DSDs, also known as divisional secretariats; these constitute the country’s third administrative level) across four administrative districts: Badulla, Hambantota, Monaragala, and Rathnapura.
Figure 5. Location of the study area: (a) District map of Sri Lanka; (b) Divisional secretary’s divisions of the study area; (c) Sentinel-2 image mosaic of the study area. Coordinate reference system (CRS) (WGS 84/UTM zone 44N).
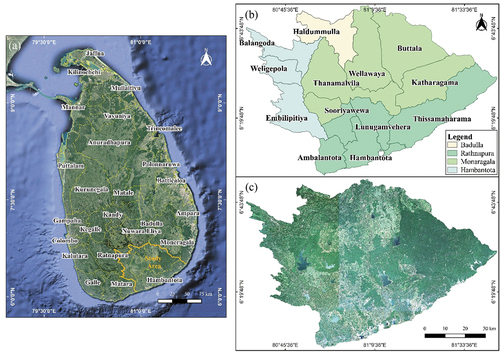
These areas mainly account for national parks, agricultural lands, forests, and villages with perennial vegetation. The study area includes four large national parks: Udawalawe, Lunugamvehera, Bundala, Ussangoda, and Yala. Udawalawa is a popular spot for viewing elephants, and Yala National Park covers a large part of the selected area. In addition, the study area includes Wirawila Tissa, Madunagala Sanctuary, and Ridiyagama Safari Park. The majority of the study area falls into dry and arid zones, which both experience a significant dry period from May to September. The northeast monsoon rains appear in most parts of Sri Lanka, including the dry zone, from December to February.
2.2. Sentinel-2 satellite data
The Sentinel-2 satellite system was developed by an industrial consortium led by Astrium GmbH (Germany). Astrium SAS (Marshal et al.) is responsible for the MultiSpectral Instrument (MSI). The MSI works passively by collecting sunlight reflected from the Earth. Sentinel-2 products by the European Space Agency (ESA) and the European Union, as part of the Copernicus Program, have contributed to effectively monitoring the Earth’s surface (ESA Citation2023a). The primary goal is to offer high-resolution satellite data for various applications such as land monitoring, emergency management, security, climate change analysis, and marine studies. LCLU data encompass a range of categories, including residential areas, roads, forests, and agricultural areas (ESA Citation2015). The free and open access policy to Copernicus Sentinel data provides users with a large volume of consistent and complete data (Mitraka et al. Citation2020).
The Copernicus Open Access Hub (previously known as Sentinels Scientific Data Hub) provides complete, free, and open access to Sentinel-1, Sentinel-2, Sentinel-3, and Sentinel-5P user products. Sentinel data products are made available systematically and freely to all data users, including the general public and scientific and commercial users, through https://scihub.copernicus.eu/.
Sentinel-2 satellite data have the potential to improve forest classification at medium to large scales due to their high spatial resolution. Sentinel-2 has 13 spectral bands, three spatial resolution levels of 10 m, 20 m, and 60 m (ESA Citation2014), a 290 km swath, and a radiometric resolution of 12 bits. The Sentinel-2 satellite revisit frequency is 10 days, and the combined constellation revisits frequency is 5 days (ESA Citation2023b).
The Sentinel-2 mission is made up of twin polar-orbiting satellites (Sentinel-2A and Sentinel-2B) in the same orbit, phased at 180° to each other (ESA Citation2015). For the bottom-of-atmosphere data (Level 2A) (Pádua et al. Citation2022) products that have been used in this study, the atmospheric correction has already been applied (ESA Citation2023c). Sentinel-2 product data are relatively high resolution, using the data processing software SNAP developed by the ESA. summarizes the characteristics of the Sentinel-2 satellite data used in this study.
Table 1. The characteristics of the Sentinel-2 data used in this study.
2.3. HEC data acquisition
HEC incidents data were obtained for seven years (2015–2022) from DWC Sri Lanka. DWC is the custodian of reported HEC incidents in Sri Lanka (Department of Wildlife Conservation Citation2023). The HEC data are reported under four main categories: human deaths, elephant deaths, human injuries, and property damage. These incidents have been documented with location information, wildlife region, DSD, district, and the incident’s date (or year). Elephant deaths and property damage reporting depend entirely on the community alerting the DWC headquarters or the nearest regional wildlife office if any incident has occurred. Human deaths and injuries are more accurately documented because they are confirmed through a police investigation or medical records.
2.4. Satellite data classification schemes and classification systems
Remote sensing technology has been widely used to extract land cover/use information efficiently, as it can repeatedly obtain data for a large area (Hossain and Chen Citation2019). Remote sensing classification is a complex process that requires the consideration of factors such as spatial resolution, classification algorithms, and training data. The main steps of image classification are the determination of a suitable classification system, the selection of training samples, image pre-processing, feature extraction, the selection of appropriate classification approaches, and accuracy assessment (Lu and Weng Citation2007).
Today, machine learning (Aburas et al.) algorithms have been widely chosen to classify satellite images for mapping the Earth’s surface (Avci et al. Citation2021). A suitable classification system and sufficient training samples are prerequisites for successful classification. This study used RF, SVM, and OBIA classification systems and six classification schemes.
2.4.1. Classification schemes and reference data collection
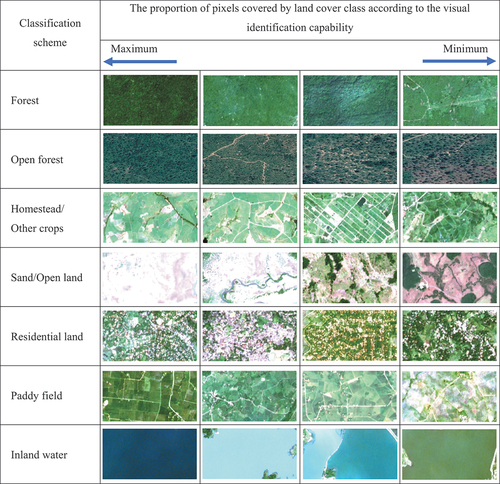
The dominant land cover types of the study area have been characterized and classified by the proposed classification schemes. The classification scheme was based on the study’s primary objective, which is to identify the forest and the open forest. The land cover classification scheme developed for the study is summarized in .
Table 2. LCLU use category and definitions.
shows examples for each LCLU category class, representing the wide range of variations in the foremost classes. As explained below, existing land cover maps were used for the spatial stratification of reference pixels and benchmarking the performance of the proposed mapping process.
Figure 6. Examples of the target LCLU classes showing the ranges of classification scheme distribution. These are ordered by LCLU proportion cover of a pixel. From left to right: maximum to minimum cover to still be assigned to the class.
Spatial stratification refers to the process of dividing a study area into smaller, more homogeneous units based on certain characteristics. Reference pixels are within the study area for which the land cover type is known with a high degree of accuracy. These pixels are typically selected based on ground truth data. Reference pixels are used to train the classification algorithm and to assess the accuracy of the resulting land cover map.
Benchmarking the performance of the proposed mapping process involves comparing the resulting land cover map to existing land cover maps and assessing its accuracy. This can be done using metrics such as overall accuracy, kappa coefficient, and user’s and producer’s accuracy. Benchmarking helps to identify areas of the map that may require further refinement. It aids in ensuring that the resulting map is reliable and accurate.
Land cover classification requires representative, precise, and robust reference data. In this classification, ground truth data were collected through the information gathered from field observations and reference to Google Earth high-resolution data to implement a protocol to ensure the high quality of the reference data.
2.4.2. Support vector machine
An SVM is a nonparametric image classification algorithm that consists of a collection of related regression and classification learning algorithms (Saini and Ghosh Citation2018; Yousefi et al. Citation2022). SVMs are supervised learning algorithms based on statistical learning theory heuristic algorithms (Srivastava et al. Citation2012). The SVM often provides more robust classification results from highly variable spectral information than the most popular supervised classification methods (Cervantes et al. Citation2020). The SVM may achieve high classification accuracy using a small training sample set (Foody and Mathur Citation2004; Zheng et al. Citation2015). The SVM consists of four kernel types. Linear, radial basis function, sigmoid, and polynomial kernels are commonly used to classify remote sensing data (Chabalala, Adam, and Ali Citation2022).
An SVM, a popular and accurate technique for satellite image classification, is widely used in remote sensing (Mountrakis, Im, and Ogole Citation2011; Yousefi et al. Citation2022). Therefore, determining the optimal values of the penalty parameter in the SVM method is essential. This is done by considering the different land cover types and the corresponding surface land reflectance in arid and humid regions (Thanh Noi and Kappas Citation2018).
We performed supervised classifications using the SVM algorithm in the open-source Orfeo Toolbox (OTB) software through https://www.orfeo-toolbox.org/otb-release-8-1-0/ (De Luca et al. Citation2019). The algorithms implemented in OTB were applied in this work through QGIS software. The OTB version used was 8.1.0 and interfaced with QGIS 3.22. With the SVM, we used a linear kernel type with a model type based on a C value equal to one. For the classifications, 50% of the field samples were used as training data and 50% for validation.
2.4.3. Random forest
RF is an ensemble classifier that comprises a large number of decision trees created by randomly chosen predictors from randomly selected data that are a subset of the training dataset, and the final classification/prediction decision is made based on a majority vote (Adugna, Xu, and Fan Citation2022; Belgiu and Drăguţ Citation2016). The Random Forest Classifier (RFC) is an ensemble machine learning algorithm used successfully in land cover classification in remote sensing (Adugna, Xu, and Fan Citation2022; Marissiaux and Defourny Citation2018). The RFC produces multiple decision trees using a randomly selected subset of training samples and variables (Belgiu and Drăguţ Citation2016). Due to its higher classification accuracy, this classifier has gained popularity in the remote sensing community (Jin et al. Citation2018).
For this study, Sentinel-2 imagery was processed using ESA SNAP version 9.0.0 software developed by ESA https://step.esa.int/main/download/snap-download/. Sentinel-2 imagery-corrected 10 m spectral bands were used in this classification. The identification of land covers was carried out by referring to Google Earth Pro. For the RF model, defining two important adjustable parameters was necessary. The first denotes the number of predictors tested at each decision tree node split (mtry), and the second illustrates the number of decision trees runs at each iteration (ntree) (Chabalala, Adam, and Ali Citation2022; Tatsumi et al. Citation2015). In this study, the RF model was optimized, and the model accuracy was maximized using these two primary parameters, set as mtry 3200 and ntree 50.
2.4.4. Object-based image analysis
OBIA is defined as a subdiscipline of GIS devoted to partitioning remote sensing imagery into meaningful image objects and assessing their characteristics through spatial, spectral, and temporal scales (Hay and Castilla Citation2006). The key steps in OBIA are segmentation and classification (Blaschke Citation2010). Segmentation is a method of partitioning an image into a set of separate regions that are intended to correspond to meaningful landscape units of varying sizes based on spectral and geographic features (Nasir et al. Citation2022) such as colour, texture, shape, size, and grey value (Kazemi Garajeh et al. Citation2022). The quality of the segmentation stage directly affects the results of the OBIA approach for remote sensing image analysis (Hossain and Chen Citation2019).
In this study, the OBIA classification of the Sentinel-2 image was performed using the Orfeo Toolbox 8.1.0 plugin and QGIS 3.22. The ‘Mean-Shift’ segmentation algorithm in the OTB plugin was used to segment the image and convert pixels with similar characteristics into a polygon (Zaki et al. Citation2022). Extensive trial-and-error experiments were conducted to determine the optimal image segmentation parameters, which took around one and a half hours. The optimal parameter settings used for the OTB plugin are 15 for spatial radius, five for range radius, and one for minimum segment size. Training samples were used for land cover classification and testing samples were used for land cover map evaluation. Based on the average spectral value of pixels in each polygon from the image segmentation, the training samples were then used to classify each land cover imagery using a linear SVM kernel type.
2.5. Accuracy assessment
To determine the best outcome of the mapping process, accuracy assessment is a fundamental step in remote sensing image processing. This is used to quantify the error and uncertainty that might be involved (Rwanga and Ndambuki Citation2017). The accuracy assessment results verify the image classification quality (Nasir et al. Citation2022). First, a confusion matrix (an error matrix) is usually used as the quantitative method to calculate image classification accuracy. This allows us to assess the overall accuracy, as well as the accuracy of the producer and the user. In one recent study, this approach was applied to evaluate the accuracy to determine the validity of classification algorithms (De Luca et al.). For the present study, a measure of validation of each classified map was provided by constructing a confusion matrix between the training areas and the maps. Then, the accuracy assessment process estimated overall accuracy (OA), Kappa coefficient (KC), user accuracy (UA), and product accuracy (PA) using Equations one to four, presented below, based on the confusion matrix. shows the categorization of the Kappa coefficient (Rwanga and Ndambuki Citation2017).
Table 3. Rating criteria for Kappa coefficient.
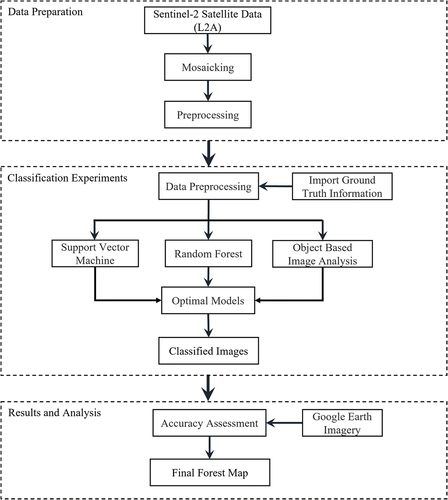
A manual process was used to complete an accuracy assessment and construct a confusion matrix for performance evaluation. For this evaluation, 186 ground truth data pixels were randomly selected. Google Earth imagery offers a clear view of LCLU features with details and can be utilized for field verifications when in situ field observation is not practically possible. This study used Google Earth imagery as the primary ground truth data collection source. shows the flow chart of the methodology applied in this study.
Figure 7. The schematic framework of the methodology applied in the present study.
3. Results
Once the Sentinel-2 image was classified using the SVM, RF, and OBIA methods, the accuracy assessment for these maps was conducted. The classifiers were executed using the optimum parameter values to determine the best model for each classification method. Then a confusion matrix was computed to evaluate the overall accuracy and Kappa coefficient. This section presents the current study’s findings, which utilized Sentinel-2 processed data to prepare land cover maps featuring six distinct LCLU categories.
3.1. Support vector machine
illustrates the classification of the results obtained from SVM. Forest and tree species are mainly distributed in the east and northwest of the study area. Most broadleaf tree species are found in natural forests, representing 44.8%.
Figure 8. Map of the land cover classification using SVM classification. The Sentinel-2 image was taken on 22nd January 2022.
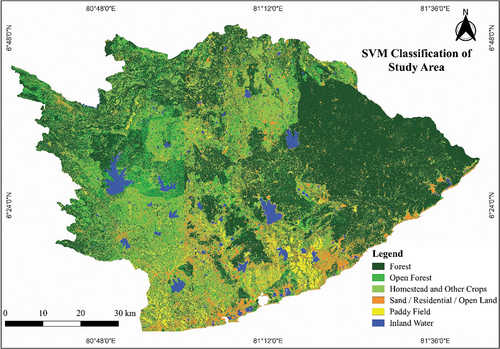
It has been observed that the high-density forest (forest) class achieved more accuracy than the low-density forest (open forest). The open forest and homestead, and other crop pixels are as misclassified as each other, resulting in low accuracy. All classification schemes generally have good accuracies, ranging from 79% to 100% ().
Table 4. The confusion matrix for SVM classification includes the user’s (UA) and producer’s (PA) accuracies.
3.2. Random forest
illustrates the utilization of RF for the generation of LCLU map. In the RF classification, almost all classes have more than 95% PA, except for homestead and other crops (). Generally, each classification scheme’s accuracy shows that RF can classify well.
Figure 9. Map of the land cover classification using the RF classification.
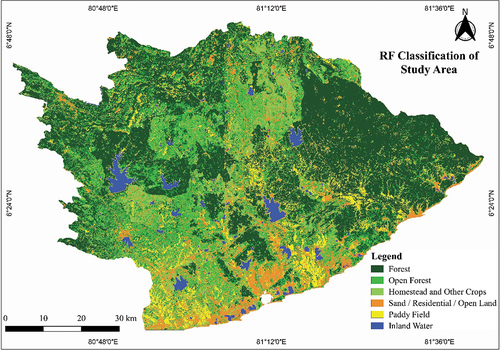
Table 5. Confusion matrix for RF classification and including user’s and producer’s accuracies.
3.3. Object-based image analysis
OBIA was used to create the land cover map (). Some paddy fields have been misclassified as inland water, homestead, and other crops. According to , the UA values for the open forest, paddy field, homestead and other crops were less than 60%.
Figure 10. Map of land cover classification using the OBIA classification.
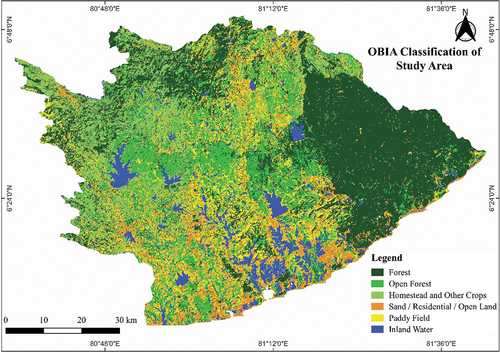
Table 6. Confusion matrix for OBIA classification, including user’s and producer’s accuracies.
As summarized in , the SVM and RF methods achieved significantly higher land cover classification accuracy. However, when comparing the Kappa coefficient, the SVM and RF method’s performances are almost perfect. According to this study, the RF technique generated the highest performance, and the OBIA technique performed moderately compared to the other two methods.
Table 7. Overall accuracy and Kappa coefficient of the SVM, RF, and OBIA classification.
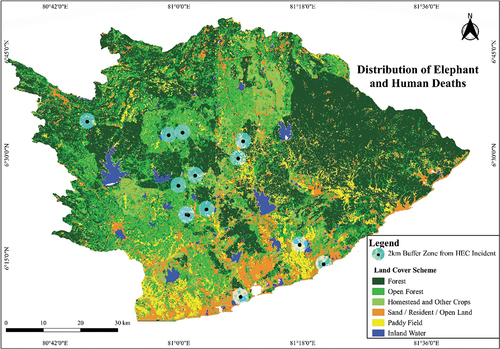
3.4. Influence of land cover changes on HEC
The study revealed that areas near forests, paddy fields, homesteads, and other crops are hotspots for HEC incidents. This finding confirms elephants’ preference for productive vegetation. The highest accuracy outcome for the 2022 land cover map produced using RFC supports this conclusion. This analysis was carried out by examining human and elephant records in 2021. We found that most HEC incidents (54%) were recorded in the open forest area, while 62% were recorded within a 2 km buffer zone of forest boundaries (). In the study area, the distance from inland water sources had a less significant relationship (with 38% of incidents close to the inland water sources) with the occurrence of HEC.
Figure 11. The distribution of elephant and human deaths in the study area with a 2km buffer for HEC incidents in 2021. This 2022 land cover map was produced using RF classification.
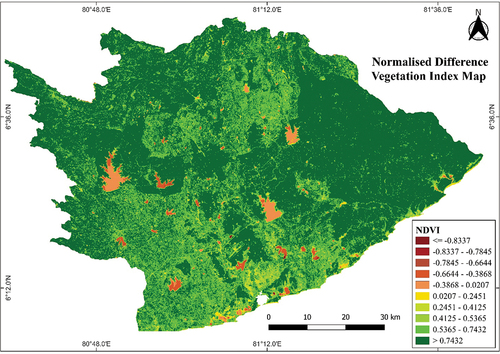
3.5. Assessment of forest cover based on vegetation indices
Vegetation indices calculated from satellite images are straightforward and efficient methods for quantitative and qualitative assessments of vegetation cover, vitality, and growth dynamics (Omia et al. Citation2023; Pesaresi et al. Citation2020). Normalised difference vegetation index (NDVI) is one of the widely used indices to detect multitemporal vegetation greenery (Aburas et al. Citation2015), and NDVI results are presented in . In Sentinel data, the red band corresponds to the B4 band, and the near-infrared (NIR) band corresponds to the B8 band. The calculated NDVI values ranged from 0.938 to −0.992 in January 2022, with the higher values indicating forest, low positive values characterizing sparse vegetation, and negative values representing water. In this study, NDVI was used to validate the forest area classified by RFC.
Figure 12. NDVI results of the study area.
4. Discussion
Due to changing socio-ecological and environmental pressures, Sri Lanka’s rapid land cover change has created an altered interface for human-wildlife interactions. Understanding these shifts is crucial to mitigate repeated negative interactions escalating conflict between people and elephants. Large herbivores such as elephants require extensive home ranges for food and, thus, a large area of suitable habitat to meet their survival and reproduction needs. Data from the World Food and Health Organization has ranked Sri Lanka as the country with the fourth highest rate of deforestation. Likely, Sri Lanka’s higher elephant density of around 0.1 elephants/km2 compared to the 0.01 elephants/km2 in India is due to its smaller size and significant elephant population. Sri Lanka and India have different elephant densities due to the contrasting land sizes of the two countries. Sri Lanka, a relatively small island nation compared to India, has a concentrated elephant population within a smaller land area. With a smaller land area, Sri Lanka’s elephant population is concentrated in a smaller space, leading to a higher density of elephants per unit area.
When the food quantity for elephants in the reserve habitat does not match the elephant population’s expansion rate, this causes problems. To solve this problem, elephants must move outward to find new habitats and gradually go towards farm villages outside the reserve to feed, which leads to the potential risk of HEC. Simultaneously, multiple development goals, such as agriculture and transportation, affect elephant habitats overlapping with human activities. Expanding cash crop cultivation areas and highway construction projects contribute to this impact. Consequently, the migration and communication of elephant populations are disrupted. In other words, human activities continue to encroach on the living spaces of elephants in different ways. Sri Lanka had approximately 5,787 elephants in 2011, and the range has been shrinking in the dry zone in recent decades. Furthermore, elephants are not able to find an additional area to feed due to the country being an island.
Annual HEC incidents have increased in line with the changes in LCLU patterns in rural Sri Lanka. Furthermore, the occurrence of HEC in the study area was closely linked to higher average NDVI values, suggesting the link between the greenery of the vegetation and HEC incidents. About 54% of HEC incidents were recorded in open forests, while 62% were recorded within 2 km of the forest boundary. According to DWC reports, 51% of elephant deaths occurred in Sri Lanka in 2021 due to explosives, electrocution, gunfire, train accidents, and toxic chemicals. Therefore, identifying the HEC risk zone hotspot map is essential to reduce HEC in Sri Lanka.
The hotspot map will significantly contribute to the management of HEC by identifying elephant movement patterns by accurately monitoring changes in forest greenery and weather patterns. This information can be used to prioritize areas for intervention and allocate resources more effectively in planning and land use management. Additionally, developing early warning systems can notify communities of the presence of elephants. Such systems will help prevent HEC incidents by providing communities sufficient time to take appropriate precautions and reduce negative interactions between humans and elephants. The government may declare these as protected areas, establish electrical fences or buffer zones to separate human settlements from elephant habitats, and implement other measures to reduce HEC.
Recent advances in remote sensing, including the availability of high-resolution data such as Sentinel-2 satellite images, have enabled free data access for various environmental monitoring applications. Among other applications, machine learning algorithms are widely employed in land cover mapping. Satellite data classification, RF, and SVM are commonly used algorithms due to their distinct advantages and strengths, which make them suitable for various tasks with higher classification accuracy. RF is known for its robustness to noise, handles ability to high-dimensional data, and capability to capture non-linear relationships. On the other hand, SVM performs well with limited training samples, can handle complex decision boundaries, and is robust to overfitting. Depending on the specific characteristics of the land cover classification problem, the selection of RF or SVM can lead to accurate and reliable classification results.
Support vector machine, random forest, and object-based image analysis are the three classification algorithms utilized for land cover classification. SVM and RF have gained prominence as methods for detecting changes in land cover. All three were utilized with Sentinel-2 satellite image data and evaluated. The error matrix technique was used to assess the accuracy, calculating the overall accuracy, Kappa coefficient, producer’s accuracy, and user’s accuracy of classified maps. The overall accuracy of RF and SVM ranged between 94.68% and 97.34%, with a Kappa coefficient of 0.89 to 0.94. On Sentinel-2 satellite imagery, the highest accuracy (97.34%) was achieved by RF.
The Sri Lankan elephant is the country’s largest land animal, requiring forest and other vegetation patches to survive. Therefore, the details of existing forest maps are expected to be periodically evaluated to accurately identify forests and forest patches. The data produced by this study on forest greenery changes and HEC data will be evaluated to determine possible locations where elephants are roaming.
The proposed method in this study has some limitations in real-world application, particularly concerning the accuracy of the classification. Some potential limitations include data quality, availability, and training data representativeness. The accuracy of satellite data classification heavily relies on the availability and quality of input data. Although good results for land cover classification can be obtained from Sentinel-2 imagery, it is difficult to obtain enough clear Sentinel-2 images on rainy and cloudy days. The accuracy of the classification model depends on the representativeness and quality of the training data. If training data does not adequately capture the variability and characteristics of target land cover classes, classification accuracy may be compromised. This may have a negative impact on classification accuracy.
The research methodology adopted in this study will apply to other regions dealing with similar human-wildlife conflict (HWC), considering several factors such as scalability, similar characteristics, and adaptability. The ability to scale up or down is essential for its applicability to different regions, ensuring that the methodology remains effective and feasible. Flexibility in scaling can ensure that the method remains effective and feasible. Furthermore, regions sharing similar characteristics in terms of HWC, including the presence of specific species and comparable habitats, enhance the applicability of the methodology. An adaptable and adjustable research methodology that will accommodate different contexts and conditions holds a higher potential for applicability. Considering these factors and conducting assessments before adapting the method for successful implementation and achieving desired outcomes in various regions.
5. Conclusions
HEC has significantly increased in the past seven years, doubling human and elephant deaths. Changes in LCLU, human territories expansion, rural population growth, and elephant habitat loss are primary contributing factors to this issue’s worsening. While various methods have been applied to address this matter, it remains unresolved. There is a lack of research exploring the connection between greenery changes and HEC hotspots. As an initial step, in this study, we investigated the utilization of Sentinel-2 satellite imagery for LCLU classification in Sri Lanka to monitor changes in greenery. We also analysed the relationship between the greenery of changes in land cover and HEC hotspots, highlighting the importance of satellite data as a significant tool for mapping areas of potential conflict with human activities.
Remote sensing has emerged as a powerful tool for monitoring changes in LCLU, providing crucial information for environmental management and conservation planning. This study evaluates the effectiveness of random forest, support vector machine, and object-based image analysis classification methods in producing LCLU maps using Sentinel-2 satellite data. An accuracy assessment was conducted using 188 randomly selected ground truth points. The ground truth data were gathered through field observation and Google Earth high-resolution data. The overall classification accuracies of the RF, SVM, and OBIA classifiers were 97.34%, 94.68%, and 68.62%, respectively, with Kappa coefficients of 0.94, 0.89, and 0.51, indicating strong agreement between ground truth and classified data. These findings suggested that RF and SVM are efficient and accurate approaches for classifying Sentinel-2 satellite imagery to produce LCLU maps.
Based on the LCLU map created using the RF classifier and existing records of human and elephant interactions, we found that HEC occurrences were closely related to open forest areas and forest boundaries. Most HEC incidents (54%) were recorded in the open forest area, while 62% were recorded within 2 km of forest boundaries. The findings of this study highlight the potential value of using Sentinel-2 satellite data to monitor greenery changes in relation to LCLU.
The findings of this study can be used to mitigate HEC and promote coexistence between humans and elephants. Also, the results could be valuable for managing HEC by identifying areas where elephants are most likely to come into conflict with humans. The government may declare these as protected areas, establish electrical fences or buffer zones to separate human settlements from elephant habitats, and implement other measures to reduce HEC. Furthermore, the findings of this research could be helpful to both public and private stakeholders involved in elephant conservation efforts. By understanding the patterns and drivers of HEC, stakeholders can develop targeted interventions to reduce the risk of conflict.
Acknowledgements
The first author is indebted to the University of Southern Queensland Australia for offering an international Ph.D. fees scholarship. Moreover, the first author acknowledged the paid leaves from the Uva Wellassa University of Sri Lanka to carry out this work. Furthermore, the authors are indebted to Ms Julie Martyn for proofreading support. The authors would like to thank Mr Indika Pathirana from the elephant conservation division of DWC Sri Lanka and other officers at DWC for providing HEC data for this study.
Disclosure statement
No potential conflict of interest was reported by the author(s).
References
- Aburas, M. M., S. H. Abdullah, M. F. Ramli, and Z. H. Ash’aari. 2015. “Measuring Land Cover Change in Seremban, Malaysia Using NDVI Index.” Procedia Environmental Sciences 30:238–243. https://doi.org/10.1016/j.proenv.2015.10.043.
- Adugna, T., W. Xu, and J. Fan. 2022. “Comparison of Random Forest and Support Vector Machine Classifiers for Regional Land Cover Mapping Using Coarse Resolution FY-3C Images.” Remote Sensing 14 (3): 574. https://doi.org/10.3390/rs14030574.
- Anuradha, J. M. P. N., M. Fujimura, T. Inaoka, and N. Sakai. 2019. “The Role of Agricultural Land Use Pattern Dynamics on Elephant Habitat Depletion and Human-Elephant Conflict in Sri Lanka.” Sustainability 11 (10): 2818. https://doi.org/10.3390/su11102818.
- Avci, C., M. Budak, N. Yağmur, and F. Balçik. 2021. “Comparison Between Random Forest and Support Vector Machine Algorithms for LULC Classification.” International Journal of Engineering and Geosciences. https://doi.org/10.26833/ijeg.987605.
- Belgiu, M., and L. Drăguţ. 2016. “Random Forest in Remote Sensing: A Review of Applications and Future Directions.” ISPRS Journal of Photogrammetry and Remote Sensing 114:24–31. https://doi.org/10.1016/j.isprsjprs.2016.01.011.
- Blaschke, T. 2010. “Object Based Image Analysis for Remote Sensing.” ISPRS Journal of Photogrammetry and Remote Sensing 65 (1): 2–16. https://doi.org/10.1016/j.isprsjprs.2009.06.004.
- Cabral de Mel, S. J., S. Seneweera, R. K. de Mel, A. Dangolla, D. K. Weerakoon, T. Maraseni, and B. L. Allen. 2022. “Current and Future Approaches to Mitigate Conflict Between Humans and Asian Elephants: The Potential Use of Aversive Geofencing Devices.” Animals (Basel) 12 (21): 2965. https://doi.org/10.3390/ani12212965.
- Cervantes, J., F. Garcia-Lamont, L. Rodríguez-Mazahua, and A. Lopez. 2020. “A Comprehensive Survey on Support Vector Machine Classification: Applications, Challenges and Trends.” Neurocomputing 408:189–215. https://doi.org/10.1016/j.neucom.2019.10.118.
- Chabalala, Y., E. Adam, and K. A. Ali. 2022. “Machine Learning Classification of Fused Sentinel-1 and Sentinel-2 Image Data Towards Mapping Fruit Plantations in Highly Heterogenous Landscapes.” Remote Sensing 14 (11): 2621. https://doi.org/10.3390/rs14112621.
- De Luca, G., N. Silva, J. M, S. Cerasoli, J. Araújo, J. Campos, S. Di Fazio, and G. Modica. 2019. “Object-Based Land Cover Classification of Cork Oak Woodlands Using UAV Imagery and Orfeo Toolbox.” Remote Sensing 11 (10): 1238. https://doi.org/10.3390/rs11101238.
- Department of Wildlife Conservation. 2023. About DWC. Accessed July 10, 2023. https://www.dwc.gov.lk/about-the-agency/.
- Entekhabi, D., K. Perera, R. Tateishi, Y. Honda, H. Sawada, J. Shi, and T. Oki. 2012. Supporting Elephant Conservation in Sri Lanka Through MODIS Imagery. Kyoto, Japan: Land Surface Remote Sensing.
- European Space Agency. 2014. “Sentinel-2 Missions Sentinel Online.” Accessed January 24, 2023. https://sentinel.esa.int/web/sentinel/missions.
- European Space Agency. 2015. Sentinel-2 User Handbook, 64, Vol. 1. Paris, France. https://sentinel.esa.int/documents/247904/685211/Sentinel-2_User_Handbook.
- European Space Agency. 2023a. “Sentinel-2. The European Space Agency.” https://sentinel.esa.int/web/sentinel/missions/sentinel-2.
- European Space Agency. 2023b. Resolutions. The European Space Agency. Accessed January 25, 2023. https://sentinels.copernicus.eu/web/sentinel/user-guides/sentinel-2-msi/resolutions.
- European Space Agency. 2023c. “Sentinel-2 MSI Level-2A.” https://sentinels.copernicus.eu/web/sentinel/user-guides/sentinel-2-msi/product-types/level-2a.
- Fernando, P., and J. Pastorini. 2011. “Range-Wide Status of Asian Elephants.” Gajah (35): 15–20. http://www.ccrsl.org/userobjects/2602_662_Fernando-11-ElephantStatus.pdf.
- Foody, G. M., and A. Mathur. 2004. “Toward Intelligent Training of Supervised Image Classifications: Directing Training Data Acquisition for SVM Classification.” Remote Sensing of Environment 93 (1–2): 107–117. https://doi.org/10.1016/j.rse.2004.06.017.
- Gunawansa, T. D., K. Perera, A. Apan, and N. K. Hettiarachchi. 2023. “The Human-Elephant Conflict in Sri Lanka: History and Present Status.” Biodiversity and Conservation 32 (10): 3025–3052. https://doi.org/10.1007/s10531-023-02650-7.
- Hay, G. J., and G. Castilla 2006. “Object-Based Image Analysis: Strengths, Weaknesses, Opportunities and Threats (SWOT).” In Proceedings of the 1st International Conference on Object-based Image Analysis, Salzburg, Austria, July 2006.
- Hossain, M. D., and D. Chen. 2019. “Segmentation for Object-Based Image Analysis (OBIA): A Review of Algorithms and Challenges from Remote Sensing Perspective.” ISPRS Journal of Photogrammetry and Remote Sensing 150:115–134. https://doi.org/10.1016/j.isprsjprs.2019.02.009.
- Hossain, M. S., M. A. H. Khan, T. V. Oluwajuwon, J. Biswas, S. M. Rubaiot Abdullah, M. S. S. I. Tanvir, and M. N. A. Chowdhury. 2023. “Spatiotemporal Change Detection of Land Use Land Cover (LULC) in Fashiakhali Wildlife Sanctuary (FKWS) Impact Area, Bangladesh, Employing Multispectral Images and GIS.” Modeling Earth Systems and Environment 9 (3): 3151–3173. https://doi.org/10.1007/s40808-022-01653-7.
- IUCN. 2020. “IUCN Red List Threat. Species (2307–8235).” https://www.iucnredlist.org/.
- Jayasundara, H. B. 2023. “Organic Farming in Sri Lanka Ideology of Hitler & Sri Lankan Agri “Cults”.” Colombo Telegraph. https://www.colombotelegraph.com/index.php/organic-farming-in-sri-lanka-ideology-of-hitler-sri-lankan-agri-cults/.
- Jin, Y., X. Liu, Y. Chen, and X. Liang. 2018. “Land-Cover Mapping Using Random Forest Classification and Incorporating NDVI Time-Series and Texture: A Case Study of Central Shandong.” International Journal of Remote Sensing 39 (23): 8703–8723. https://doi.org/10.1080/01431161.2018.1490976.
- Kazemi Garajeh, M., B. Feizizadeh, Q. Weng, M. H. Rezaei Moghaddam, and A. Kazemi Garajeh. 2022. “Desert Landform Detection and Mapping Using a Semi-Automated Object-Based Image Analysis Approach.” Journal of Arid Environments 199:104721. https://doi.org/10.1016/j.jaridenv.2022.104721.
- KenyaWildlifeService. 1994. “Wildlife–Human Conflicts in Kenya.” Report of the five-person review group
- Lindström, S. 2011. Tropical Deforestation in Sri Lanka, 55. Sweden: University of Gothenburg. http://www.focali.org/filer/Uppsats_Tropical%20deforestation%20in%20Sri%20Lanka_final110909-1.pdf.
- Lu, D., and Q. Weng. 2007. “A Survey of Image Classification Methods and Techniques for Improving Classification Performance.” International Journal of Remote Sensing 28 (5): 823–870. https://doi.org/10.1080/01431160600746456.
- Marissiaux, Q., and P. Defourny. 2018. “Characterizing Tropical Forest Dynamics by Remote-Sensing Using Very High Resolution and Sentinel-2 Images.”
- Marshal, J. P., A. Rajah, F. Parrini, M. Henley, S. R. Henley, and B. F. N. Erasmus. 2010. “Scale-Dependent Selection of Greenness by African Elephants in the Kruger-Private Reserve Transboundary Region, South Africa.” European Journal of Wildlife Research 57 (3): 537–548. https://doi.org/10.1007/s10344-010-0462-1.
- Mitraka, Z., S. Siachalou, G. Doxani, and P. Patias. 2020. “Decision Support on Monitoring and Disaster Management in Agriculture with Copernicus Sentinel Applications.” Sustainability 12 (3): 1233. https://doi.org/10.3390/su12031233.
- MOH, M. O. H. 2023. “Government Hospital in Sri Lanka.” Accessed March 9, 2023. https://www.health.gov.lk/mohfinal/english/hospitalgovernment.php?spid=24.
- Mountrakis, G., J. Im, and C. Ogole. 2011. “Support Vector Machines in Remote Sensing: A Review.” ISPRS Journal of Photogrammetry and Remote Sensing 66 (3): 247–259. https://doi.org/10.1016/j.isprsjprs.2010.11.001.
- Nasir, S. M., K. V. Kamran, T. Blaschke, and S. Karimzadeh. 2022. “Change of Land Use/Land Cover in Kurdistan Region of Iraq: A Semi-Automated Object-Based Approach.” Remote Sensing Applications: Society & Environment 26:26. https://doi.org/10.1016/j.rsase.2022.100713.
- Nguyen, V. V., T. T. T. Phan, and L. Chun-Hung. 2022. “Integrating Multiple Aspects of Human–Elephant Conflict Management in Dong Nai Biosphere Reserve, Vietnam.” Global Ecology and Conservation 39. https://doi.org/10.1016/j.gecco.2022.e02285.
- Omia, E., H. Bae, E. Park, M. S. Kim, I. Baek, I. Kabenge, and B.-K. Cho. 2023. “Remote Sensing in Field Crop Monitoring: A Comprehensive Review of Sensor Systems, Data Analyses and Recent Advances.” Remote Sensing 15 (2): 354. https://doi.org/10.3390/rs15020354.
- Pádua, L., A. M. Antão-Geraldes, J. J. Sousa, M. Â. Rodrigues, V. Oliveira, D. Santos, and J. P. Castro. 2022. “Water Hyacinth (Eichhornia Crassipes) Detection Using Coarse and High Resolution Multispectral Data.” Drones 6 (2): 47. https://doi.org/10.3390/drones6020047.
- Perera, B. 2021. “Deforestation is a Threat to National Security.” www.sundaytimes.lk. Accessed March 28, 2021. https://www.sundaytimes.lk/210328/sunday-times-2/deforestation-is-a-threat-to-national-security-437951.html.
- Perera, K., S. Herath, A. Apan, and R. Tateishi. 2012. “Application of Modis Data to Assess the Latest Forest Cover Changes of Sri Lanka.” ISPRS Annals of the Photogrammetry, Remote Sensing & Spatial Information Sciences 1:165–170. https://doi.org/10.5194/isprsannals-I-7-165-2012.
- Perera, K., and K. Tsuchiya. 2009. “Experiment for Mapping Land Cover and It’s Change in Southeastern Sri Lanka Utilizing 250m Resolution MODIS Imageries.” Advances in Space Research 43 (9): 1349–1355. https://doi.org/10.1016/j.asr.2008.12.016.
- Pesaresi, S., A. Mancini, G. Quattrini, and S. Casavecchia. 2020. “Mapping Mediterranean Forest Plant Associations and Habitats with Functional Principal Component Analysis Using Landsat 8 NDVI Time Series.” Remote Sensing 12 (7): 1132. https://doi.org/10.3390/rs12071132.
- Ranagalage, M., M. H. J. P. Gunarathna, T. D. Surasinghe, D. Dissanayake, M. Simwanda, Y. Murayama, and A. Sathurusinghe. 2020. “Multi-Decadal Forest-Cover Dynamics in the Tropical Realm: Past Trends and Policy Insights for Forest Conservation in Dry Zone of Sri Lanka.” Forests 11 (8): 836. https://doi.org/10.3390/f11080836.
- Rathnayake, C. W. M., S. Jones, M. Soto-Berelov, and L. Wallace. 2022. “Human–Elephant Conflict and Land Cover Change in Sri Lanka.” Applied Geography 143:102685. https://doi.org/10.1016/j.apgeog.2022.102685.
- Rwanga, S. S., and J. M. Ndambuki. 2017. “Accuracy Assessment of Land Use/Land Cover Classification Using Remote Sensing and GIS.” International Journal of Geosciences 8 (04): 611–622. https://doi.org/10.4236/ijg.2017.84033.
- Saini, R., and S. K. Ghosh. 2018. “Crop Classification on Single Date Sentinel-2 Imagery Using Random Forest and Suppor Vector Machine.” The International Archives of the Photogrammetry, Remote Sensing and Spatial Information Sciences XLII-5:683–688. https://doi.org/10.5194/isprs-archives-XLII-5-683-2018.
- Samansiri, K., and D. K. Weerakoon. 2007. “Feeding Behaviour of Asian Elephants in the Northwestern Region of Sri Lanka.” Gajah 27:27–34. https://www.asesg.org/PDFfiles/Gajah/27-27-Samansiri.pdf.
- Srivastava, P. K., D. Han, M. A. Rico-Ramirez, M. Bray, and T. Islam. 2012. “Selection of Classification Techniques for Land Use/Land Cover Change Investigation.” Advances in Space Research 50 (9): 1250–1265. https://doi.org/10.1016/j.asr.2012.06.032.
- Sudhakar Reddy, C., G. Manaswini, C. S. Jha, P. G. Diwakar, and V. K. Dadhwal. 2016. “Development of National Database on Long-Term Deforestation in Sri Lanka.” Journal of the Indian Society of Remote Sensing 45 (5): 825–836. https://doi.org/10.1007/s12524-016-0636-8.
- Sukumar, R. 2006. “A Brief Review of the Status, Distribution and Biology of Wild Asian Elephants Elephas maximus.” International Zoo Yearbook 40 (1): 1–8. https://doi.org/10.1111/j.1748-1090.2006.00001.x.
- Tatsumi, K., Y. Yamashiki, M. A. Canales Torres, and C. L. R. Taipe. 2015. “Crop Classification of Upland Fields Using Random Forest of Time-Series Landsat 7 ETM+ Data.” Computers and Electronics in Agriculture 115:171–179. https://doi.org/10.1016/j.compag.2015.05.001.
- Thanh Noi, P., and M. Kappas. 2018. “Comparison of Random Forest, K-Nearest Neighbor, and Support Vector Machine Classifiers for Land Cover Classification Using Sentinel-2 Imagery.” Sensors 18 (1): 20. https://doi.org/10.3390/s18010018.
- Williams, C., S. K. Tiwari, V. R. Goswami, S. de Silva, A. Kumar, N. Baskaran, and V. Menon. 2008. “Elephas maximus.” The IUCN Red List of Threatened Species 2020. https://doi.org/10.2305/IUCN.UK.2008.RLTS.T7140A12828813.en.
- WorldBank. 2023. “Rural Population - Sri Lanka. The World Bank Group.” Accessed January 20, 2023. https://data.worldbank.org/indicator/SP.RUR.TOTL?locations=LK.
- Yeshey, K., R. J, R. M. Ford, and C. R. Nitschke. 2023. “Sustainable Development Implications of Human Wildlife Conflict: An Analysis of Subsistence Farmers in Bhutan.” International Journal of Sustainable Development & World Ecology 30 (5): 1–16. https://doi.org/10.1080/13504509.2023.2167242.
- Yousefi, S., S. Mirzaee, H. Almohamad, A. A. Al Dughairi, C. Gomez, N. Siamian, and H. G. Abdo. 2022. “Image Classification and Land Cover Mapping Using Sentinel-2 Imagery: Optimization of SVM Parameters.” Land 11 (7): 993. https://doi.org/10.3390/land11070993.
- Zaki, A., I. Buchori, A. W. Sejati, and Y. Liu. 2022. “An Object-Based Image Analysis in QGIS for Image Classification and Assessment of Coastal Spatial Planning.” The Egyptian Journal of Remote Sensing & Space Science 25 (2): 349–359. https://doi.org/10.1016/j.ejrs.2022.03.002.
- Zarandian, A., F. Mohammadyari, M. M. Mirsanjari, and J. S. Visockiene. 2023. “Scenario Modeling to Predict Changes in Land Use/Cover Using Land Change Modeler and InVest Model: A Case Study of Karaj Metropolis, Iran.” Environmental Monitoring and Assessment 195 (2). https://doi.org/10.1007/s10661-022-10740-2.
- Zhang, L., and N. Wang. 2003. “An Initial Study on Habitat Conservation of Asian Elephant (Elephas maximus), with a Focus on Human Elephant Conflict in Simao, China.” Biological Conservation 112 (3): 453–459. https://doi.org/10.1016/s0006-3207(02)00335-x.
- Zheng, B., S. W. Myint, P. S. Thenkabail, and R. M. Aggarwal. 2015. “A Support Vector Machine to Identify Irrigated Crop Types Using Time-Series Landsat NDVI Data.” International Journal of Applied Earth Observation and Geoinformation 34:103–112. https://doi.org/10.1016/j.jag.2014.07.002.