
ABSTRACT
Illicit maritime activity, such as piracy and smuggling, is a global issue that often occurs in areas where interdiction authorities are sparse, ground-based monitoring technologies like radar lack range and coverage, and dark vessels abound. Our objective was to assess vessel congregation patterns, identify likely beaching areas based on terrain maps, and use them to narrow the search for potential smuggling transfer and overland routes in a specific region along the Puntland coast of Somalia. To accomplish this goal, we developed automated protocols applied to WorldView satellite imagery for (1) vessel detection and size classification, (2) shallow-water bathymetric characterization, and (3) coastal topography mapping. Utilizing a single sensor for vessel detection and topographic and bathymetric extraction at high spatial resolution and at a high re-visit rate provides a simplification to near-shore characterization for monitoring purposes. The extracted topography and bathymetry are then presented as a single, comprehensive perspective of a coastal region. The vessel-detection algorithm identified all vessels larger than approximately 15 metres in length (35 of 35), but misidentified six artefacts (i.e. false positives), resulting in an overall accuracy of 85%. The combined vessel and terrain maps facilitated the identification of a potential beaching and overland transportation route location.
1. Introduction
Illicit maritime activity, ranging from illegal fishing to smuggling and piracy, is notoriously challenging to confront in many regions due to lack of interdiction authorities, poor ground-based monitoring-technology coverage (e.g. radar), and abundant concomitant law-abiding activity among which to hide (Bahadur Citation2022; Shao et al., Citation2021; Downes, Hobbs, and Salisbury Citation2019). Automated Identification System (AIS) signals are routinely used to monitor vessel traffic, but many vessels will turn off or spoof their signals, or neglect to carry AIS at all (Kanjir, Greidanus, and Oštir Citation2018). These ‘dark vessels’ represent a substantial weakness in monitoring efforts that must be addressed to holistically evaluate the coastal environment for unlawful activity. As revisit rates on commercially available imagery have decreased from days to hours and spatial resolution hovers at and below 1 metre, they have become relevant for monitoring of maritime pattern of life. With large coastal areas to monitor and limited resources for interdiction, local authorities could leverage remote sensing tools for assistance in identifying suspicious vessel activity and isolating specific areas for more targeted monitoring.
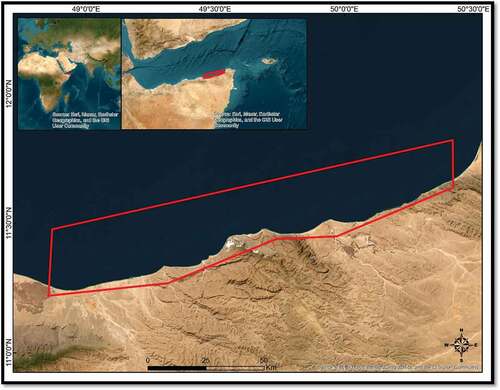
Regional unregulated vessels, specifically Indian Ocean dhows, were identified as the vessel class of interest for this proof-of-concept evaluation focused on the Puntland coast of Somalia. Dhows are a challenge for local maritime security authorities primarily because of their construction. Under the current international safety and security requirements, wooden, fibreglass and other vessels of ‘primitive build’ involved in international trade are specifically exempt from requirements to instal and operate AIS devices onboard or use an internationally recognized and issued registration number (Benson). These two factors greatly complicate the ability to monitor and track these vessels’ activities. Further, the northern coast of Somalia has been a target for illicit maritime activity with interdictions finding smuggled weapons and even trafficked endangered animals (Bahadur Citation2022). We focused on a 175 km stretch of the coast spanning several port towns and bounded by Bosaso and Qandala – both suspected of or known to be involved in illicit activity – and separated by large stretches of sparsely inhabited desert () (Bahadur Citation2022).
Figure 1. Study area of the Somalian Puntland coast with the 175 km area of interest highlighted in red.
Dhows have been exploited for a wide variety of illicit and destabilizing activities, possibly because they are unregulated vessels (Bueger and Stockbruegger Citation2022). Dhows have been rumoured to be involved with, and in separate incidents, interdicted with weapons, narcotics, explosives, violent extremist personnel, endangered wildlife, and other illicit products onboard. Dhows are also connected with countries and areas that are home to violent extremist organizations. These organizations are funded by and supported with materiel through both taxing and controlling the ‘legitimate’ trade and illicit smuggling carried out by dhows (Benson).
The goal of this project was to identify potential interdiction points where maritime traffic meets overland transfer routes to reduce the risk represented by smuggling through dhows while simultaneously facilitating the legal commerce and trade in unstable or conflict areas. Given the large-scale legitimate use of dhows in regional activity, simply detecting such vessels would not be sufficient to achieve this goal. However, detecting local areas of dhow congregation, combined with topobathymetric maps indicating deep-water cuts adjacent to shore and shallow coastal slopes for efficient overland traffic may increase the likelihood of identifying transfer points. The objectives were to (1) develop an algorithm for automated vessel detection and classification by size, (2) map coastal topography and bathymetry, and (3) use vessel clusters and topobathymetric patterns to isolate areas of likely illicit activity.
2. Materials and methods
This section describes the data used and algorithms developed for this research.
2.1. Data
This project relied on 20 images from the WorldView-2 (WV-2; 15 images) and WorldView-3 (WV-3; 5 images) satellite sensors. Maxar’s WV-2 operates at an altitude of 770 km, provides up to 46 cm panchromatic resolution and 1.85 m multispectral resolution with an average revisit time of 1.1 days (Citation2016). The satellite can collect nearly 1 million km2 of 8band imagery per day (Citation2016). The platform has Civil and Commercial Applications Project, or CCAP, metrics between 2.4 to 3.5 m at nadir, < 6.5 m, and has stereo geolocation accuracy within those metrics (Smiley Citation2011).
WV-3 was the first multi-payload, super-spectral, high-resolution commercial satellite. The satellite operates at an altitude of 617 km in a sun-synchronous orbit with an average revisit time of < 1 day with a ground sample distance (GSD) of 1 m or better (Citation2013). Revisit times for an off-nadir angle of < 20 degrees are approximately 4.5 days (Citation2013).
The WV-3 imager has 29 spectral bands including: 1 panchromatic band, 8 multispectral bands, 8 shortwave IR bands, and 12 cloud, aerosol, vapour, ice, and snow (CAVIS) bands Pacifici (Citation2016).
In our initial investigations on effective methods to detect and characterize maritime vessels, we included ICEYE synthetic aperture radar (SAR) data (https://www.iceye.com/en-us/) and passive radar from satellite from Hawkeye360 (https://www.he360.com/). We found that the SAR data did not consistently detect dhows, which is likely due to the construction material (i.e. wooden structures reflect radar poorly). There was some value to using SAR for cloudy and night-time conditions, but returns were substantially hampered by the wooden dhow construction type. We also found that the spatial error ellipses from Hawkeye360 were too large to be useful for this effort.
2.2. Methods
This section describes the preprocessing of satellite imagery and the algorithms applied for vessel detection, bathymetry, topography, and overland route detection.
2.2.1. Preprocessing
Preprocessing of all images included radiometric calibration, atmospheric correction, and correction for time-delay integration settings. Images were acquired as Level-1B rasters and converted from digital number to at-sensor radiance using the calibration factors supplied with each image’s metadata (Updike and Comp Citation2010). Further processing followed the atmospheric-correction protocol of Bilal et al. Citation2019 Equation (4)–(13) and references therein (Bilal et al. Citation2019), which accounts for date, time, Earth-Sun distance, latitude, longitude, Sun and satellite geometries, Rayleigh reflectance, atmospheric backscattering, and total atmospheric transmission.
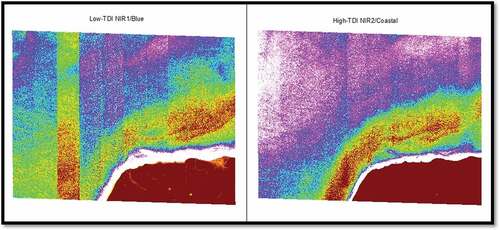
Initial testing of vessel-detection algorithms on the preprocessed imagery revealed substantial vertical striping throughout some output products. This is a common occurrence with aquatic pixels due to the land-optimized nature of the WV-2 and WV-3 sensors (Coffer et al. Citation2022). Specifically, the issue is attributed to the sensors’ time-delay integration (TDI) parameter, which is a photographic technique that may be optimized to capture fast-moving targets in low-light conditions (or by fast-moving sensors). The vertical streaks across water scenes are the result of inconsistent TDI settings across the eight multispectral bands. Higher TDI settings are preferred in low-light conditions to allow additional incident light to be included in the at-sensor radiance measured for each pixel. Red and Near-Infrared band TDIs are often set lower than other bands for terrestrial targets because vegetation reflects higher in those bands, but for aquatic scenes the reverse is true, so lower TDI settings in those bands likely leads to insufficient signal-to-noise ratio (Coffer et al. Citation2022). The effect was most pronounced in intermediate products derived from normalized difference indices using either of the two near-infrared bands. To account for this issue, the TDI setting of every band was read in from the metadata and the near-infrared band with the higher TDI setting was used in subsequent equations ().
Figure 2. A band ratio equation applied to bands with low TDI (left) clearly reveals vertical striping throughout the image over aquatic pixels that are not seen in the terrestrial pixels (i.e. the lower right of the image). Using high-TDI bands (right) largely eliminates the striping.
2.2.2. Vessel detection
The first objective was to detect all vessels in the images covering the study area (Kanjir, Greidanus, and Oštir Citation2018; Liu et al. Citation2016). This was accomplished using a combination of threshold-based indices, morphologic filters, and cluster-size filters. First, pixels comprised of water or vegetation were identified using standard normalized difference water and vegetation indices (i.e. NDWI and NDVI) and masks for each were created. Land was additionally identified using morphologic close, erode, and dilate filters using the near-infrared 1 (NIR1) band values as input. An initial vessel mask was created using the non-water pixels identified with the original NDWI output using a threshold value of 0.3.
A TopHat filter was used on this initial mask to detect objects with a 7 × 7pixel moving-window filter followed by a morphological closing operation to include pixels in the centre of vessels that were often substantially darker in colour than the surrounding deck and hull (e.g. blue tarps covering cargo). A new vessel mask was then created by eliminating from this secondary vessel mask all pixels that were included in the water, vegetation, or land masks. Finally, presumptive vessel objects were clustered and counted for pixels so that exceptionally large objects (i.e. greater than 1000 pixels) were eliminated (e.g. small islands), and exceptionally small objects (i.e. fewer than 7 pixels) were eliminated as likely artefacts (e.g. white caps or glint). Remaining objects were grouped into small (>7 and < 70), medium (>70 and < 150), and large (>150) classes. Average runtime for the algorithm was 60 seconds. We chose this approach over human labelling and machine learning approaches for automation, efficiency, and flexibility purposes. Human labelling would preclude automation and take many times longer to complete. Machine learning algorithms were initially investigated, but we found we had too few training samples for the specific target vessel (Iranian-style dhows) to move forward successfully. Standardize.
Validation was conducted independently of algorithm development and application by two technicians who visually scanned each image for vessels. Polygons were drawn around all suspected vessels and notes were captured in polygon metadata describing the technician’s confidence about the identification. During quality control, all polygons of ‘low confidence’ were eliminated from further consideration. Vessels mapped by the detection algorithm were then overlaid with polygons to determine accuracy.
2.2.3. Bathymetry
Mapping coastal water depth was achieved using the protocol described in (McCarthy et al. Citation2022). Briefly, this method includes radiometric calibration, atmospheric correction, surface reflectance correction, Chlorophyll-a concentration estimation, and a band-ratio to map depth. The applicable depth range for this algorithm applied to WorldView data is 0–15 metres, which was considered sufficient for the study area given that the focus was on identifying areas deep enough to support the shallow-draft (i.e. 0.5–2.5 m) dhow vessels of interest. After mapping individual images, mosaicking was conducted in ArcMap™ to create a single bathymetry map of the study area.
2.2.4. Topography
Digital surface models (DSMs) were needed that met three requirements: affordable and timely to produce; at a resolution of around 1 metre to be useful for relevant traffic; and reproducible on a timescale on the order of days allowing for capturing pattern of life activity. It was determined that these three are satisfied using commercial electro-optical satellites and using two-view, epipolar reconstruction to create timely, high-resolution DSMs (see ). Using a high-performance computing capability allowed us to meet the requirements set out above.
Figure 3. (Left) digital surface Model using 30 m SRTM data. (Right) digital surface Model derived from 2-view epipolar satellite imagery. Note the detail as the DSM is very near the GSD of the input satellite imagery (approximately 1.5 m postings).
We used both fortuitous and planned stereo pairs (e.g. two images) of WV imagery to create DSMs (Kelbe et al. Citation2017; Page et al. Citation2017). Fortuitous stereo pairs are those that were not intentionally collected as stereo pairs but due to their varied pointing angles, can create a reasonable epi-polar pair and digital surface model. There are mature and commercially available methods to determine DSMs from multi-view (many more than 2 views), but the utility of providing such information in a timely manner covering vast areas (e.g. for smuggling surveillance) does not exist. We provide for this work a satellite-based, wide-area assessment capability using only 2 satellite images as described in Page et al. (Citation2017). The resulting DSMs are very close to the sensor spatial resolution (approximately 1–2 metre GSD) so provide fine detail.
After mapping elevation, slope was calculated using ArcMap™ to visually identify areas of high and low relief along the coast, which were used to isolate likely beaching locations for subsequent overland route identification.
2.2.5. Overland route identification
The goal of developing and combining the preceding algorithms was to narrow down the search for suspected beach landing and overland transport routes. Assuming that interdiction would be most successful at the chokepoint where maritime traffic meets terrestrial handoff near or onshore, we visually evaluated the combination of vessel congregation, bathymetry, and slope maps to identify likely transition locations. This included identifying locations where one or more vessels were apparently moored, regions of deeper water adjacent to shore, and flat coastal terrain connected to inland routes such as dried riverbeds.
3. Results
3.1. Vessel detection
Twenty WorldView images were mapped for vessels with an average processing time of 50 seconds per image, and 41 vessels were identified. Validation found 35 vessels, equating to an accuracy of 85%, with the remaining six artefacts visually identified as small islands, cloud, and a pier along the port of Bosaso. Of the 35 vessels found, 28 were classified as small (e.g. likely Iranian-constructed, lenj-style dhows), three were classified as medium (e.g. likely Indian-constructed, vahan-style dhows), and four were classified as large (e.g. commercial cargo vessels) as shown in and .
Figure 4. Mapped vessels as purple objects with insets indicating a large congregation outside the port of Bosaso and a small congregation near a dried riverbed mouth.
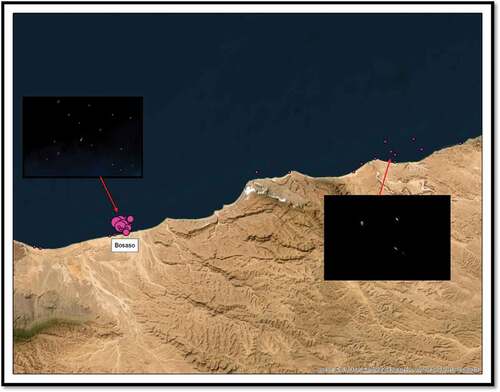
Figure 5. For a large congregation of vessels identified outside the port of Bosaso, the top panel shows the vessels as seen in WorldView imagery, and the bottom panel shows the mapped vessel objects classified by size (© 2020 DigitalGlobe NextViewLicense).
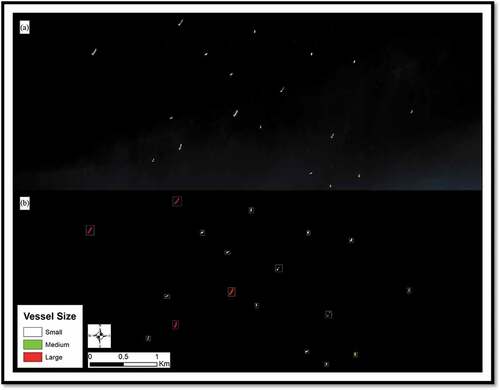
Figure 6. A subset of the Bosaso congregation zoomed-in for greater detail with validation boxes drawn around four vessels. Large vessels (red) are commercial cargo vessels and small vessels (white) are likely Iranian-style dhows (© 2020 DigitalGlobe NextViewLicense).
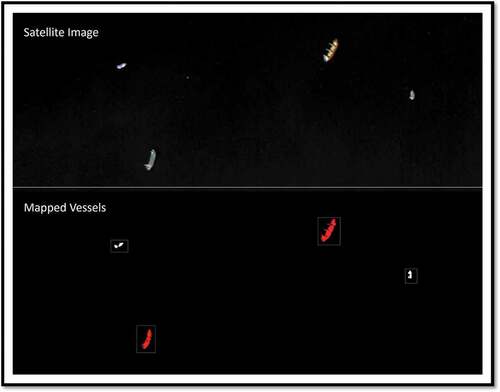
Table 1. Number of identified vessels per size class.
3.2. Bathymetry
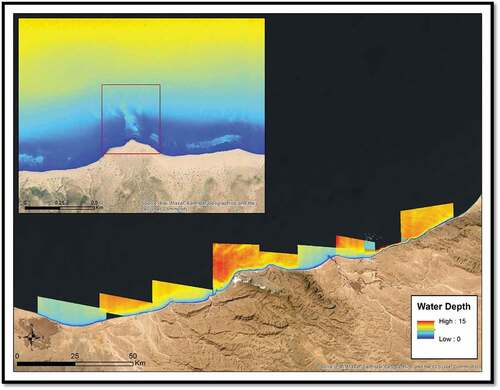
Water depth from 0 to 15 metres was mapped for all 20 images covering the study area at average rate of approximately 1 minute per image (). Validation data were not available for this remote location, but we expect similar accuracy (i.e. RMSE ~1.95 m) to that published in McCarthy et al. (Citation2022) given the relatively clear water with virtually no source of riverine sediment or dissolved organic matter observed. Resulting maps indicated a consistent pattern of relatively deep water (10+ m) within 1–2 kilometres of shore, and shallow water (0–2 m) adjacent to the shoreline, but with several areas of deeper water along the coast ().
Figure 7. Bathymetry mapped across the study area with inset indicating a narrow region of deeper water (yellow and teal) close to shore.
3.3. Topography
Topographic maps were created using fortuitous stereo pairs from WV-2 and WV-3. Relevant thresholds that were set for the DSM construction were: minimum and maximum convergence of 5 and 30; and BIE convergence minimum of 20. Maps were processed with Dell C4130’s (12-core hyper-threaded CPUs), which have 4× nVidia K80 GPUs. The processing time varies with the dynamic range of the terrain (i.e. variation in elevation changes across the image pair) and the area of overlap between the stereo images. For processing the WV imagery used in this study, each DSM took around 2 minutes to complete.
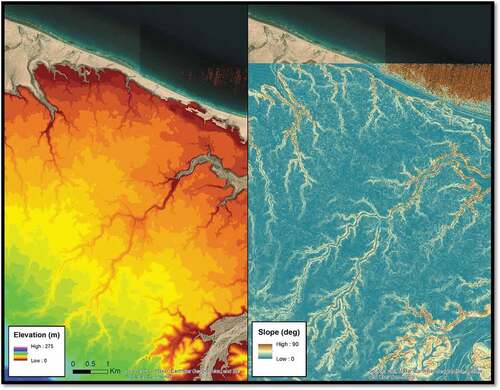
Slope was derived from DSMs in ArcMap™ using the streamflow protocol. After filling local depression artefacts and computing stream order, slope was mapped both along the coastline and inland to evaluate beach terrain and identify where low-relief coastal areas connect to potential inland routes ().
Figure 8. Elevation (left) from DSMs was used to create maps of slope (right) to identify areas of low relief (blue shades) that could facilitate overland transportation. The coastline tended to exhibit either very flat terrain or steep-sided cliffs. Dried riverbeds are apparent and may be used as convenient informal transportation routes.
3.4. Overland route identification
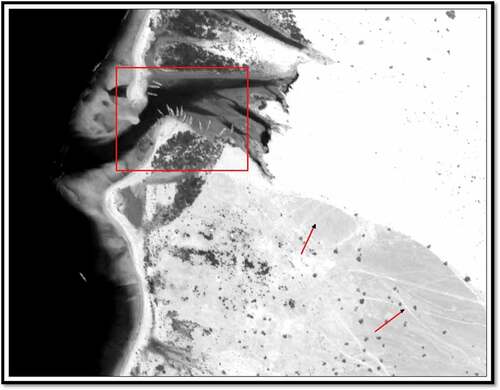
Visual assessment of the vessel, bathymetry, and topography maps across the study area was carried out in ArcMap™. Maps of vessels were used to identify areas of congregation (i.e. apparent mooring) along the coast. Bathymetry maps revealed several areas of deeper water adjacent to the coast, as well as small inlets, and topography-derived slope maps highlighted wide, flat beaches that connected to dried riverbeds extending inland. Panchromatic WorldView images were also visually evaluated as they provided approximately four times the resolution of the multispectral data. The example shown in highlights a combination of one moored vessel and many beached vessels in an inlet adjacent to flat beach at the end of a dried riverbed, as well as apparent overland transportation paths.
Figure 9. Example of identified vessel-beaching and overland transportation departure point. Small vessels are highlighted in the red box where an inlet facilitates safe vessel storage, and arrows point to apparent foot and vessel-traffic paths in the sand (© 2020 DigitalGlobe NextViewLicense).
4. Discussion
Illicit activity tends to exploit weaknesses in monitoring and interdiction capabilities (Bahadur Citation2022; Benson). The vast global maritime realm represents a lucrative avenue for smuggling, piracy, trafficking, and similar activities because its size facilitates a nearly limitless scope of potential interdiction points. By expanding the range of monitored area with satellite imagery, we may narrow the potential targets for authorities to patrol so that they may gain an advantage in countering such activity. In coastal regions like Puntland, where interdiction efforts have revealed a clear pattern of maritime smuggling, but where a sparsely populated, extensive, and largely homogenous coastline creates many potential points of transfer, we targeted vessel congregations and topobathymetric patterns to isolate the search (Bahadur Citation2022; Benson).
To simplify the application of these technologies, we developed fully automated algorithms and leveraged a single data source: WorldView satellite imagery. After acquiring a series of images covering a study area, these automated algorithms may be applied to generate a holistic characterization of the coastal environment. Detecting and classifying vessels by size may narrow the search for those of interest and identify areas of congregation. Bathymetric maps accurate to 15 metres deep should be appropriate for most vessels that might engage in coastal activity. By combining them with topographic maps from the same data source, we can create a seamless map of terrain from reef to ridge. Future research may also use these datasets to apply cost functions with congregations as the starting point to identify the path of least resistance from coast to inland population centres. Further, the algorithms developed here required no tuning for this study area versus others, and thus should be broadly applicable to a variety of coastal study areas. Validating the results of research regarding illicit activity is inherently difficult due to the lack of precise publicly available information about successful (or unsuccessful) interdiction (e.g. date, time, and location) attempts. The goal of this and similar studies must then be to develop protocols that offer useful insight for authorities to leverage. Further, this research may be built on in future efforts by incorporating more frequent image acquisitions in an operational manner to monitor daily or weekly vessel traffic in combination with the relatively static topobathymetric maps.
Code, data, and materials availability
Satellite imagery data were acquired through NextView License and cannot be shared publicly, but are available for purchase from DigitalGlobe or acquisition through licence. The code for these algorithms is business-sensitive and not publicly available.
Acknowledgements
The authors would like to thank the United States Department of Energy, National Nuclear Security Administration for their support of this work. This manuscript was authored by UT-Battelle, LLC, under contract DE-AC05-00OR22725 with the US Department of Energy (DOE). The US government retains and the publisher, by accepting the article for publication, acknowledges that the US government retains a non-exclusive, paid-up, irrevocable, worldwide license to publish or reproduce the published form of this manuscript, or allow others to do so, for US government purposes. DOE will provide public access to these results of federally sponsored research in accordance with the DOE Public Access Plan.
Disclosure statement
No potential conflict of interest was reported by the author(s).
References
- Bahadur, J. 2022 “The Price of Civil War: A Survey of Somalia’s Arms Markets.” Global Initiative Against Transnational Organized Crime, Apr. [Online]. https://globalinitiative.net/analysis/somalia-arms-trafficking/
- Benson, J., “The Risk of Maritime Radiological and Nuclear Trafficking by Small, Traditional, and Unregulated Vessels,” Stable Seas, UNODC. [Online]. https://www.stableseas.org/post/maritime-radiological-and-nuclear-trafficking-by-small-traditional-and-unregulated-vessels
- Bilal, M., M. Nazeer, J. E. Nichol, M. P. Bleiweiss, Z. Qiu, E. Jäkel, J. R. Campbell, et al. 2019. “A Simplified and Robust Surface Reflectance Estimation Method (SREM) for Use Over Diverse Land Surfaces Using Multi-Sensor Data.” Remote Sensing, 11 (11): 1344. https://doi.org/10.3390/rs11111344
- Bueger, C., and J. Stockbruegger. 2022. “Maritime Security and the Western Indian Ocean’s Militarisation Dilemma.” African Security Review, 31 (2): 195–210. https://doi.org/10.1080/10246029.2022.2053556.
- Coffer, M. M., P. J. Whitman, B. A. Schaeffer, V. Hill, R. C. Zimmerman, W. B. Salls, M. C. Lebrasse, et al. 2022. “Vertical Artifacts in High-Resolution WorldView-2 and WorldView-3 Satellite Imagery of Aquatic Systems.” International Journal of Remote Sensing, 43 (4): 1199–1225. https://doi.org/10.1080/01431161.2022.2030069
- Downes, R., C. Hobbs, and D. Salisbury. 2019. “Combating Nuclear Smuggling? Exploring Drivers and Challenges to Detecting Nuclear and Radiological Materials at Maritime Facilities.” Nonproliferation Review, 26 (1–2): 83–104. https://doi.org/10.1080/10736700.2019.1610256.
- Kanjir, U., H. Greidanus, and K. Oštir. 2018. “Vessel Detection and Classification from Spaceborne Optical Images: A Literature Survey.” Remote Sensing of Environment 207:1–26. https://doi.org/10.1016/j.rse.2017.12.033. Mar.
- Kelbe, D. D. White K. Page A. Safi Hardin, and A. Rose. 2017. “Employing Spaceborne Multispectral Stereo Pairs and Pedestrian Flow Modeling to Support Disaster Response Activities in Urban Environments.” In 2017 IEEE International Geoscience and Remote Sensing Symposium (IGARSS), 2573–2576. Fort Worth, TX: IEEE, JulY. https://doi.org/10.1109/IGARSS.2017.8127521.
- Liu, Z., H. Wang, L. Weng, and Y. Yang. 2016. “Ship Rotated Bounding Box Space for Ship Extraction from High-Resolution Optical Satellite Images with Complex Backgrounds.” IEEE Geoscience and Remote Sensing Letters, 13 (8): 1074–1078. https://doi.org/10.1109/LGRS.2016.2565705.
- McCarthy, M. J., D. B. Otis, D. Hughes, and F. E. Muller-Karger. 2022. “Automated High-Resolution Satellite-Derived Coastal Bathymetry Mapping.” Journal of Applied Earth Observation and Geoinformation 107:102693. https://doi.org/10.1016/j.jag.2022.102693.
- Pacifici, F. 2016. “On the Predictive Value of the WorldView3 VNIR and SWIR Spectral Bands.” In 2016 IEEE International Geoscience and Remote Sensing Symposium (IGARSS), 898–901, Beijing, China: IEEE, July. https://doi.org/10.1109/IGARSS.2016.7729227.
- Page, David, Kelbe, Dave, MacIntyre, Lawrence, Craig, Chris, Nichols, Jeff, Hardin, Andrew, White, Devin, et al. 2017. “Towards Automated High-Throughput 3D Surface Generation for High Resolution Satellite Imagery.” Presented at the ASPRS Annual Conference: IGTF 2017, Baltimore, Maryland, USA, March.
- Shao, J., Q. Yang, C. Luo, R. Li, Y. Zhou, and F. Zhang. 2021. “Vessel Detection from Nighttime Remote Sensing Imagery Based on Deep Learning.” IEEE Journal of Selected Topics in Applied Earth Observations and Remote Sensing 14:12536–12544. https://doi.org/10.1109/JSTARS.2021.3125834.
- Smiley, B. 2011. “Geolocation Accuracy Topics Relevant to DigitalGlobe’s Satellite Constellation.” Presented at the 10thAnnual Joint Agency Commercial Imagery Evaluation (JACIE) Workshop, Boulder, CO, USA, March.
- Updike, T., and C. Comp. 2010. Radiometric Use of WorldView-2 Imagery. Digital Globe. https://dg-cms-uploads-production.s3.amazonaws.com/uploads/document/file/104/Radiometric_Use_of_WorldView-2_Imagery.pdf.
- ”’WorldView-2,’ DigitalGlobe, Data Sheet.” 2016. [Online]. https://dg-cms-uploads-production.s3.amazonaws.com/uploads/document/file/98/WorldView2-DS-WV2-rev2.pdf
- “WorldView-3.” 2013. DigitalGlobe, Data Sheet. [Online]. http://content.satimagingcorp.com.s3.amazonaws.com/static/satellite-sensor-specification/WorldView-3-PDF-Download.pdf