
ABSTRACT
Cyclists constitute a population particularly exposed to atmospheric and noise pollution in urban environments; at the same time, they contribute to its reduction. For about ten years now, more and more studies have been completed to assess cyclists’ exposure, comparing this mode of transportation with others, quantifying its impacts in term of individual and collective health, understanding cyclists’ perceptions regarding their exposure, etc. Though some literature reviews have examined some of these specific issues, none have yet proposed a general overview of this field of study. Therefore, this mapping literature review fills this gap by jointly analysing 205 articles and identifying elements of consensus and disagreement, as well as existing gaps. Among others, our results indicate that the cities in the South and exposure to noise are under-studied and that cyclists’ ventilation is still too rarely accounted for, regardless of the type of studies. Modelling studies regarding exposure are too heterogeneous methodologically to allow a generalisation of their results. Conversely, intermodal comparison studies clearly indicate overexposure for cyclists compared to other modes. Also, health studies conclude that, either individually or collectively, the benefits of cycling surpass the costs of exposure to atmospheric pollution. The knowledge produced by this research trend remains difficult to exploit by urban planners, but the recent work done seems to offer more practical perspectives to professionals.
Introduction
The bicycle has experienced a rebirth since the beginning of the twenty-first century in many Northern cities (Pucher, Buehler, & Seinen, Citation2011). This rebirth is partly explained by its benefits to physical and mental health, its ecological nature, revitalisation of city centres, and growing congestion in the cities. More recently, the COVID 19 pandemic has significantly impacted urban transport systems and researchers suggest that bicycle modal share has increased (Huang et al., Citation2020). Today, the bicycle is considered by planners to be a sustainable mode of transportation with net benefits for society (Gössling & Choi, Citation2015). In many cities of the global South, despite increasing motorisation, the bicycle remains a significant mode of transportation due to its flexibility and its accessibility (Oke, Bhalla, Love, & Siddiqui, Citation2015). However, due to their direct proximity with traffic and increased ventilation, cyclists are directly exposed to this pollution though they do not generate it. Combined with a broad domination of the vehicle in traffic spaces in most parts of cities worldwide, this generates a blatant situation of injustice in transportation (Gössling, Citation2016). Parallel to this, the development of low-cost sensors in the last decade generated a real paradigm shift in studying these types of pollution (Snyder et al., Citation2013). This opened up new fields of studies on cyclists’ exposure by contributing data at finer spatial and temporal scales than traditional networks using static monitoring stations are capable of producing.
In this context, it is not surprising to see that a field of research on cyclists’ exposure to atmospheric and noise pollution was developed. It should be mentioned that literature reviews already exist on specific research topics such as the comparison of levels of exposure according to mode of transportation (Cepeda et al., Citation2017; de Nazelle, Bode, & Orjuela, Citation2017), the impacts of bicycling on health (Knibbs, Cole-Hunter, & Morawska, Citation2011; Mueller et al., Citation2015), or even the inhaled doses of pollutants by cyclists (Bigazzi & Figliozzi, Citation2014). Considering the diversity of research on cyclists’ exposure, a systematic review discussing the different lines of research is necessary for the intersection of their contributions, and to put into perspective the consolidated knowledge and remaining gaps. This information is essential to orient upcoming research studies and the practice of professionals in development and transportation. To this effect, we propose this mapping literature review (Grant & Booth, Citation2009). Only air and noise pollution exposures are considered here because of their known relationships and because they are often analysed with similar conceptual frameworks and methods. Risk of accident is also an important concern, but is less directly linked to the two other exposures, is already extensively studied, and many literature reviews are available.
Review methodology
The issue of cyclists’ exposure to atmospheric and noise pollution is at the intersection of many domains (particularly transportation, health, environment, urban planning). We have excluded articles in the fields of physics, chemistry, and engineering, and only English publications published before 1 January 2021 in peer-reviewed scientific journals were retained. They were extracted from four databases. The first two, Web of Science and Scopus, are multidisciplinary. GreenFile (EBSCO) identifies studies on the relationship between the human being and the environment. Transport Research International Document (TRID), as its name indicates, specialises in research on transportation. The search query utilised for the four databases is the following: ((POLLUT* OR NOISE) AND (CYCLI* OR BIKE OR BICYC*) AND EXPOSURE), applied to titles, summaries, and key words.
After removing duplicates, we screened the papers during two sorting phases (the first on titles, the second on summaries) and included the encountered relevant references to the corpus for a total of 205 articles (see Supplementary material S1).
Results
In a first section, we identify six trends of studies among the articles selected. In a second section, we present the evolution of these studies in terms of both time and space. In the third section, we provide detail for the pollutants studied and the collection methods used. Finally, the last section reviews in details each of the six groups separately.
Classification of the studies identified according to six trends
We compiled the articles identified according to six main research questions:
What are cyclists’ levels of exposure to atmospheric and/or noise pollution? (entitled observation studies, 34 articles)
How do these levels of exposure vary according to the transportation mode utilised? (comparison studies, 56 articles)
What factors contribute to an increase or a decrease of these levels of exposure? (modelling studies, 35 articles)
What are the impacts of these exposures on cyclists’ health? (health studies, 52 articles)
To what extent could cyclists’ exposure be reduced? (planning studies, 16 articles)
What are cyclists’ perceptions, behaviours, and strategies toward these pollutants? (perception studies, 21 articles)
The studies intersecting different questions were duplicated in their respective categories.
Spatio-temporal evolution
Two main periods
We distinguish two periods in the development of studies on cyclists’ exposure: the phase of pioneer studies (2001–2011), followed by a phase of diversification (2012-present) (a). The first phase includes 36 articles mainly about European cities (b) and is dominated by intermodal comparison studies and health impact assessments. The second period (2012–2020) consisting of 169 articles is characterised by a diversification of research questions and fields of study.
Figure 1. Temporal evolution of type and location of the selected studies.
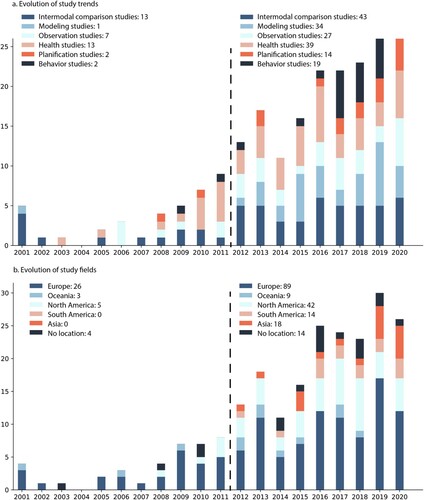
A high concentration in the cities of the North
The majority of the studies were carried out in cities of the global North (), a finding shared by several literature reviews on the subject (Cepeda et al., Citation2017; Kaur, Nieuwenhuijsen, & Colvile, Citation2007; Mueller et al., Citation2015; Raza, Forsberg, Johansson, & Sommar, Citation2018). We reiterate that we have selected solely articles in English, which certainly contributes to this imbalance. Europe is by far the region that has been studied most extensively, particularly Belgium (n = 23) and the Netherlands (n = 20). This can most likely be explained by the high modal share of cycling in numerous Northern European cities, and by the implementation of surveillance policies and mitigation of atmospheric and noise pollution in the European Union. Some research teams also reused the same databases for different research, or simultaneously studied multiple cities, which increases this concentration.
Figure 2. Map of the selected studies.
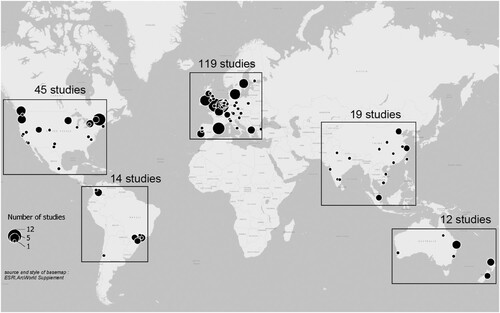
The small number of studies in the cities of the Global South is paradoxical considering that the levels of noise and atmospheric pollution are regularly much higher than those observed in the cities of the North, and that an appreciable part of the population uses active modes of transportation because of economic constraint and not by choice. A few recent studies were led in Asia (especially China and India) and in South America (Columbia and Brazil); Africa, Indonesia, but also Japan remain forgotten territories in this field of research.
Pollutants considered: domination of particulate pollutants and low consideration of noise
Particulate pollutants are by far the ones most intensively studied (): PM10 (n = 46), PM2.5 (n = 93), UFP (n = 42), PNC (n = 24) and Black Carbon (BC or soot, n = 59). The gas pollutants more intensively studied are respectively carbon oxides (CO2, n = 6; CO, n = 27) and nitrogen oxides (NO2, n = 28; NOx, n = 10). The Volatile Organic Compounds (VOCs, n = 17) are also often studied, but group together an exceptionally large number of different molecules. This distribution of pollutant studies is similar to that reported by Bigazzi and Figliozzi (Citation2014) in a literature review on cyclists’ inhalation of atmospheric pollution.
Table 1. Considered pollutants.
Three reasons can explain the marked dominance of particulate pollutant studies. These pollutants were measured starting with the first studies on cyclists’ exposure, thus establishing a path dependence. Furthermore, particulate pollutants and more specifically particulates with smaller diameters (<1 μm) have significant impacts on health (Anderson, Thundiyil, & Stolbach, Citation2012). Finally, road traffic is one of the main particulate emitters through combustion (fine particulates), break and tire abrasion, and dust resuspension (coarse particulates). They are therefore extensively used to represent cyclists’ exposure to atmospheric pollution produced by road traffic.
Multiple exposure
Interestingly, only 24 studies considered noise exposure. Among these, 17 also include atmospheric pollution. This shows that cyclists’ exposure to noise and their multiple exposure are understudied. This is probably because cyclists’ physical effort and ventilation act as multipliers in their exposure to atmospheric pollutants, which is not the case for noise. Add to this the increased complexity of the collection and structuring of data due to the addition of supplementary measuring equipment.
The degree of correlation observed between cyclists’ exposure to noise and atmospheric pollutants varies according to the pollutants measured and the temporal and spatial aggregation of data. The majority of studies report low correlations (<0.25) (Apparicio, Carrier, Gelb, Séguin, & Kingham, Citation2016; Boogaard, Borgman, Kamminga, & Hoek, Citation2009; Gelb & Apparicio, Citation2020; Liu et al., Citation2019; Minet et al., Citation2018b; Okokon et al., Citation2017) and in more rare cases, average correlations (<0.6) (Boogaard et al., Citation2009; Liu et al., Citation2019; Okokon et al., Citation2017). Beyond these simple correlations, a series of studies (Dekoninck et al., Citation2015b; Dekoninck, Botteldooren, & Int Panis, Citation2013, Citation2015a) proposed to model cyclists’ exposure to BC with their exposure to noise and used very detailed data (one second resolution and spectral noise measurement). More particularly, the authors suggest that the low frequencies in the sound spectrum are more correlated with the concentration of BC and would therefore reflect part of the environmental noise produced by road traffic. This finding suggests that cyclists’ exposure to noise and atmospheric pollution are two related issues, but one cannot summarise the other.
Ventilation still poorly considered
Due to their physical activity, cyclists have a higher average ventilation than users of motorised transportation modes, inducing superior inhalations of atmospheric pollutants (Int Panis et al., Citation2010). Ventilation is therefore a key parameter where there is an interest in cyclists’ exposure. When ventilation is not considered, cyclists’ exposure is systematically underestimated in comparison with other transport modes and the effect of other parameters increasing the physical activity (like slope, travel speed, wind, etc.) are hidden.
Among the studies measuring exposure to atmospheric pollution, only 59 include ventilation and inhalation of atmospheric pollution in their analysis. Furthermore, 30 of them simply use fixed averages for ventilation (recommended by health agencies such as the EPA or other studies), 19 model it with another measure of physical activity (heart rate, metabolic equivalent of task, speed, acceleration) and only 10 measure it directly with biometric t-shirts or mobile spiroergometric devices, most of them being health studies concerned about individual short-term response to air pollution exposure. Note here that a study compared five methods to estimate intake dose of traffic-related air pollution (Dons et al., Citation2017) and indicated high correlations between them. Despite the central role it plays regarding cyclists’ exposure, ventilation still remains inadequately integrated in these studies. This finding is also shared by Bigazzi and Figliozzi (Citation2014) and Cepeda et al. (Citation2017).
Data collection: extensive versus intensive
The studies including primary data collection are part of the change in the current paradigm of measuring pollution (Snyder et al., Citation2013). Exposure data are collected in movement with the help of portable sensors, unlike traditional approaches using fixed measurement stations. This approach allows to capture the spatial and temporal finer variation in cyclists’ exposure, contrary to fixed stations which tend to underestimate exposure for individuals (Cole-Hunter, Morawska, Stewart, Jayaratne, & Solomon, Citation2012; Krecl et al., Citation2019; Van den Bossche et al., Citation2015).
Two data collection approaches clearly stand out. The first (n = 94) is characterised by the repetition of measurement on predetermined routes. It mainly aims to meet four objectives: compare the levels of exposure for similar routes according to mode of transportation; compare the levels of exposure for different routes with the same origins and destinations; compare the levels of exposure and potential impacts on health between routes with minimal and maximal exposure to road traffic; estimate the average levels of exposure on specific segments.
This intensive approach is interesting since the replication of measures on the same route allows us to quantify the variability of measures of exposure. The high variability observed can be explained by the use of portable sensors that are less precise than the reference stations and by one-time events that may affect exposure values (passing of a heavy goods vehicle, car horn, swirling up of dust, etc.). The issue of the number of repetitions necessary on an axis to have a representative sampling was the object of two articles (Anowar, Eluru, & Hatzopoulou, Citation2017; Van den Bossche et al., Citation2015) that come to similar conclusions (approximately 17 passages).
The second approach (n = 35) leaves the participants totally free to move or imposes diversified itineraries to maximise spatial coverage and the diversity of the urban environment. Compared to the intensive approach, it generates data with a higher variability but allows for a better potential of city-wide generalisation (if the coverage of the collection is extensive and dense). Locally, the small number of repetitions on a same axis does not allow for defining a typical exposure value for a street segment. However, the extensive approach proposes an indirect form of replications: the multiplication of sample routes necessarily involves taking measures in similar environments and allows for the stabilisation of the parameters being studied. It is not surprising that the extensive collection method is more often used for modelling studies, whereas health and comparison studies regarding exposure according to mode of transportation mainly use the intensive approach. These two approaches are therefore complementary as they do not meet the same objectives.
Detailed analysis of six trends
Observation studies, a descriptive backdrop
Observation studies measure exposure for a few cyclists for a restricted number of routes and limited to a descriptive analysis. Often, these papers constitute test cases for new mobile monitoring stations developed by research teams (Elen et al., Citation2013; Kaur et al., Citation2006; Mead et al., Citation2013). This description can mobilise a spatial analysis, in particular with the mapping of values for the pollution measured; a temporal analysis comparing different times of day, days of the week or seasons, or even establishing a relationship with other parameters such as wind speed and its direction, the use of alternate routes and the proximity of road traffic (Berghmans et al., Citation2009; Cole-Hunter et al., Citation2012; Lonati, Ozgen, Ripamonti, & Signorini, Citation2017; Targino et al., Citation2016). Since these different parameters are not considered simultaneously, the conclusions that can be drawn from these studies are limited, their main interest being to provide information on cyclists’ typical exposure values in different cities.
Intermodal comparison studies, heterogeneity of the exposure, and the importance of ventilation
These studies aim to compare cyclists’ levels of exposure to atmospheric and noise pollution to that of other modes of transportation. There are already three literature reviews specifically addressing intermodal comparison studies (Cepeda et al., Citation2017; de Nazelle et al., Citation2017; Kaur et al., Citation2007). However, they only address atmospheric pollution. We shall detail their results before presenting complementary elements, thus avoiding any repetitions.
Cepeda et al. (Citation2017) present a review of 39 articles. By calculating the exposure ratios according to transportation mode, they found that in the majority of cases, drivers are more exposed to all the atmospheric pollutants than those using active modes of transportation (+22% according to the median ratio). Those who use active modes of transportation would be less exposed because they are farther away from the centre of the road – where the concentration of pollutants is the highest– and they are not enclosed in a compartment. The authors noted significant differences according to the pollutants measured, which led to a strong heterogeneity of the ratios calculated. Added to this, Kaur et al. (Citation2007) already noted the inter-mode air pollution exposure variations but also stressed the important intra-mode variations caused by many factors such as geographical location, meteorological conditions, or traffic parameters. When inhalation (present in only 12 of 39 studies) and the length of travel are taken in account, it is quite clear that those who use active modes of transportation absorb more pollutants than others. For the same route, the dose of atmospheric pollutants inhaled by a driver would be equivalent to only 22% (median ratio) than those inhaled by users of active transportation.
The review by de Nazelle et al. (Citation2017) is a meta-analysis including only 10 articles solely for European cities. In most of these studies, the differences in intermodal exposure are insignificant (p > 0.05); however, inhalation was not considered in this meta-analysis. One last interesting result put forward by de Nazelle et al. (Citation2017) is the deviation between the values observed by fixed stations (measuring background pollution) and portable sensors (measuring individual exposure), which was also noted by Kaur et al. (Citation2007). The levels of direct exposure for cyclists were close to twice as much as the levels of background concentrations for PM2.5 and UFPs, three times higher for BC, and more than four times higher for CO. This finding highlights the relevance of using portable sensors to estimate cyclists’ exposure.
Our own findings are along the same lines as these three reviews. Of the 56 articles retained, we have extracted the average exposure values (or medians depending on available values) from the different atmospheric pollutants. Then, we calculated the ratio between exposure for cyclists and drivers for each article. Thus, we obtain 105 ratios where the average is 1.41, the median 1.01, and the interquartile interval 0.88. We therefore share the findings of Cepeda et al. (Citation2017), de Nazelle et al. (Citation2017) and Kaur et al. (Citation2007): on average, cyclists seem less exposed to atmospheric pollutants but the high variability between the studies moderates the finding.
For the average levels of inhalation, we noted 76 comparisons between drivers / cyclists. We obtain much more significant differences disadvantaging cyclists with an average of 0.47, a median of 0.21, and an interquartile interval of 0.27. It must be noted that the median is close to the value first reported by Cepeda et al. (Citation2017), indicating that cyclists would absorb 5 times as much atmospheric pollutants than drivers. Likewise, we noted a lower heterogeneity for inhalation results (interquartile interval of ratios 0.88 vs 0.27), which once again highlights the essential role of ventilation.
Only seven intermodal comparison studies – cyclists versus drivers – accounted for the levels of exposure to noise (Apparicio, Gelb, Carrier, Mathieu, & Kingham, Citation2018; Boogaard et al., Citation2009; Kraus et al., Citation2015; Liu et al., Citation2019; Okokon et al., Citation2017; Vouitsis, Taimisto, Kelessis, & Samaras, Citation2014; Yao, Ma, Cushing, & Lin, Citation2017). Note that Boogaard et al. (Citation2009) does not report on the descriptive statistics for the levels of exposure to noise for cyclists and drivers, and that Okokon et al. (Citation2017) does not report on the data for exposure to noise for drivers in Rotterdam. Thus, we dispose of only seven drivers-cyclists comparisons for noise, that is, Montréal, Helsinki, Thessaloniki (2 values), Toronto, Chengdu, and Augsburg with respective differences of 1.92, 6.0, 4.0, 4.2, 14.2, 8.5 and 1.5 dB(A) each time to the detriment of cyclists. These deviations are far from being insignificant but because of the low number of studies completed, it is difficult to say that this situation is systematic in the urban environment.
Modelling study: a heterogeneous research axis under development
The third study group (n = 35) aims to identify which factors significantly impact cyclists’ levels of exposure, the scale of their effects, and potentially the practices to be implemented to reduce these levels of exposure. Regression techniques are the most often used, especially classic linear regressions (n = 20). Only a few articles stand out by employing more advanced methods such as:
Spatial regressions (spatial-lag) to account for spatial autocorrelation (Apparicio et al., Citation2016);
Mixed effects regressions (GLMM) to account for the pseudo-replication induced by group effects (Gelb & Apparicio, Citation2019; Hatzopoulou et al., Citation2013b; Pattinson, Kingham, Longley, & Salmond, Citation2017; Zuurbier, Willems, Schaap, Van der Zee, & Hoek, Citation2019);
Generalised Additive Models, to include non linear relations between independent variables and the dependent variable (Dekoninck et al., Citation2013, Citation2015a; Gelb & Apparicio, Citation2019, Citation2020);
Machine Learning algorithms – Random Forest, Support Vector Regressions, neural networks, or the k-nearest neighbours – are also useful, and often compared with regression models. Considering the complexity and nonlinearity of relations between atmospheric and noise pollutants and the urban environment, these advanced methods (i.e. spatial regressions, GLMM, GAM, and Machine Learning) are worth more regularly integrating in studies.
The quality of the models’ adjustment varies greatly from one study to the next, particularly due to the diversity of the pollutants measured, the quantity of data collected, the temporal resolution, the collection method, and the eventual aggregation of data. We indicated the R2 values when these were available (47 values obtained). Although they do not allow comparison between models, they provide an idea of the scope of regression models’ capacities to predict cyclists’ exposure. For most of the studies, the R2 values vary between 0.23 and 0.69 (first and last deciles), including studies modelling noise. This indicates that the data collected on cyclists’ exposure includes a significant portion of potentially unexplainable variance, due to the high spatio-temporal variability of the phenomenon.
We also distinguish two groups of studies on the modelling of cyclists’ exposure. The first is inspired by Land Use Regression (LUR) (Hoek et al., Citation2008). As with LUR, which aim to predict and map concentrations of atmospheric pollutants using data collected from fixed stations, these studies aim to generate exposure mapping with data from mobile collections for a given territory, and therefore locate eventual exposure hotspots (Dekoninck, Botteldooren, & Int Panis, Citation2015a; Hankey & Marshall, Citation2015; Hong & Bae, Citation2012; Minet et al., Citation2018a; Targino et al., Citation2016; Van den Bossche, De Baets, Verwaeren, Botteldooren, & Theunis, Citation2018; Van den Hove, Verwaeren, Van den Bossche, Theunis, & De Baets, Citation2020). In other words, the first objective of these LUR based on mobile collections resides not so much in understanding the model as in the final mapping and prediction capacity of the model.
Contrary to this, a second study group adopts a more comprehensive approach to cyclists’ exposure and attaches a particular importance to the identification of factors contributing to significant decrease or increase of levels of exposure (Apparicio et al., Citation2016; Apparicio & Gelb, Citation2020; Brand et al., Citation2019; Gelb & Apparicio, Citation2019, Citation2020; Krecl et al., Citation2019; Pattinson et al., Citation2017; Qiu, Wang, Zheng, & Lv, Citation2019).
The predictive factors integrated in these studies can be split into six distinct categories. They are detailed below by frequency of utilisation; this order does not reflect the size of the effects of these different parameters.
Weather
Temperature, humidity, and wind speed are most often controlled, and more rarely precipitations, atmospheric pressure, and wind direction. The first two parameters are generally measured directly by portable pollution monitors that usually have sensors for temperature and humidity. The others are obtained from local weather services or through fixed stations. These measures are therefore not taken in real time but come from secondary data on temporal (hourly or half-hourly) or spatial scales that are much less precise.
One study also integrated sunshine in the prediction of BC but with no significant result (Merritt et al., Citation2019). Yet, considering the significant impact of UV radiations on the interactions between different gas pollutants, this parameter would be worth considering in a more systematic fashion. In almost all the studies, the meteorological parameters had a significant and appreciable impact on cyclists’ exposure to atmospheric pollutants. However, the significance and direction of these relations are uncertain, varying according to the pollutant and interactions with other variables (particularly temporal factors). As an example, concerning UFPs, many studies have found that an increase in temperature was associated with an increase of their concentration (Minet et al., Citation2018a; Pattinson et al., Citation2017), while others indicate a decrease (Farrell, Weichenthal, Goldberg, & Hatzopoulou, Citation2015; Hatzopoulou et al., Citation2013b). In the same vein, Qiu et al. (Citation2019) found a negative relationship between humidity and UFP concentration, whereas Farrell et al. (Citation2015) and Minet et al. (Citation2018b) found a positive relationship.
Wind direction is almost always insignificant in the models presented. Wind speed, on the other hand, is a parameter that provides more consensus: when it increases, the concentration of the different atmospheric pollutants decreases, whether they are gas or particles (Apparicio et al., Citation2016; Hatzopoulou et al., Citation2013b; Hong & Bae, Citation2012).
Considering the significance of these control factors for modelling atmospheric pollution, a study not integrating any weather parameters should necessarily be the object of a review.
Concerning exposure to noise, meteorological parameters seem to play a less significant role. (2018b) have reported a negative association between exposure levels to noise and wind speed, with a decrease of –0.371 dB(A) for each additional km/h, and no effect with temperature. On the other hand, Apparicio et al. (Citation2016) and Gelb and Apparicio (Citation2020) found no significant relationship between exposure to noise and temperature, humidity, and wind speed.
These meteorological variables should continue to be integrated in noise prediction models since they directly impact noise propagation in the air. However, the incapacity of the models to detect these impacts suggests that the size effects are limited.
Road traffic
The objective of the second group of variables is to describe road traffic, the main source exposure for cyclists. This is a difficult phenomenon to measure, being integrated into the models through indirect indicators. More often, it is the type of axis on which the measure is taken (Dons et al., Citation2013; Farrell et al., Citation2015; MacNaughton, Melly, Vallarino, Adamkiewicz, & Spengler, Citation2014). The underlying assumption is that major axes support a higher volume of vehicles than minor axes. However, the typology of the axes does not only reflect the effect of traffic but also that of the street’s morphology (width, street-canyon), which may make the interpretation of results difficult. Similarly, the typology of cycling infrastructure allows to distinguish between on-street and off-street infrastructure. Off-street infrastructure is farther away from road traffic where lower levels of exposure are generally observed. Note that from one study to the next, the diversity of street typologies represented complicates comparison of results. The collaborative mapping project OpenStreetMap constitutes an interesting opportunity to surpass this limit since it provides a road network that is relatively complete in numerous cities with a harmonised typology (Gelb & Apparicio, Citation2019, Citation2020).
Other studies utilise daily traffic volume estimations (Bigazzi & Figliozzi, Citation2015; MacNaughton et al., Citation2014; Minet et al., Citation2018a) or do direct counting of vehicles (particularly from videos of these routes) (Hatzopoulou et al., Citation2013b; Zuurbier et al., Citation2019). Direct counting of vehicles during cyclists’ journeys allows the capture of immediate impact of traffic on cyclists’ exposure (for each additional vehicle met), while estimations of daily traffic volume and types of streets capture a more systematic dimension of pollution (that is, accumulation in the case of atmospheric pollution). These two dimensions are complementary, and it would be advantageous to study them simultaneously. In all cases, road traffic is associated with a significant increase of exposure to atmospheric and noise pollution.
Temporal factors
Temporal factors group together variables describing the time of day (Apparicio et al., Citation2016; Brand et al., Citation2019; Dons et al., Citation2013), the day of the week (Gelb & Apparicio, Citation2019; Hofman, Samson, Joosen, Blust, & Lenaerts, Citation2018), or the season (Liu et al., Citation2019). In fact, atmospheric and noise pollution are closely related to the flow of activities and the weather variations that follow specific temporal patterns. Therefore, these are essentially important control variables. However, if mobile data collection provides the opportunity to obtain data on a precise spatial scale, they do not allow an efficient capture of the temporal dimension of atmospheric and noise pollution. Because they are done over short time periods, they do not allow the capture of daily and seasonal systematic variations, a task for which traditional networks of fixed measurement stations are more relevant.
Urban environment
The characteristics of the urban environment most often utilised are directly inherited from the LUR, more particularly the land use densities (residential, industrial, commercial, green spaces and parks, etc.) in a given radius surrounding sections sampled. Add to this the remoteness of equipment such as railways, major axes, bus stops, airports, ports, and industries, etc. The results of these studies are contradictory at times, which can be explained by the high number of variables multiplied by the different buffer sizes selected by step-wise regressions. Nonetheless, some general trends emerge: remoteness of polluting equipment (airport, plants, bus lines, railways, major roadways), density of green spaces and presence of vegetation, generally allowing for the reduction of exposure levels to atmospheric pollutants. Conversely, industrial and commercial sectors, as well as residential density, are associated with superior exposure levels (Hong & Bae, Citation2012; Minet et al., Citation2018a, Citation2018b; Van den Bossche et al., Citation2018).
On a more micro scale, many studies also integrate characteristics relative to the street’s configuration, such as density of buildings (Apparicio et al., Citation2016), street-canyon (Dekoninck et al., Citation2013; Gelb & Apparicio, Citation2020; Krecl et al., Citation2019; Van den Bossche et al., Citation2018), number of intersections (Apparicio et al., Citation2016; MacNaughton et al., Citation2014), presence of vegetation (MacNaughton et al., Citation2014), and slope (Gelb & Apparicio, Citation2019). However, we still do not have enough cases of application to come to a consensus.
Background pollution
Background pollution corresponds to the regional levels of concentration of atmospheric and noise pollution. It varies in time and space and adds to local pollution to the extent cyclists are exposed. Controlling background pollution is essential in studying the local variation of cyclists’ exposure. To do so, some authors propose the use of data from fixed stations. These data can be included as control variables in the models constructed (Bigazzi & Figliozzi, Citation2015; Hofman et al., Citation2018; Krecl et al., Citation2019; MacNaughton et al., Citation2014; Merritt et al., Citation2019). Another approach consists of calculating a data correction factor for individual exposure based on background concentration values upstream of the analysis (Dekoninck et al., Citation2013; Dons et al., Citation2013; Hankey & Marshall, Citation2015; Hong & Bae, Citation2012). The addition of temporal and spatial factors in the models is also an indirect way of controlling the effect of background pollution without having recourse to data from fixed stations. If the temporal dimension is often integrated (see preceding section), accounting for the spatial dimension of background pollution is rare (Adams, Yiannakoulias, & Kanaroglou, Citation2016; Apparicio & Gelb, Citation2020; Dons et al., Citation2013; Gelb & Apparicio, Citation2019, Citation2020; Liu et al., Citation2019).
Pseudo-replication
Surprisingly, most studies do not consider the problem of pseudo-replication. Nevertheless, three autocorrelation sources characterise the mobile data collected on cyclists’ exposure to atmospheric and noise pollution: temporal (Gelb & Apparicio, Citation2019, Citation2020), spatial (Adams et al., Citation2016; Apparicio et al., Citation2016; Gelb & Apparicio, Citation2020), and group effects (Farrell et al., Citation2016; Hatzopoulou et al., Citation2013b; Liu et al., Citation2019; Zuurbier et al., Citation2019) autocorrelations. For the first, it is evident that two successive measures of a cyclist’s exposure have more of a chance of being similar than two measures taken randomly in time, which can be directly transposed for space. Finally, the plurality of sensors, participants, collection days, and cities in the same study are as many factors generating group effects. In fact, two measures from the same sensor, on the same day or in the same city, have more chances of being similar than two measures taken randomly. When these effects are not accounted for, the outcomes of the models (values of parameters and degree of significance) are potentially biased. These elements should be taken into account systematically in modelling studies, especially considering the array of methods available to limit their effects.
Modelling studies constitute a disparate group within which it remains difficult to reach elements of consensus. However, they provide interesting perspectives about development due to their capacity in identifying urban environmental factors having a significant influence on cyclists’ exposure, or again to map out this exposure.
Health studies, health assessment versus acute response to exposure
The utilisation of active modes of transportation such as cycling has a positive impact on the health of individuals (Kelly et al., Citation2014). Due to the risk of accidents and the effects of exposure to atmospheric and noise pollutants on health, many authors attempt to verify if the benefits of cycling surpass the risks incurred or not. To answer this question, two main types of approaches were developed: the Health Impact Assessment studies and the Response to Short Term Exposure studies.
Health impact assessment studies
The first study group (n = 19) is based on a macro approach with secondary data (modal share, average levels of exposure, relative risks to different exposures, etc.). For a given population or scenario, they propose the estimation of the net impacts of cycling in terms of mortality and morbidity, taking into consideration cyclists’ exposure to atmospheric pollutants, road accidents, and their physical activity, but also global benefits like reduced congestion, GES emissions, or noise and air pollution reduction at the city level. Mueller et al. (Citation2015), De Nazelle et al. (Citation2011) and Hartog, Boogaard, Nijland, and Hoek (Citation2010) proposed three literature reviews on the matter. More particularly, they conclude that most of the cities studied are in Northern countries (Australia, Europe, New-Zealand, North America) and that, in these contexts, the benefits of physical activity always largely surpass the risks associated with collisions and atmospheric pollutants, no matter what methodological choices are made. However, if the health benefits outweigh the risks at the population and individual levels, people shifting from motorised transport modes to active ones carry most of the burden of increased exposure to traffic risk, air pollution, and noise. Again, PM2.5 is the most studied pollutant while exposure to noise is generally overlooked. It is very unlikely that the addition of the effects of exposure to noise would offset the results of these studies, but it could certainly contribute to a slight reduction of the benefits of the physical activity. Our own findings largely confirm these conclusions.
Still considering fine particles, it is interesting to mention the conclusions of Tainio et al. (Citation2016), who proposed the generalisation of these results on a global scale (1600 cities) with data from the WHO’s annual levels of PM2.5 concentration. The benefits of the physical activity would only be offset by the risks associated to atmospheric pollutants after 90 min of cycling with PM2.5 levels of concentration of 100 µg/m3. Such levels are reached by only about 1% of the cities listed in the database, most of them being large Southern cities such as Delhi, Kânpur (India), and Xingtai (China).
Response to short term exposure studies
The second study group (n = 31) is interested in cyclists’ short-term physiological response to exposure to or inhalation of fine (PM10, PM2.5) and ultrafine particles in Europe, Australia, and Canada. We can distinguish two sub-groups, the first one studies cyclists’ exposure in real conditions, and the second one in a controlled environment. The design of the first group is always essentially the same: a small number of participants is recruited to cycle on two predetermined routes. One of these routes aims to minimise cyclists’ exposure to traffic (Low Exposure Route – LER), and the second, to maximise it (High Exposure Route – HER). A set of health indicators are measured before and up to 6 h after exposure to detect delayed effect (Strak et al., Citation2010; Zuurbier et al., Citation2011b). The parameters studied are indicators of pulmonary functions (Cole, Carlsten, Koehle, & Brauer, Citation2018; Park, Gilbreath, & Barakatt, Citation2017), markers of inflammation and stress (Cole et al., Citation2018; Zuurbier et al., Citation2011a), and more rarely, indicators of cardiac functions (Buregeya, Apparicio, & Gelb, Citation2020; Weichenthal et al., Citation2011). If, for each study, the LER levels are significantly lower that those of HER, the effects on health are very inconsistent, a finding shared by Knibbs et al. (Citation2011). The models (control over the effect for participants, weather, background pollution, and actual levels of exposure) include only a few significant parameters, although the direction of the relationships seems to indicate a negative impact on health for short-term overexposure. It is interesting to note that for these studies, the levels of exposure, even for HER, were low compared to what was observed in the studies mentioned in the previous sections, maybe explaining these small effects. The second group has a similar design: a limited number of participants are exposed to controlled levels of air pollution (most of the time diesel exhaust) or filtered air during moderate to high exercise levels on a cycle ergometer. The health indictors are measured before and after the trials, and compared with paired t-test or GLMM to control within subject variability. Again, the results are mixed, and researchers suggest that complex interactions between physical activity, sympathetic response to air pollution, and mixture of pollutants explain this uncertainty (Giles, Brandenburg, Carlsten, & Koehle, Citation2014; Koch et al., Citation2020; Madden et al., Citation2014).
Again, exposure to noise is rarely studied (Buregeya et al., Citation2020) and so, this is also the case for the combined effects of these exposures to noise and atmospheric pollutants on cyclists’ health. Therefore, it would seem relevant to conduct this type of study in cities where levels of exposure are higher and cycling practices are widespread, such as large Indian cities.
New developments
The last two study groups correspond to the development of new research questions.
Study of itineraries, how to orient cyclists and reduce their exposure
Among the studies of the preceding groups, few of them brought operational elements to orient the practice of planning cycling networks. This gap should be linked to the words of Koglin and Rye (Citation2014), exposing that the theoretical bases for the planning of bike paths are not extensively developed compared to that for motorised vehicles. Many studies (n = 12) propose studying the actual and potential itineraries for cyclists in the city in order to reduce their exposure. Hertel, Hvidberg, Ketzel, Storm, and Stausgaard (Citation2008)’s initial idea is quite simple. By estimating the concentrations of many atmospheric pollutants on different segments of the road and bicycle network in a city, it is possible to calculate a travel cost on these segments representing approximately the quantity of atmospheric pollutants inhaled. Based on these data, Hertel et al. (Citation2008) proposed a comparison between fictional itineraries minimising time on the route (MTP) and those minimising the dose of atmospheric pollutants cumulated (MDC). This first study on the city of Copenhagen found the average difference of 15% for the accumulated doses of MTP and MDC. This approach has been reproduced and enhanced. Thus, Ribeiro and Mendes (Citation2013) included exposure to noise, Hatzopoulou et al. (Citation2013a) used trips from an origin-destination survey. Wang, Dirks, Ehrgott, Pearce, and Cheung (Citation2018) used a shortest path algorithm with dual objective, aiming to minimise both the time needed for the trip and the dose of pollutants accumulated, leading to multiple solutions and allowing for a final arbitration. Gimenez-Gaydou, dos Santos, Mendes, Frade, and Ribeiro (Citation2019) proposed a more detailed method introducing in their estimation cyclists’ exposure to atmospheric pollutants, ventilation, and the physical effort induced by different routes. As an aside, let us mention the work of Doorley, Pakrashi, Szeto, and Ghosh (Citation2019), exclusively theoretical, proposing a mathematical model to identify the axes on the road network where the installation of a cycling structure would maximise the societal benefits (cost of transportation, of the infrastructure, of health, environmental risks and impacts). This research has two main benefits. First of all, increasing cyclists’ awareness about their exposures and the alternatives available to them to minimise that exposure. Among others, this is often done with the creation of web applications (Hatzopoulou et al., Citation2013a; Su, Winters, Nunes, & Brauer, Citation2010). Second, the identification of axes to be prioritised or avoided by planners, with the perspective of developing a cycling network reducing exposure for these users. However, this work is not sufficiently advanced to fulfil this last function and should be integrated within a multidimensional framework, more particularly by including the connectivity needs of the cycling network, cyclists’ actual trips, safety, or once again noise exposure. The work of Tran et al. (Citation2020) is a step in that direction. They propose a bikeability index taking into account air quality (PM2.5, BC), accessibility (potential destinations), suitability (slope, infrastructure), and perceptibility (greenery, crowdedness, enclosure).
Perception studies and cyclists’ behaviours
The common objective of these studies (n = 21) is to evaluate cyclists’ perceptions of atmospheric and/or noise pollution, and understand how they impact their mobility practices (resorting to other modes, avoidance strategies, preferred routes, etc.). They are based on and add to a vast literature on preferences and perceptions of cyclists (Buehler & Dill, Citation2016).
Most of these articles use surveys and thus provide stated preferences rather than revealed preferences. The formers are easier to obtain since they do not require data collection apart from the survey. This constitutes a major asset considering the difficulty of data collection on cyclists’ exposure to atmospheric and noise pollution. However, these data are limited by the biases associated with the participants (e.g. sensitivity toward the topic, capacity to represent for themselves the options proposed, improper estimations). It should be mentioned that the study of Gossling, Humpe, Litman, and Metzler (Citation2019) is a interesting attempt using mixed approach (survey and semi-directed interview) to further interpretation of their results. A limited number of papers study revealed preferences and use databases provided by STRAVA (Sun, Moshfeghi, & Liu, Citation2017) or bike share systems (Morton, Citation2020).
In most of these studies, atmospheric pollution and noise do not seem to constitute a major obstacle to the use of the bicycle although a significant number of cyclists feel strongly exposed and state that they experience symptoms (such as respiratory track irritation and cough) after their travel (Tom, Lidia, & Colin, Citation2015; Ueberham, Schlink, Dijst, & Weiland, Citation2019). On the basis of a survey with 1402 cyclists in Vancouver (Canada), Winters, Davidson, Kao, and Teschke (Citation2011) discovered that distance from atmospheric and noise pollution constitutes a major motivator for cycling, and this applies to regular, frequent, or occasional cyclists.
A substantial number of cyclists state that they are ready to modify their itineraries to reduce their exposure (Anowar et al., Citation2017; Bigazzi & Gehrke, Citation2018; Dey, Anowar, Eluru, & Hatzopoulou, Citation2018; Gossling et al., Citation2019; Tom et al., Citation2015). The tendency to resort to detours varies depending on the gain expected regarding exposure and the sensitivity of the cyclists surveyed. As an example, Anowar et al. (Citation2017) reported that on average, their respondents (695 cyclists) stated they were ready to lengthen their trip by 4 min if this provided for a reduction in the average exposure to NO2 of 5 ppb (about 9.4 µg/m3).
This tendency to want to reduce their exposure to atmospheric and noise pollution was also observed by Bigazzi, Broach, and Dill (Citation2016) and Broach and Bigazzi (Citation2017) by using actual trips by cyclists. However, these authors also emphasise that cyclists’ preference for cycling infrastructure can also lead to an increase in their exposure. The preference for a bike lane on a main street could almost double the dose of inhaled pollutants during a trip compared to the alternative minimising this dose but with no cycling infrastructure.
The perceptions and mitigation strategies vary among cyclists and allow to distinguish between many user profiles. Being a woman, the level of education, and age would be factors associated with the degree of sensitivity to the issue of exposure and the tendency to adopt mitigation strategies (Bigazzi & Gehrke, Citation2018; Dey et al., Citation2018; Tom et al., Citation2015). The role of cyclists’ levels of experience is still uncertain. According to Anowar et al. (Citation2017), the less experienced cyclists would have more of a tendency to reduce their exposure. Conversely, according to Bigazzi and Gehrke (Citation2018) and Tom et al. (Citation2015), experienced cyclists would be more sensitive to the issue of air quality. Zhao et al. (Citation2018) suggest that during episodes of heavy pollution, some people (low – income individuals, women, those living in outlying areas) are more inclined to continue to use their bicycle compared to wealthier and more educated populations. The latter would be both sensitive to and more informed about issues of air quality and would have the additional resources to modify their transportation mode during episodes of pollution.
Finally, Ueberham et al. (Citation2019)’s study constitutes a unique case that is particularly interesting since it combines objective measures (sensors) and subjective measures (post-trip self-evaluation) for exposure to noise and fine particles for 66 cyclists. The authors conclude that 80% of participants under-estimate their exposure to fine particles and noise, and that no correlation seems to exist between cyclists’ perceptions and actual exposure to these two pollutants. These findings can be linked to the conclusion of Chaney et al. (Citation2019) indicating a mismatch between general public assumptions and reality regarding exposure to PM2.5 in different transport micro-environments.
Conclusion
This literature review provided a portrait of the field of research on cyclists’ exposure to atmospheric and noise pollution. We have identified six main subfields: the observation of cyclists’ exposure, the intermodal comparison of exposures, the modelling of the exposure, the impacts on health, planning of itineraries, and the perceptions about the exposures.
Four main gaps are common to these different subfields of research. First, the cities in the global South are clearly less studied than the cities of the global North. This constitutes an important issue since the levels of atmospheric and noise pollution are often high in these cities. The bicycle also remains a widely used transport mode, especially by a captive population (Joshi & Joseph, Citation2015). Finally, data collection on cyclists’ exposure also constitutes an opportunity for obtaining unprecedented information on the levels of exposure for individuals in cities where the networks for measuring atmospheric and noise pollution are still underdeveloped.
Secondly, exposure to noise is rarely studied. The few studies dealing with that lead to believe that cyclists’ exposure to noise is superior to that of other road users, with a low correlation for their exposure to atmospheric pollution. These elements highlight the importance of further studying cyclists’ exposure to noise.
Thirdly, exposure to gas pollutants (CO, CO2, NO, NO2, SO2, O3) is much less studied than exposure to particulate pollutants (PM2.5, PM10, UFP, BC). Also, the few studies that have measured many pollutants have shown that there is a limited correlation between them (Hatzopoulou et al., Citation2013a; Kingham, Longley, Salmond, Pattinson, & Shrestha, Citation2013). It would be appropriate to diversify the types of pollutants – and simultaneously measure gas and particulate pollutants – in order to analyse cyclists’ exposure in all its complexity.
Fourthly, accounting for inhalation is still marginal in this field of study. It is too often limited to a simple multiplication of the exposure by a fixed ventilation value, therefore ignoring the effects of slope, speed of travel, type of road surface, and physiology of the cyclists.
The different subfields of research are characterised by levels of maturity that vary greatly. Intermodal comparison studies therefore seem to be the main seminal work. This has already been the object of many systematic literature reviews (Cepeda et al., Citation2017; de Nazelle et al., Citation2017) and provides the following consensus: users of active modes of transportation systematically inhale more atmospheric pollutants than those that use motorised modes of transportation and this difference is far from negligible.
Modelling studies of cyclists’ exposure in the urban environment evaluate the role of different factors (temporal, weather, environmental, road traffic, cycling infrastructure, etc.). The types of models and their adjustment quality vary greatly. Also, it is surprising to see that there are few models accounting for pseudo-replication and non-linear relationships between dependent and independent variables. The results of these studies are very heterogeneous. This can certainly be explained by scaling the uncertainty through several parameters such as data collection method, pollutants measured, types of models utilised, and control variables integrated.
As for health studies, their high level of methodological standardisation provides for the emergence of consensus. Collectively (health impact assessment studies), the benefits related to physical activity resulting from cycling largely offset the costs induced by accidents and exposure to atmospheric pollution in terms of mortality and morbidity. Individually (short-term exposure studies), short-term impacts of exposure to atmospheric pollution on cyclists’ various physiological factors outdoors or in a controlled environment are generally extremely low and not very significant for healthy individuals. However, the question remains open for physiologically vulnerable persons (children, seniors, and those with asthma), and in highly polluted urban environments.
The subfield of research on itinerary planning is a recent attempt to operationalise the results obtained by previous studies. The central objective is to propose itineraries to minimise cyclists’ exposure. The results may be used, either by individuals (through online tools for itinerary planning), or by urban planners (to determine the best axes for the extension of a cycling network). However, planning assistance tools are still in their early stages since they do not integrate other dimensions such as connectivity to the cycling network, cyclists’ actual trips, safety, and noise exposure. Nonetheless, they constitute an interesting opportunity to establish the theoretical bases for the development of a cyclable network, something still currently lacking (Koglin & Rye, Citation2014).
Finally, the studies on cyclists’ perceptions and behaviours regarding these pollutants place the individual at the centre of the issue of exposure. If atmospheric pollution does not seem to be a major obstacle to cycling, it is negatively perceived by the majority of cyclists, who develop strategies to minimise their exposure (alternate routes, masks, etc.). However, the willingness to reduce their exposure conflicts with their preference for direct itineraries and cycling infrastructure that may sometimes lead to situations of overexposure. Behaviours and perceptions vary greatly among the cycling population, illustrating the heterogeneity of individual profiles, particularly for gender, age, level of aptitude, and confidence. Again, these studies have a direct interest in infrastructure practices since they provide us with information on the preferences of cyclists and the mechanisms involved in the choice of itineraries.
Supplementary_Material
Download MS Word (63.7 KB)Disclosure statement
No potential conflict of interest was reported by the author(s).
Additional information
Funding
References
- Adams, M. D., Yiannakoulias, N., & Kanaroglou, P. S. (2016). Air pollution exposure: An activity pattern approach for active transportation. Atmospheric Environment, 140, 52–59. doi:https://doi.org/10.1016/j.atmosenv.2016.05.055
- Anderson, J. O., Thundiyil, J. G., & Stolbach, A. (2012). Clearing the air: A review of the effects of particulate matter air pollution on human health. Journal of Medical Toxicology, 8(2), 166–175. doi:https://doi.org/10.1007/s13181-011-0203-1
- Anowar, S., Eluru, N., & Hatzopoulou, M. (2017). Quantifying the value of a clean ride: How far would you bicycle to avoid exposure to traffic-related air pollution? Transportation Research Part A: Policy and Practice, 105, 66–78. doi:https://doi.org/10.1016/j.tra.2017.08.017
- Apparicio, P., Carrier, M., Gelb, J., Séguin, A. M., & Kingham, S. (2016). Cyclists’ exposure to air pollution and road traffic noise in central city neighbourhoods of Montreal. Journal of Transport Geography, 57, 63–69. doi:https://doi.org/10.1016/j.jtrangeo.2016.09.014
- Apparicio, P., & Gelb, J. (2020). Cyclists’ exposure to road traffic noise: A comparison of three north American and European cities. Acoustics.
- Apparicio, P., Gelb, J., Carrier, M., Mathieu, MÈ, & Kingham, S. (2018). Exposure to noise and air pollution by mode of transportation during rush hours in Montreal. Journal of Transport Geography, 70, 182–192. doi:https://doi.org/10.1016/j.jtrangeo.2018.06.007
- Berghmans, P., Bleux, N., Panis, L. I., Mishra, V. K., Torfs, R., & Van Poppel, M. (2009). Exposure assessment of a cyclist to PM10 and ultrafine particles. Science of the Total Environment, 407(4), 1286–1298. doi:https://doi.org/10.1016/j.scitotenv.2008.10.041
- Bigazzi, A. Y., Broach, J., & Dill, J. (2016). Bicycle route preference and pollution inhalation dose: Comparing exposure and distance trade-offs. Journal of Transport & Health, 3(1), 107–113. doi:https://doi.org/10.1038/355595a0
- Bigazzi, A. Y., & Figliozzi, M. A. (2014). Review of urban bicyclists’ intake and uptake of traffic-related air pollution. Transport Reviews, 34(2), 221–245. doi:https://doi.org/10.1080/01441647.2014.897772
- Bigazzi, A. Y., & Figliozzi, M. A. (2015). Roadway determinants of bicyclist exposure to volatile organic compounds and carbon monoxide. Transportation Research Part D: Transport and Environment, 41(2), 13–23. doi:https://doi.org/10.1017/s0025727300055046
- Bigazzi, A. Y., & Gehrke, S. R. (2018). Joint consideration of energy expenditure, air quality, and safety by cyclists. Transportation Research Part F-Traffic Psychology and Behaviour, 58, 652–664. doi:https://doi.org/10.1016/j.trf.2018.07.005
- Boogaard, H., Borgman, F., Kamminga, J., & Hoek, G. (2009). Exposure to ultrafine and fine particles and noise during cycling and driving in 11 Dutch cities. Atmospheric Environment, 43(27), 4234–4242. doi:https://doi.org/10.1016/j.atmosenv.2009.05.035
- Brand, V. S., Kumar, P., Damascena, A. S., Pritchard, J. P., Geurs, K. T., & Andrade, M. d. F. (2019). Impact of route choice and period of the day on cyclists’ exposure to black carbon in London, Rotterdam and São paulo. Journal of Transport Geography, 76(3), 153–165. doi:https://doi.org/10.1016/j.jtrangeo.2019.03.007
- Broach, J., & Bigazzi, A. Y. (2017). Existence and use of low-pollution route options for observed bicycling trips. Transportation Research Record: Journal of the Transportation Research Board, 45(2662), 152–159. doi:https://doi.org/10.1136/jcp.45.6.528
- Buehler, R., & Dill, J. (2016). Bikeway networks: A review of effects on cycling. Transport Reviews, 36(1), 9–27. doi:https://doi.org/10.1080/01441647.2015.1069908
- Buregeya, J. M., Apparicio, P., & Gelb, J. (2020). Short-term impact of traffic-related particulate matter and noise exposure on cardiac function. International Journal of Environmental Research and Public Health, 17(4), 1220. doi:https://doi.org/10.3390/ijerph17041220
- Cepeda, M., Schoufour, J., Freak-Poli, R., Koolhaas, C. M., Dhana, K., Bramer, W. M., & Franco, O. H. (2017). Levels of ambient air pollution according to mode of transport: A systematic review. The Lancet Public Health, 2(1), e23–e34. doi:https://doi.org/10.1016/S2468-2667(16)30021-4
- Chaney, R. A., Montgomery, H. D., King, J. H., Hendrickson, N. R., Sloan, C. D., & Johnston, J. D. (2019). A comparison of perceived and measured commuter air pollution exposures. Journal of Environmental Health, 82(4), 8–14. <Go to ISI>://WOS:000491682700002.
- Cole-Hunter, T., Morawska, L., Stewart, I., Jayaratne, R., & Solomon, C. (2012). Inhaled particle counts on bicycle commute routes of low and high proximity to motorised traffic. Atmospheric Environment, 61, 197–203. doi:https://doi.org/10.1016/j.atmosenv.2012.06.041
- Cole, C. A., Carlsten, C., Koehle, M., & Brauer, M. (2018). Particulate matter exposure and health impacts of urban cyclists: A randomized crossover study. Environmental Health: A Global Access Science Source, 17(1), 78, Article 78. doi:https://doi.org/10.1186/s12940-018-0424-8
- Dekoninck, L., Botteldooren, D., & Int Panis, L. (2013). An instantaneous spatiotemporal model to predict a bicyclist’s black carbon exposure based on mobile noise measurements. Atmospheric Environment, 79, 623–631. doi:https://doi.org/10.1016/j.atmosenv.2013.06.054
- Dekoninck, L., Botteldooren, D., & Int Panis, L. (2015a). Using city-wide mobile noise assessments to estimate bicycle trip annual exposure to black carbon. Environment International, 83, 192–201. doi:https://doi.org/10.1016/j.envint.2015.07.001
- Dekoninck, L., Botteldooren, D., Int Panis, L., Hankey, S., Jain, G., Karthik, S., & Marshall, J. (2015b). Applicability of a noise-based model to estimate in-traffic exposure to black carbon and particle number concentrations in different cultures. Environment International, 74, 89–98. doi:https://doi.org/10.1016/j.envint.2014.10.002
- de Nazelle, A., Bode, O., & Orjuela, J. P. (2017). Comparison of air pollution exposures in active vs. passive travel modes in European cities: A quantitative review. Environment International, 99, 151–160. doi:https://doi.org/10.1016/j.envint.2016.12.023
- De Nazelle, A., Nieuwenhuijsen, M. J., Antó, J. M., Brauer, M., Briggs, D., Braun-Fahrlander, C., … Fruin, S. (2011). Improving health through policies that promote active travel: A review of evidence to support integrated health impact assessment. Environment International, 37(4), 766–777. doi:https://doi.org/10.1016/j.envint.2011.02.003
- Dey, B. K., Anowar, S., Eluru, N., & Hatzopoulou, M. (2018). Accommodating exogenous variable and decision rule heterogeneity in discrete choice models: Application to bicyclist route choice. PloS one, 13, doi:https://doi.org/10.1371/journal.pone.0208309
- Dons, E., Laeremans, M., Orjuela, J. P., Avila-Palencia, I., Carrasco-Turigas, G., Cole-Hunter, T., … Int Panis, L. (2017). Wearable sensors for personal monitoring and estimation of inhaled traffic-related air pollution: Evaluation of methods. Environmental Science & Technology, 51(3), 1859–1867. doi:https://doi.org/10.1021/acs.est.6b05782
- Dons, E., Temmerman, P., Van Poppel, M., Bellemans, T., Wets, G., & Int Panis, L. (2013). Street characteristics and traffic factors determining road users’ exposure to black carbon. Science of the Total Environment, 447, 72–79. doi:https://doi.org/10.1016/j.scitotenv.2012.12.076
- Doorley, R., Pakrashi, V., Szeto, W. Y., & Ghosh, B. (2019). Designing cycle networks to maximize health, environmental, and travel time impacts: An optimization-based approach. International Journal of Sustainable Transportation, 14(5), 361–374. doi:https://doi.org/10.1080/15568318.2018.1559899
- Elen, B., Peters, J., Van Poppel, M., Bleux, N., Theunis, J., Reggente, M., & Standaert, A. (2013). The aeroflex: A bicycle for mobile air quality measurements. Sensors, 13(1), 221-240. doi:https://doi.org/10.3390/s130100221
- Farrell, W., Weichenthal, S., Goldberg, M., & Hatzopoulou, M. (2015). Evaluating air pollution exposures across cycling infrastructure types: Implications for facility design. Journal of Transport and Land Use, 8(3), 131-149. doi:https://doi.org/10.1227/00006123-199204000-00009
- Farrell, W., Weichenthal, S., Goldberg, M., Valois, M.-F., Shekarrizfard, M., & Hatzopoulou, M. (2016). Near roadway air pollution across a spatially extensive road and cycling network. Environmental Pollution, 212, 498-507. doi:https://doi.org/10.1016/j.envpol.2016.02.041
- Gelb, J., & Apparicio, P. (2019). Noise exposure of cyclists in Ho Chi Minh City: A spatio-temporal analysis using non-linear models. Applied Acoustics, 148, 332-343. doi:https://doi.org/10.1016/j.apacoust.2018.12.031
- Gelb, J., & Apparicio, P. (2020). Modelling cyclists’ multi-exposure to air and noise pollution with low-cost sensors—the case of Paris. Atmosphere, 11(4), 422. doi:https://doi.org/10.3390/atmos11040422
- Giles, L. V., Brandenburg, J. P., Carlsten, C., & Koehle, M. S. (2014). Physiological responses to diesel exhaust exposure are modified by cycling intensity. Medicine and Science in Sports and Exercise, 46(10), 1999–2006. doi:https://doi.org/10.1249/MSS.0000000000000309
- Gimenez-Gaydou, D. A., dos Santos, A. C., Mendes, G., Frade, I., & Ribeiro, A. S. N. (2019). Energy consumption and pollutant exposure estimation for cyclist routes in urban areas. Transportation Research Part D-Transport and Environment, 72, 1–16. doi:https://doi.org/10.1016/j.trd.2019.04.005
- Gössling, S. (2016). Urban transport justice. Journal of Transport Geography, 54, 1–9. doi:https://doi.org/10.1016/j.jtrangeo.2016.05.002
- Gössling, S., & Choi, A. S. (2015). Transport transitions in Copenhagen: Comparing the cost of cars and bicycles. Ecological Economics, 113, 106–113. doi:https://doi.org/10.1016/j.ecolecon.2015.03.006
- Gossling, S., Humpe, A., Litman, T., & Metzler, D. (2019). Effects of perceived traffic risks, noise, and exhaust smells on bicyclist behaviour: An economic evaluation. Sustainability, 11(2), Article 408. doi:https://doi.org/10.3390/su11020408
- Grant, M. J., & Booth, A. (2009). A typology of reviews: An analysis of 14 review types and associated methodologies. Health Information & Libraries Journal, 26(2), 91–108. doi:https://doi.org/10.1111/j.1471-1842.2009.00848.x
- Hankey, S., & Marshall, J. D. (2015). Land use regression models of on-road particulate air pollution (particle number, black carbon, PM2.5, particle size) using mobile monitoring. Environmental Science & Technology, 49(15), 9194–9202. doi:https://doi.org/10.1021/acs.est.5b01209
- Hartog, J. J. d., Boogaard, H., Nijland, H., & Hoek, G. (2010). Do the health benefits of cycling outweigh the risks? Environmental Health Perspectives, 118(8), 1109–1116. doi:https://doi.org/10.1289/ehp.0901747
- Hatzopoulou, M., Weichenthal, S., Barreau, G., Goldberg, M., Farrell, W., Crouse, D., & Ross, N. (2013a). A web-based route planning tool to reduce cyclists’ exposures to traffic pollution: A case study in Montreal, Canada. Environmental Research, 123, 58–61. doi:https://doi.org/10.1016/j.envres.2013.03.004
- Hatzopoulou, M., Weichenthal, S., Dugum, H., Pickett, G., Miranda-Moreno, L., Kulka, R., … Goldberg, M. (2013b). The impact of traffic volume, composition, and road geometry on personal air pollution exposures among cyclists in Montreal, Canada. Journal of Exposure Science and Environmental Epidemiology, 23(1), 46–51. doi:https://doi.org/10.1038/jes.2012.85
- Hertel, O., Hvidberg, M., Ketzel, M., Storm, L., & Stausgaard, L. (2008). A proper choice of route significantly reduces air pollution exposure — a study on bicycle and bus trips in urban streets. Science of the Total Environment, 389(1), 58–70. doi:https://doi.org/10.1016/j.scitotenv.2007.08.058
- Hoek, G., Beelen, R., De Hoogh, K., Vienneau, D., Gulliver, J., Fischer, P., & Briggs, D. (2008). A review of land-use regression models to assess spatial variation of outdoor air pollution. Atmospheric Environment, 42(33), 7561–7578. doi:https://doi.org/10.1016/j.atmosenv.2008.05.057
- Hofman, J., Samson, R., Joosen, S., Blust, R., & Lenaerts, S. (2018). Cyclist exposure to black carbon, ultrafine particles and heavy metals: An experimental study along two commuting routes near Antwerp, Belgium. Environmental Research, 164, 530–538. doi:https://doi.org/10.1016/j.envres.2018.03.004
- Hong, E. S. A., & Bae, C. H. C. (2012). Exposure of bicyclists to air pollution in Seattle, Washington: Hybrid analysis using personal monitoring and land use regression. Transportation Research Record: Journal of the Transportation Research Board, 56(2270), 59–66. doi:https://doi.org/10.1271/bbb.56.150
- Huang, J., Wang, H., Fan, M., Zhuo, A., Sun, Y., & Li, Y. (2020). Understanding the impact of the COVID-19 pandemic on transportation-related behaviors with human mobility data. Proceedings of the 26th ACM SIGKDD International Conference on Knowledge Discovery & Data Mining.
- Int Panis, L., de Geus, B., Vandenbulcke, G., Willems, H., Degraeuwe, B., Bleux, N., Mishra, V., Thomas, I., & Meeusen, R. (2010). Exposure to particulate matter in traffic: A comparison of cyclists and car passengers. Atmospheric Environment, 44(19), 2263-2270. doi:https://doi.org/10.1016/j.atmosenv.2010.04.028
- Joshi, R., & Joseph, Y. (2015). Invisible cyclists and disappearing cycles: The challenges of cycling policies in Indian cities. Transfers, 5(3), 23–40. doi:https://doi.org/10.3167/TRANS.2015.050303
- Kaur, S., Clark, R. D. R., Walsh, P. T., Arnold, S. J., Colvile, R. N., & Nieuwenhuijsen, M. J. (2006). Exposure visualisation of ultrafine particle counts in a transport microenvironment. Atmospheric Environment, 40(2), 386–398. doi:https://doi.org/10.1016/j.atmosenv.2005.09.047
- Kaur, S., Nieuwenhuijsen, M. J., & Colvile, R. N. (2007). Fine particulate matter and carbon monoxide exposure concentrations in urban street transport microenvironments. Atmospheric Environment, 41(23), 4781–4810. doi:https://doi.org/10.1016/j.atmosenv.2007.02.002
- Kelly, P., Kahlmeier, S., Götschi, T., Orsini, N., Richards, J., Roberts, N., … Foster, C. (2014). Systematic review and meta-analysis of reduction in all-cause mortality from walking and cycling and shape of dose response relationship. International Journal of Behavioral Nutrition and Physical Activity, 11(1), 132. doi:https://doi.org/10.1186/s12966-014-0132-x
- Kingham, S., Longley, I., Salmond, J., Pattinson, W., & Shrestha, K. (2013). Variations in exposure to traffic pollution while travelling by different modes in a low density, less congested city. Environmental Pollution, 181, 211–218. doi:https://doi.org/10.1016/j.envpol.2013.06.030
- Knibbs, L. D., Cole-Hunter, T., & Morawska, L. (2011). A review of commuter exposure to ultrafine particles and its health effects. Atmospheric Environment, 45(16), 2611–2622. doi:https://doi.org/10.1016/j.atmosenv.2011.02.065
- Koch, S., Zelembaba, A., Tran, R., Laeremans, M., Hives, B., Carlsten, C., De Boever, P., & Koehle, M. S. (2020). Vascular effects of physical activity are not modified by short-term inhaled diesel exhaust: Results of a controlled human exposure study. Environmental Research, 183, N.PAG-N.PAG. doi:https://doi.org/10.1016/j.envres.2020.109270
- Koglin, T., & Rye, T. (2014). The marginalisation of bicycling in modernist urban transport planning. Journal of Transport & Health, 1(4), 214–222. doi:https://doi.org/10.1016/j.jth.2014.09.006
- Kraus, U., Breitner, S., Hampel, R., Wolf, K., Cyrys, J., Geruschkat, U., … Schneider, A. (2015). Individual daytime noise exposure in different microenvironments. Environmental Research, 140, 479–487. doi:https://doi.org/10.1016/j.envres.2015.05.006
- Krecl, P., Cipoli, Y. A., Targino, A. C., Toloto, M. d. O., Segersson, D., Parra, Á, … Gidhagen, L. (2019). Modelling urban cyclists’ exposure to black carbon particles using high spatiotemporal data: A statistical approach. Science of the Total Environment, 679, 115–125. doi:https://doi.org/10.1016/j.scitotenv.2019.05.043
- Liu, Y., Lan, B., Shirai, J., Austin, E., Yang, C., & Seto, E. (2019). Exposures to air pollution and noise from multi-modal commuting in a Chinese city. International Journal of Environmental Research and Public Health, 16(14), Article 2539. doi:https://doi.org/10.3390/ijerph16142539
- Lonati, G., Ozgen, S., Ripamonti, G., & Signorini, S. (2017). Variability of black carbon and ultrafine particle concentration on urban bike routes in a mid-sized city in the Po Valley (Northern Italy). Atmosphere, 8(2), Article 40. doi:https://doi.org/10.3390/atmos8020040
- MacNaughton, P., Melly, S., Vallarino, J., Adamkiewicz, G., & Spengler, J. D. (2014). Impact of bicycle route type on exposure to traffic-related air pollution. Science of the Total Environment, 490, 37–43. doi:https://doi.org/10.1016/j.scitotenv.2014.04.111
- Madden, M. C., Stevens, T., Case, M., Schmitt, M., Diaz-Sanchez, D., Bassett, M., Montilla, T. S., Berntsen, J., & Devlin, R. B. (2014). Diesel exhaust modulates ozone-induced lung function decrements in healthy human volunteers. Particle and Fibre Toxicology, 11(1), Article 37. doi:https://doi.org/10.1186/s12989-014-0037-5
- Mead, M. I., Popoola, O. A. M., Stewart, G. B., Landshoff, P., Calleja, M., Hayes, M., … Jones, R. L. (2013). The use of electrochemical sensors for monitoring urban air quality in low-cost, high-density networks. Atmospheric Environment, 70, 186–203. doi:https://doi.org/10.1016/j.atmosenv.2012.11.060
- Merritt, A.-S., Georgellis, A., Andersson, N., Bero Bedada, G., Bellander, T., & Johansson, C. (2019). Personal exposure to black carbon in Stockholm, using different intra-urban transport modes. Science of the Total Environment, 674, 279–287. doi:https://doi.org/10.1016/j.scitotenv.2019.04.100
- Minet, L., Liu, R., Valois, M.-F., Xu, J., Weichenthal, S., & Hatzopoulou, M. (2018a). Development and comparison of air pollution exposure surfaces derived from on-road mobile monitoring and short-term stationary sidewalk measurements. Environmental Science and Technology, 52(6), 3512–3519. doi:https://doi.org/10.1021/acs.est.7b05059
- Minet, L., Stokes, J., Scott, J., Xu, J., Weichenthal, S., & Hatzopoulou, M. (2018b). Should traffic-related air pollution and noise be considered when designing urban bicycle networks? Transportation Research Part D: Transport and Environment, 65(9), 736–749. doi:https://doi.org/10.1016/0020-711x(91)90084-z
- Morton, C. (2020). The demand for cycle sharing: Examining the links between weather conditions, air quality levels, and cycling demand for regular and casual users. Journal of Transport Geography, 88, doi:https://doi.org/10.1016/j.jtrangeo.2020.102854
- Mueller, N., Rojas-Rueda, D., Cole-Hunter, T., de Nazelle, A., Dons, E., Gerike, R., … Nieuwenhuijsen, M. (2015). Health impact assessment of active transportation: A systematic review. Preventive Medicine, 76, 103–114.
- Oke, O., Bhalla, K., Love, D. C., & Siddiqui, S. (2015). Tracking global bicycle ownership patterns. Journal of Transport & Health, 2(4), 490–501. doi:https://doi.org/10.1016/j.jth.2015.08.006
- Okokon, E. O., Yli-Tuomi, T., Turunen, A. W., Taimisto, P., Pennanen, A., Vouitsis, I., … Lanki, T. (2017). Particulates and noise exposure during bicycle, bus and car commuting: A study in three European cities. Environmental Research, 154, 181–189. doi:https://doi.org/10.1016/j.envres.2016.12.012
- Park, H.-Y., Gilbreath, S., & Barakatt, E. (2017). Respiratory outcomes of ultrafine particulate matter (UFPM) as a surrogate measure of near-roadway exposures among bicyclists. Environmental Health: A Global Access Science Source, 16(1), 1–7. doi:https://doi.org/10.1186/s12940-017-0212-x
- Pattinson, W., Kingham, S., Longley, I., & Salmond, J. (2017). Potential pollution exposure reductions from small-distance bicycle lane separations. Journal of Transport & Health, 4(2), 40–52. doi:https://doi.org/10.1007/BF01819668
- Pucher, J., Buehler, R., & Seinen, M. (2011). Bicycling renaissance in North America? An update and re-appraisal of cycling trends and policies. Transportation Research Part A: Policy and Practice, 45(6), 451–475. doi:https://doi.org/10.1016/j.tra.2011.03.001
- Qiu, Z., Wang, W., Zheng, J., & Lv, H. (2019). Exposure assessment of cyclists to UFP and PM on urban routes in Xi’an, China. Environmental Pollution, 250, 241–250. doi:https://doi.org/10.1016/j.envpol.2019.03.129
- Raza, W., Forsberg, B., Johansson, C., & Sommar, J. N. (2018). Air pollution as a risk factor in health impact assessments of a travel mode shift towards cycling. Global Health Action, 11(1), 14. doi:https://doi.org/10.1080/16549716.2018.1429081
- Ribeiro, P., & Mendes, J. F. G. (2013). Healthy routes for active modes in school journeys. International Journal of Sustainable Development and Planning, 8(4), 591–602. doi:https://doi.org/10.2495/SDP-V8-N4-591-602
- Snyder, E. G., Watkins, T. H., Solomon, P. A., Thoma, E. D., Williams, R. W., Hagler, G. S., … Preuss, P. W. (2013). The changing paradigm of air pollution monitoring. Environmental Science & Technology, 47(210). doi:10.1021/es4022602
- Strak, M., Boogaard, H., Meliefste, K., Oldenwening, M., Zuurbier, M., Brunekreef, B., & Hoek, G. (2010). Respiratory health effects of ultrafine and fine particle exposure in cyclists. Occupational & Environmental Medicine, 67(2), 118–124. doi:https://doi.org/10.1136/oem.2009.046847
- Su, J. G., Winters, M., Nunes, M., & Brauer, M. (2010). Designing a route planner to facilitate and promote cycling in Metro Vancouver, Canada. Transportation Research Part A: Policy and Practice, 44(7), 495–505. doi:https://doi.org/10.1016/j.tra.2010.03.015
- Sun, Y., Moshfeghi, Y., & Liu, Z. (2017). Exploiting crowdsourced geographic information and GIS for assessment of air pollution exposure during active travel. Journal of Transport & Health, 6, 93–104. doi:https://doi.org/10.1016/j.jth.2017.06.004
- Tainio, M., de Nazelle, A. J., Götschi, T., Kahlmeier, S., Rojas-Rueda, D., Nieuwenhuijsen, M. J., … Woodcock, J. (2016). Can air pollution negate the health benefits of cycling and walking? Preventive Medicine, 87, 233–236. doi:https://doi.org/10.1016/j.ypmed.2016.02.002
- Targino, A. C., Gibson, M. D., Krecl, P., Rodrigues, M. V. C., dos Santos, M. M., & Correa, M. D. (2016). Hotspots of black carbon and PM2.5 in an urban area and relationships to traffic characteristics. Environmental Pollution, 218, 475–486. doi:https://doi.org/10.1016/j.envpol.2016.07.027
- Tom, C.-H., Lidia, M., & Colin, S. (2015). Bicycle commuting and exposure to air pollution: A questionnaire-based investigation of perceptions, symptoms, and risk management strategies. Journal of Physical Activity and Health, 12(4), 490–499. doi:https://doi.org/10.1123/jpah.2013-0122
- Tran, P. T. M., Zhao, M., Yamamoto, K., Minet, L., Nguyen, T., & Balasubramanian, R. (2020). Cyclists’ personal exposure to traffic-related air pollution and its influence on bikeability. Transportation Research Part D: Transport and Environment, 88, doi:https://doi.org/10.1016/j.trd.2020.102563
- Ueberham, M., Schlink, U., Dijst, M., & Weiland, U. (2019). Cyclists’ multiple environmental urban exposures-comparing subjective and objective measurements. Sustainability (Switzerland), 11(5), Article 1412. doi:https://doi.org/10.3390/su11051412
- Van den Bossche, J., De Baets, B., Verwaeren, J., Botteldooren, D., & Theunis, J. (2018). Development and evaluation of land use regression models for black carbon based on bicycle and pedestrian measurements in the urban environment. Environmental Modelling and Software, 99, 58–69. doi:https://doi.org/10.1016/j.envsoft.2017.09.019
- Van den Bossche, J., Peters, J., Verwaeren, J., Botteldooren, D., Theunis, J., & De Baets, B. (2015). Mobile monitoring for mapping spatial variation in urban air quality: Development and validation of a methodology based on an extensive dataset. Atmospheric Environment, 105, 148–161. doi:https://doi.org/10.1016/j.atmosenv.2015.01.017
- Van den Hove, A., Verwaeren, J., Van den Bossche, J., Theunis, J., & De Baets, B. (2020). Development of a land use regression model for black carbon using mobile monitoring data and its application to pollution-avoiding routing. Environmental Research, 183, N.PAG-N.PAG. doi:https://doi.org/10.1016/j.envres.2019.108619
- Vouitsis, I., Taimisto, P., Kelessis, A., & Samaras, Z. (2014). Microenvironment particle measurements in Thessaloniki, Greece. Urban Climate, 10, 608–620. doi:https://doi.org/10.1016/j.uclim.2014.03.009
- Wang, J. Y. T., Dirks, K. N., Ehrgott, M., Pearce, J., & Cheung, A. K. L. (2018). Supporting healthy route choice for commuter cyclists: The trade-off between travel time and pollutant dose. Operations Research for Health Care, 19, 156–164. doi:https://doi.org/10.1016/j.orhc.2018.04.001
- Weichenthal, S., Kulka, R., Dubeau, A., Martin, C., Wang, D., & Dales, R. (2011). Traffic-related air pollution and acute changes in heart rate variability and respiratory function in urban cyclists. Environmental Health Perspectives, 119(10), 1373–1378. doi:https://doi.org/10.1289/ehp.1003321
- Winters, M., Davidson, G., Kao, D., & Teschke, K. (2011). Motivators and deterrents of bicycling: Comparing influences on decisions to ride. Transportation, 38(1), 153–168. doi:https://doi.org/10.1007/s11116-010-9284-y
- Yao, C. M., Ma, A. K., Cushing, S. L., & Lin, V. Y. (2017). Noise exposure while commuting in Toronto – a study of personal and public transportation in Toronto. Journal of Otolaryngology – Head & Neck Surgery, 46(1), 62. doi:https://doi.org/10.1002/ajmg.1320400323
- Zhao, P., Li, S., Li, P., Liu, J., & Long, K. (2018). How does air pollution influence cycling behaviour? Evidence from Beijing. Transportation Research Part D-Transport and Environment, 63, 826–838. https://doi.org/https://doi.org/10.1016/j.trd.2018.07.015
- Zuurbier, M., Hoek, G., Oldenwening, M., Meliefste, K., Krop, E., van den Hazel, P., & Brunekreef, B. (2011a). In-traffic air pollution exposure and CC16, blood coagulation, and inflammation markers in healthy adults. Environmental Health Perspectives, 119(10), 1384–1389. doi:https://doi.org/10.1289/ehp.1003151
- Zuurbier, M., Hoek, G., Oldenwening, M., Meliefste, K., Van Den Hazel, P., & Brunekreef, B. (2011b). Respiratory effects of commuters’ exposure to air pollution in traffic. Epidemiology, 22(2), 219–227. doi:https://doi.org/10.1097/EDE.0b013e3182093693
- Zuurbier, M., Willems, J., Schaap, I., Van der Zee, S., & Hoek, G. (2019). The contribution of moped emissions to ultrafine and fine particle concentrations on bike lanes. Science of the Total Environment, 686(4–5), 191–198. doi:https://doi.org/10.1016/0161-5890(91)90141-6