
ABSTRACT
Data play an indispensable role in transport modelling. The availability of data from non-conventional sources, such as mobile phones, social media, and public transport smart cards, changes the way we conduct mobility analyses and travel forecasting. Existing studies have demonstrated the multitude and varied applications of these emerging data in transport modelling. The transferability of current research and further endeavours depend mostly on the availability of these data. Therefore, the openness or public availability of the prominent data for transport modelling needs to be adequately investigated. Such a discussion should also encompass these data’s application aspects to provide a holistic overview. This paper defines a typology for the data classification based on a set of availability or openness attributes from the existing literature. Subsequently, we use the developed typology to classify the prominent transport data into four categories: (i) Commercial data, (ii) Inaccessible data, (iii) Gratis and accessible data with restricted use, and (iv) Open data. Using this typology, we conclude that the public data, which refer to the data that are accessible and free of cost, are a superset of open data. Further, we discuss the applications and limitations of the selected data in transport modelling and highlight in which task(s) certain data excel. Lastly, we synthesise our review using a Strengths, Weaknesses, Opportunities and Threats (SWOT) analysis to bring out the aspects relevant to data owners and data consumers. Public availability of data can help in various modelling steps such as trip generation, accessibility, destination choice, route choice, network modelling. Complementary datasets such as General Transit Feed Specification (GTFS) and Volunteered Geographic Information (VGI) increase the usability of other data. Thus, modellers can gain from the positive cascade effect by prioritising these data. There is also a potential for data owners to release proprietary data, such as mobile phone data, with restricted-use licenses after addressing privacy risks. Our study contributes by dealing with two problems at the same time. On the one hand, the paper analyses existing data based on their potential for mobility studies. On the other hand, we classify them based on how open they are. Hence, we identify the most promising public data for developing the next generation of transport models.
Introduction
Data are a valuable commodity. The Merriam Webster dictionary defines data as “factual information used as a basis for reasoning, discussion, and calculation” (Merriam-Webster, Citation2020). The spread of mobile phones, affordable sensors, and the internet and innovations in communication technologies has created a data generating ecosystem and led to an explosion of data available for transport analyses. This data revolution has prompted public and private organisations to release their data in part or entirely to the public as a free or paid product or service, with or without restrictions. Simultaneously, the advances in computing and telecommunication technologies have encouraged users to explore innovative use cases of the available data. Public transport schedule data (through the use of the General Transit Feed Specification [GTFS]), for example, are used to provide real-time public transport information through smartphone applications.Footnote1
Before introducing the concept of Public Data, it is vital to understand a few key terms related to the data landscape with reference to transport data. This paragraph and the following paragraph are primarily based on the report “Enabling Access to and Sharing of Data” (OECD, Citation2019). Generally, data are produced from personal or non-personal sources. Data from a personal source contain information, which can be used to identify the data subjects. In such a scenario, the data will be referred to as personal data. The personal data source can be smartphones, social media accounts or onboard vehicle sensors, and non-personal data sources can be inductive loop detectors or weather monitoring stations. Specialised de-identification techniques such as anonymisation, unlinking, or aggregation are used to transform personal data into non-personal data. Two such examples are traffic speed datasets (by TomTomFootnote2 and UberFootnote3) or public transport flow data (from smart cards), where the personally identifiable information is removed, and data from numerous personal subjects are aggregated. Another distinction to note here is that the mode of personal data collection can be of primarily two types, namely volunteered and observed (OECD, Citation2019). For the former, a person or an individual can either actively or passively, but consciously, contribute to the data collection, even if they are just using a service, such as participating in a household survey or crowdsourcing data. For the latter, the data are captured or observed passively, as in mobile devices with enabled Global Navigation Satellite System (GNSS), such as Global Positioning System (GPS). Here, the primary motivation for an individual is always to use a service instead of offering the data. Generally, the individual is required to give a one-time consent, after which the data collection occurs passively unless the consent is revoked. Organisations collect the data and perform data processing (such as cleaning, curation, analysis) and create different value-added data products. This new information is referred to as derived or inferred data (OECD, Citation2019).
Data is primarily owned by either the public or the private sector. The ownership is governed by who was involved in data generation and production stages. In addition to these entities, individual(s) or household(s) might also have some ownership rights in the case of personal data, depending on the prevailing laws and contractual rights. Public and private organisations incur expenses on data collection, production and operation. Private-sector data and most of the public sector data are initially proprietary (OECD, Citation2019). Communities consisting of individuals with common goals can also act as data collectors via crowdsourcing and share the data amongst themselves or with the public, e.g. OpenStreetMapFootnote4 (OSM). An organisation decides if it is suitable (minimum privacy and commercial risks), easy (marginal sharing costs), and beneficial (reciprocity, tangible and intangible benefits) to share their data publicly. Some data, such as individual’s GNSS mobility traces or ride-hailing ridership, might be sensitive, and it cannot be released without anonymisation. Data with no or limited risks can be shared with partner organisations, clients, communities, or the general public.
The public and proprietary data are differentiated in . Informally, the term “Public dataFootnote5” refers to publicly available, free data with or without usage restrictions. In this paper, we formally define public data as a superset of open data, inspired by Kerle (Citation2018) and Wynne-Jones (Citation2019). When data are accessible, allowed to be used for any purpose and redistributed free of charge with almost no restrictions, they can be termed Open data (The World Bank, Citation2019). In this paper, the term public data refers to data that are accessible and free of cost. Unlike open data, public data can be restricted in their usage (e.g. non-commercial licensing) and shareability. Consequently, while open data are always “public”, public data are not necessarily “open”. Furthermore, public data are not the same as Public Sector Information (PSI), where the latter denotes data emerging from government institutions. During the past few years, the data revolution has played a definitive role in creating public awareness and participation in the use of public data. The number of published articles shows that research using public data has gained momentum in the last 15 years (). This rise in public or open data research was strengthened by policy initiatives introduced in 2009/2010 to increase access to government data. The open data revolution received a significant push by Obama’s Open Government Directive in 2009 (US Government, Citation2009) to increase transparency in the Executive branch. This step was complemented by other initiatives, such as the Open Government Partnership (OGP, Citation2011) initiative, the amendment to the EU’s PSI Directive in 2013 (European Commission [EC], Citation2013) or the G8 Open Data Charter in 2013 (Welle Donker & van Loenen, Citation2017). These and many other initiatives in different parts of the world continue to advance the formalisation of open data's legal and technical aspects (Janssen, Citation2011).
Figure 1. Overview of the production and operational flow of the data, partly inspired by OECD (Citation2019).
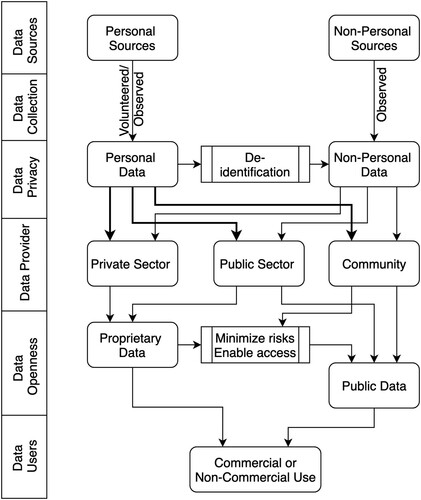
Figure 2. The trend of articles in SCOPUSFootnote22 published from 2005 to 2019 with the keywords: (top) “public data”, “publicly available data”, “open data”, and “open government data”; (bottom) combinations of “publicly available data” (left) and “open data” (right) with transport domain keywords.
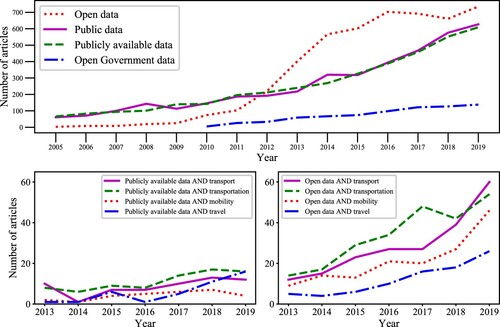
The trend of the studies reflects that the term “open data” is more prevalent in the scientific literature than “public data” (). The same trend is also observed in studies related to the transport domain. However, using the terms “open data” and “public data” interchangeably can be misleading. For instance, the European Data Portal (Citation2018) refers to the Uber Movement dataset as private open data, even though Uber (a private company) does not allow its data for commercial purposes. Thus, these specific data do not entirely fulfil the open data principles stated by the Sunlight Foundation (Citation2010). There are several reasons why private organisations and even public sector institutions are unwilling to share their data. Protecting user privacy and business interests are two commonly cited reasons for this reluctance (Janssen et al., Citation2012). Some other (non-exhaustive) reasons include bureaucratic laxity, lack of political support, fear of public criticism (especially for public sector organisations), lack of skills, infrastructure, and demand for the data. However, private (or even public) organisations may permit limited data usage for research, non-commercial and even commercial purposes with a “razor and blades” model for creating vendor lock-in (Welle Donker & van Loenen, Citation2016). For example, Twitter’s Application Programming Interface (API) and Google’s routing APIs allow limited free usage. In the transport domain, researchers, academics and even policymakers can profit from such data by using it for modelling and data mining applications (Chaniotakis & Antoniou, Citation2015; Cui et al., Citation2018; Llorca et al., Citation2018). Therefore, public data often are valuable for data users even if they come with certain restrictions.
Data-based value creation can be accelerated by both the providers and the users. On the one hand, the supply or availability of data (by a provider) in the public domain will result in more proof of concepts and applications for those specific datasets, e.g. geotagged text from Twitter. On the other hand, demand for some actionable data for the humanitarian and societal causes can push organisations to innovate, collaborate and share the data (Google Mobility ReportsFootnote6, Facebook’s Data for GoodFootnote7). Public data also holds the potential to support research and validation. However, in some cases, sharing data might be a challenge for researchers. Childs et al. (Citation2014) find that researchers face pressure from funding organisations for making the research data open, which sometimes might not be possible due to professional ethical and methodological concerns. Further, the different scientific disciplines differ in their needs and use of the data (Arzberger et al., Citation2004), so this study focuses on transport modelling.
The potential of few emerging data, such as social media and mobile phone data, has been demonstrated in previous transport modelling studies (Milne & Watling, Citation2019; Rashidi et al., Citation2017; Zannat & Choudhury, Citation2019). Nevertheless, there is a need to systematically define and discuss public data for transport modelling to clarify the topic. This could be beneficial for the mobility data providers and users to understand the emerging data for transport modelling in terms of their applications and availability in one place. This could also help initiate a conversation and efforts to make the high potential transport data a priority for increased access and sharing. Therefore, we revisit the emerging transport data and classify them according to their public availability or openness.
The paper is structured as follows: the next section starts with an overview of transport modelling and prominent emerging data in transport modelling and enumerates the research questions, followed by a section introducing the study's methodology. In the following section, we present a data classification typology based on openness attributes. This typology is applied to classify these data into appropriate categories. The following section reviews data applications in transport modelling, followed by a section presenting a SWOT analysis to get an overview of trends by focusing on application and availability aspects together. Finally, we provide some concluding remarks.
Background: data in transport modelling
Transport models are simplified representations of real-world travel behaviour, which can determine when, how, where, and why people travel. Observed travel behaviour data are used to estimate model parameters, and observed flows serve to validate models. The main components of transport models are related to demand-side (trip generation, activity generation, trip distribution, destination choice, departure time choice, mode choice, route choice), supply-side (network modelling, route choice, driving behaviour, traffic flow), demand-supply interactions (assignment, induced demand) and calibration (online/ offline). Here, we attempt to show aspects from the two most common travel demand models: trip-based models and activity-based models. It is clarified that we do not cover freight models in this paper, as the nature of input data for modelling passenger or person travel is rather distinct from modelling freight transport.
The input data and validation data for transport modelling depend on the modelling task but commonly include household (survey) data, sociodemographic data, land-use information, transportation network data (Castiglione et al., Citation2014). Further, if modelling deals with a specific phenomenon (such as Electric Vehicles’ [EVs] adoption or air pollution), additional data (such as present share of EVs and emission data) might be needed. Further, these basic data remain similar for either trip-based or activity-based models. Still, additional details and methodological steps (such as generating a synthetic population) would be needed depending on the modelling requirements (Castiglione et al., Citation2014).
Traditional data collection methods, including household travel surveys, loop detectors and census, tend to cost more and take longer. In addition, land-use information and transport network data from relevant authorities may be restricted or lack usability with the fast-changing landscape of open-source transport modelling tools. Hence, exclusive reliance on traditional data often limits researchers and practitioners in their modelling pursuit. Emerging data may overcome some of these limitations, and their utility depends on whether they can replace, complement, or supplement traditional data sources.
Emerging data in transport modelling
The current data age (innovation and improvements in information, communication and computing) allows the use of passively collected, big and crowdsourced data in transport modelling. For example, data from mobile devices, social media and Automatic Fare Collection (AFC) sources are often labelled as Big data, allowing researchers to analyse their role, benefits and challenges due to their “Big” nature. Milne & Watling (Citation2019) studied the implications of big data for transport systems planning and highlighted future challenges. Welch and Widita (Citation2019) reviewed big data applications in public transport under different categories, including user behaviour and demand. On a similar note, Zannat and Choudhury (Citation2019) analysed the role of big data in public transport planning by focusing on the three types of data, namely smart card data, mobile phone data and GNSS / Automatic Vehicle Location (AVL) data. Prominent emerging data include:
Social media applications are popular for social networking (Facebook, LinkedIn), microblogging (Twitter, Sina-Weibo), location discovery (Foursquare, Google places), media sharing (Instagram, Flickr) as well as rating and reviewing (Yelp, Trip Advisor). Social media data can be featured alongside mobile devices’ geographic location (smartphones and wearables). These geotagged social media data are sometimes referred to as Geographical Social Media (GSM) services or Location-Based Social Networks (LBSN). Chaniotakis et al. (Citation2016a) and Rashidi et al. (Citation2017) reviewed the potential of social media data for travel behaviour modelling.
Mobile phones act as ubiquitous sensors and generate large amounts of location data of basically two types: mobile phone network data (Huang et al., Citation2019) and sensor data (Prelipcean et al., Citation2017; Zannat & Choudhury, Citation2019). Network data are generated when the user makes or receives a call or Short Message Service (SMS), accesses the internet, and during network-related events such as location updates (Huang et al., Citation2019). The smartphone sensor data, consisting primarily of GNSS and motion sensors, are collected through mobile applications or apps. Both network and sensor data have applications in travel behaviour modelling (Gadziński, Citation2018; Rojas et al., Citation2016).
Traffic data collection is transforming, too. Antoniou et al. (Citation2011) proposed a classification based on the sensor’s data collection functionalities, i.e. point sensor, point-point sensor, and area-wide sensors. AVL is a computer-based system to collect and transmit information about the vehicle’s actual location (Strong & Wolenetz, Citation2005). AVL data can be collected primarily by three methods:
Onboard sensors: GNSS provides information about a user’s or vehicle’s location, time and velocity at any moment, based on signal exchange with a system of satellites. Vehicles equipped with onboard sensors participate in transmitting their location data using GNSS receivers. These data are also referred to as probe vehicle or Floating Car data (Westerman, Citation1995). Apart from navigation devices, smartphones carried in private cars, commercial and public transport fleets transmit GNSS location data, e.g. Google Maps, INRIX, Waze or TomTom. As these data are collected with several devices on the road, they are also referred to as crowdsourced traffic or AVL data (Travers, Citation2010).
Static ground-based scanners: WIFI/ Bluetooth scanners can be an alternative to conventional fixed signposts, street cameras or loop detectors for traffic data collection. Bluetooth is a short distance communication protocol used by mobile phones and vehicles. A Bluetooth inquiry device searches for nearby Bluetooth devices and two devices connect if they operate at the same frequency (Bhaskar & Chung, Citation2013). The use of Media Access ControlFootnote8 (MAC) data from the WIFI signals follows a similar principle.
Mobile (moving) scanners, such as drones, are relatively new candidates for traffic data collection. A few pilot studies have recently demonstrated their application in collecting rich traffic data (Barmpounakis & Geroliminis, Citation2020).
AFC systems are popular among public transport agencies, especially in closed public transport systems. These systems use smart cards for efficient fare collection and control access to the station. Smart cards can store and process passenger data, such as personal information, trip data (boarding or alighting time and location, frequency of use) and fare transactions (Pelletier et al., Citation2011). These data are known as AFC data, and public transport planning and modelling have benefited from them (Hamed Faroqi et al., Citation2018, Citation2021).
VGI (Volunteered Geographic Information) belongs to the context of big data and represents crowdsourced georeferenced data that are recorded voluntarily by a large user community. VGI emerged during the first decade of the twenty-first century and is driven mainly by communities like OpenStreetMap. As data are crowdsourced, they are usually available free of charge, and therefore, open.
Certain datasets have gained prominence due to their standardisation. Google developed General Transit Feed Specification (GTFS) for an online public transport trip planner in Portland, Oregon. Since then, it has been applied to many regions worldwide and was established as the de-facto standard for sharing public transport schedules. Similarly, the General Bikeshare Feed Specification (GBFS), an open data standard for bike and scooter sharing systems, was developed under the North American Bikeshare Association (NABSA, Citation2015). Its purpose is to provide real-time information about the current status of bike-sharing systems and their availability.
To the best of our knowledge, most review studies on transport-related datasets mentioned above (p. 10-12) do not focus on the openness or public availability aspects, which are crucial from data users’ viewpoint. For a comprehensive overview, it is essential to also concurrently analyse these datasets’ applications, specifically in transport modelling. In this paper, we see an opportunity to address the following Research Questions (abbreviated as RQs):
(RQ1) What are the main attributes to classify data based on their public availability or openness?
(RQ2) Which categories of the proposed typology do the different types of data described above (p. 10-12) belong to?
(RQ3) What are common applications of these data for transport modelling?
(RQ4) How do the above data excel in their applications viz-à-viz availability?
Methodology
We follow a four-step methodology to answer the four research questions in this paper. First, we compile the relevant attributes for data openness and define a classification typology based on data's public availability (RQ1). Second, we use this typology and classify the data discussed in the previous section based on the data's general characteristics (RQ2). Third, we also review the applications of data from mobile phones, social media, GNSS, Bluetooth, smart cards, VGI and standardised datasets such as GTFS (RQ3). Finally, we analyse the benefits and future challenges viz-à-viz public availability using a SWOT analysis (RQ4).
Public data typology
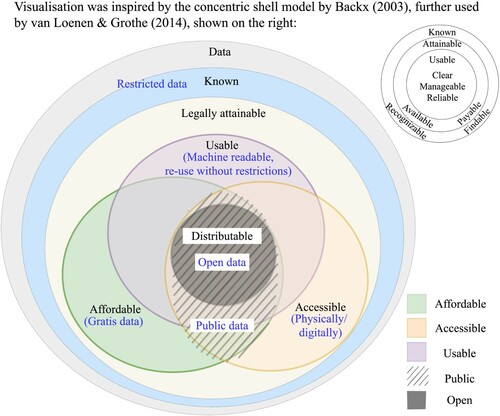
The Open Knowledge FoundationFootnote9 defines open data as “any content information or data that people are free to use, re-use and redistribute without any legal, technological or social restriction”. They mention the key openness features as availability, access, re-use, redistribution and universal participation. We use the above definition and the concentric shell model by Backx (Citation2003), further used by van Loenen & Grothe (Citation2014), to compile the most important attributes and check if the data are known, legally attainable, accessible, affordable, usable and distributable. These attributes are defined below:
Known: Data are findable (van Loenen & Grothe, Citation2014), or at least their existence can be confirmed with the help of common tools, such as Web search engines, catalogues or Freedom of Information requests. Highly restricted data (Government or commercial secrets), undocumented data, or unfindable data are not known and thus are totally out of the public reach.
Legally attainable: When the data are not restricted by way of statutory enactmentsFootnote10, they can be classified as legally attainable. If the data contain sensitive information, such as personal data, defence and trade secrets, the governing legislations aim to mitigate such risks. Unless the related risks are mitigated, these kinds of data (at least in raw form) cannot be legally obtained and are beyond the public domain. Further, it is pointed out that physical/ digital access to legally attainable data is not always guaranteed. The data owner could refuse to share the data due to bureaucratic/ enforcement laxity, fear of criticism, competition, etc.
Accessible: We use accessibility to refer to the physical aspect of attainability, according to van Loenen & Grothe (Citation2014). We include both the physical mode (via post) for records in soft/ hard format and digital modes (APIs, bulk download facilities) of access for cloud or local computer databases. Universally accessible data implies that the data are publicly accessible, irrespective of the cost and usage restrictions, e.g. an API that is publicly accessible, which may/ may not be priced.
Affordable: This is akin to financial attainability and part of the second shell of Backx’s model (van Loenen & Grothe, Citation2014). Data that are available freeFootnote11 of charge (i.e. gratis) are universally affordable. The data provider bears the costFootnote12 from other revenue sources, such as the organisation's general annual budget in case of open government data (Welle Donker & van Loenen, Citation2016). Despite the ongoing emphasis on open data, the commercialisation of proprietary data is growing (OECD, Citation2015 as cited in OECD, Citation2019). However, if the user costs of the data remain small, it can also be affordable at large. This concept is similar to public transport pricing, which is commonly not free but below operating costs to improve equity. Commercial datasets are considered unaffordable in this research.
Usable: Usability is a multi-faceted character that could refer to the ease of use, quality of the data and end-use restrictions. Ease of use increases with machine readability and their compatibility with open-source tools (Braunschweig et al., Citation2012). Structured datasets offer high usability, whereas it is more cumbersome to process unstructured data (like textual data, pdfs, scanned documents). Data quality attributes such as data context (in terms of meta-data), completeness, timeliness and consistency affect the data usability depending on the use case. Re-use of data implies data usage by someone other than the original user for a different purpose (Pasquetto et al., Citation2017). Certain licenses such as CC-BY-NC restrict the application of the datasets to only non-commercial purposes.
Distributable: This refers to the right to re-publish or share the data in an original or modified version with a third party, without any or minor restrictions.Footnote13 This implies that the data come with a suitable license that allows redistribution. The extent of distribution freedom depends on the specific licenses, e.g. distribution in the adapted or original format. Examples of open data conformant licenses are Creative Commons (CC0, CC-BY-4.0, CC-BY-SA-4.0), Open Data Commons, Open Database License ODbL1.0. A review of licensing frameworks is given by Mockus and Palmirani (Citation2015).
The above typology is summarised in . Open data should satisfy all the above parameters, whereas all the public data or publicly available data are not always usable or redistributable.
Figure 3. Public availability/ openness attributes (Extending the concentric shell model by Backx (Citation2003), English translation by van Loenen and Grothe (Citation2014), in the top right corner).
Data classification
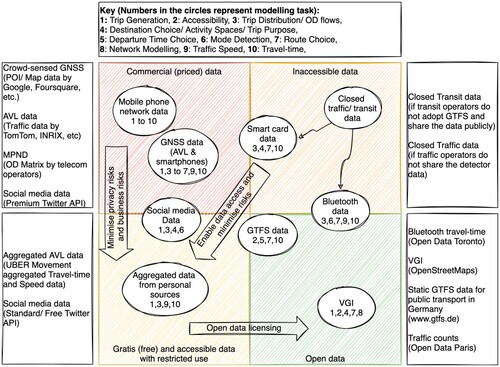
We propose a classification scheme () based on whether the legally attainable data discussed in the previous section () are universally affordable, accessible, usable and distributable. Legally attainable data could be either P (public) or NP (non-public) and are classified into four main categories: (i) Commercial/ Proprietary data (NP-1), (ii) Inaccessible data (NP-2), (iii) Gratis and accessible data with restricted use (P-1), and (iv) Open data (P-2). As the commercial or inaccessible data (NP-1 and NP-2) are not within the public reach, they are non-public data. On the other hand, gratis and accessible (P-1 and P-2) data are referred to as public data.
Commercial data (NP-1) are priced data mainly from private companies, such as mobile phone data, social media data (e.g. premium API from TwitterFootnote14 and FoursquareFootnote15), personal car AVL data. In some cases, Government data may also be priced, e.g. premium GTFS data.Footnote16 There might be exceptions where the priced data are shared for free, particularly with researchers or policymakers. Still, the data are not affordable at large, i.e. universally. Data intermediaries also play a crucial role by sourcing data from multiple data providers and providing processed derived or inferred information as a premium service (OECD, Citation2019).
Inaccessible data (NP-2) includes data owned by transport operators, such as smart card data or detector based AVL data. Some transport operators are willing to share these data (on specific requests/ academic research). Still, they cannot be assumed to be generally accessible as long as these data are not within reach of the public. When such data providers share these data, they are commonly uploaded as open data on their website or open data portal (P-2).
Gratis and accessible data with restricted use (P-1): Examples include free of charge (gratis) data from private companies that come with specific licenses, such as Creative Commons Non-Commercial (CC-BY NC). A few examples are UBER Movement data, social media data (gratis) such as Twitter API. In many cases, such as Google Directions API, aggregate information derived from personal data is shared in the public domain to mitigate privacy risks and maintain an advantage among competitors.
Open data (P-2): This segment is subdivided into threedata ownership types, namely the private sector, public sector or community, depending on who is responsible for the data collection and provision ().
Open Government Data (OGD) refers to the open data produced and collected by public bodies. Mobility or transport datasets are listed under a separate category on most Open Data Portals (ODPs). Open government data are thematically rich and cover a wide range of technical and non-technical areas (Charalabidis et al., Citation2016). The EU’s ITS DirectiveFootnote17 aimed for optimal use of road, traffic and travel data. Presently, Mobility is one of the six themes targeted for high-quality datasets in the EU’s Open data directive 2019 (European Commission, Citation2020). However, despite the OGD's progress in recent years, many data shared by the government lacks usability and clear guidelines/licenses for the distribution of data (Mockus & Palmirani, Citation2015).
Open Private Data (OPD) are still at an early stage. Private companies have varied terms of conditions regarding data release and usage. Some companies value data sharing (Welle Donker et al., Citation2016). For example, many bike-share companies share their real-time bike feeds using the open data standard GBFS.
Open Community Data (OCD) refers to crowdsourced open datasets/ databases neither owned by the government nor by the private sector, such as OpenStreetMap. Research data, such as complete transport models, have been made openly available by researchers (Ziemke et al., Citation2019). While the input data do not necessarily have to be open, the post-processed scenario data can be used by other users.
Table 1. Data Classification.
Not every dataset might fit perfectly into one category. Social media data, for example, could be priced or gratis. Detector count data tend to be inaccessible (NP-2), but in some cases (e.g. the city of Paris), these data are open (P-2). The classification typology is a fair attempt to segment data logically.
Review of data applications
shows the transport modelling applications of different data types and their availability category, discussed below in more detail. The details on the collection of scientific articles are provided in the Supplementary material.
Figure 4. Public availability and applications of the prominent datasets used in transport modelling.
Mobile phone network data (MPND)
MPND can be event-driven or network-driven. Event-driven MPND are generated when a mobile user actively interacts with the device, such as making/ receiving a call or SMS (Huang et al., Citation2019). On the other hand, network-driven mobile phone data are generated even passively and thus are much denser compared to event-driven data (Huang et al., Citation2019).
Event-driven data such as Call Detail Records (CDRs) contain caller ID, timestamp, latitude, longitude, duration of the call or other activity, and receiver’s ID (Rojas et al., Citation2016). Earlier studies showed the feasibility of MPND for Origin-Destination (OD) estimation using a mobile network simulator (Caceres et al., Citation2007). These data are a convenient alternative to conventional methods (roadside interviews and household travel surveys) for estimating OD matrices (Bonnel et al., Citation2018; Tolouei et al., Citation2017). Accurate user trajectories can be obtained from network-driven data and applied for route choice modelling (Schlaich, Citation2010). Travel mode can be detected from mobile phone data using rule-based or machine learning models based on travel-time/ speed distribution (Rojas et al., Citation2016; Wang et al., Citation2010). If MPND are collected over a longer duration, it can be a source for activity location analysis (Järv et al., Citation2014). Mobile phone data were also used for accessibility modelling (Guo et al., Citation2019) and land-use detection (Furno et al., Citation2017). A few studies have combined MPND with other datasets, such as GNSS data for departure time choice (Bwambale et al., Citation2019), Household Travel Surveys for activity location analysis (Chen et al., Citation2014).
Despite their large sample sizes, MPND might not cover specific sections of the population that use mobile phones less frequently, such as children and older people (Tolouei et al., Citation2017). Furthermore, MPND are owned by telecommunication companies and are not publicly available due to privacy and commercial reasons. The sociodemographic attributes are generally not available in MPND. For many modelling tasks with MPND, more traditional observed data (e.g. traffic counts, travel surveys) are still required for validation and scaling the models to the full population. Lastly, it is challenging to infer trajectories from MPND, such as CDRs, due to discontinuity issues and data noise.
Smart card data
Smart card data are suitable for OD matrix estimation, as the start and/ or end of the journey is recorded when a passenger enters or exits a public transport station (Barry et al., Citation2002). The large volume of OD pairs is also useful for route choice modelling using other attributes such as waiting time, in-vehicle travel time, headway or the potential number of transfers, which can be directly or indirectly inferred from smart card data (Jánošíkova et al., Citation2014). The network-wide scale of smart card data is advantageous for calibrating and validating the public transport assignment models (Tavassoli et al., Citation2017). Smart card data could be useful for destination choice estimation, at least to identify the alighting station (Trépanier et al., Citation2007). As smart card data lack information on journey purpose, researchers need travel survey data and other geographical data to infer the trip purpose (Bagchi & White, Citation2005).
Although smart card data have clear benefits, it is not a panacea for public transport modelling. Smart card data are generally not universally accessible since public transport companies might be restricted or unwilling to share the data due to privacy, commercial or other reasons. Even if the data are accessible, the data might not be fully representative of the public transport behaviour, since some public transport users do not own or regularly use a smart card. Inferring the OD trips is difficult if the smart card is not used at the alighting stop. Sociodemographic attributes are absent in the smart card data. Smart card data are generally used with GTFS data to associate the mobility patterns with the public transport network and schedules and thus depend on GTFS data to realise their full potential in public transport planning and operation studies.
Global navigation satellite system (GNSS) data
GNSS systems, such as GPS, GLONASS, BeiDou and Galileo, have been explored to gather data from personal devices/ vehicles that complete or replace household survey data. Research has shown that using GNSS data to confirm user diaries leads to more accurate trip information, overcoming user biases and miscalculations (Kelly et al., Citation2013; Murakami & Wagner, Citation1999). These data can then give a clearer insight into the travellers’ behaviour (Grengs et al., Citation2008) and help decode the user choices regarding travel frequency (Stopher et al., Citation2007), travel mode (Feng & Timmermans, Citation2013) and trip routes (Papinski et al., Citation2009), as well as infer their trip purpose and estimate non-vehicle travel (Wolf et al., Citation2003).
Similar applications exist for taxis regarding trip patterns and congestion (Tang et al., Citation2018) and the selection of the optimal commercial vehicle fleet size (Yang et al., Citation2019). Other taxi applications that use GNSS include analysing route choice (Duan & Wei, Citation2014) and land use classification (Pan et al., Citation2013). In addition, the spatio-temporal context in the GPS data offers valuable information on transport network performance (Sandim et al., Citation2016). GNSS data were also used to understand bicyclists’ route choices, considering the surrounding environment and infrastructure (Broach et al., Citation2012).
A limitation of the GNSS data is the inaccuracy due to delays in signal acquisition (cold starts) and data loss, and errors that stem from obstacles, such as high-rise buildings. Besides, GNSS data can be biased when it mostly stems from specific vehicle fleets (e.g. taxis, staff cars), leading to results that could be misinterpreted when making inferences about general traffic conditions and behaviour.
Bluetooth data
The most popular application of Bluetooth data is travel time estimation. Bhaskar and Chung (Citation2013) have reviewed the technical aspects of the Bluetooth data collection. Bluetooth data are a proxy for license plate recognition match for travel time estimation (Hainen et al., Citation2011) because Bluetooth scanners can identify the vehicles based on the device’s MAC address. Vehicle detection at multiple routes in the network can help travel time estimation and trajectory extraction (Bhaskar et al., Citation2015) and construct the Bluetooth origin-destination matrices (Barceló et al., Citation2010). Data from Bluetooth detectors has been applied for trip behaviour classification (Crawford et al., Citation2018), route choice modelling (Hainen et al., Citation2011) and mode detection (Bathaee et al., Citation2018). Bluetooth data are also used for modelling active modes of transport, i.e. bike travel time and walking (Malinovskiy et al., Citation2012; Ryeng et al., Citation2016). Some case studies have confirmed that travel time data from Bluetooth or WIFI sensors are very similar to actual data (Ryeng et al., Citation2016).
To collect Bluetooth data, scanning hardware needs to be installed at different places in the network, which may be cost-intensive and requires permissions from authorities and safeguarding privacy concerns. The trade-off between location ambiguity and the Bluetooth antenna’s penetration rate (coverage) should be considered when collecting and processing Bluetooth data (Araghi et al., Citation2015).
Social media data
Various social media data have been used to extract variables for travel behaviour analysis, namely trip purpose, destination choice, mode detection and activity duration (Rashidi et al., Citation2017). Social media data can provide insights into travel behaviour at a disaggregated level (at the level of an individual unit such as user, point-of-interest) in real-time. Twitter data are a potential candidate for estimating the trip purpose or activities (Chaniotakis et al., Citation2017). Combined with the point-of-interest data, they can be used to forecast the next activity besides the current activity (Cui et al., Citation2018). Twitter and other social media data have been used to study different aspects of longitudinal travel behaviour, such as destination choice (Chen et al., Citation2018; Llorca et al., Citation2018; Zhang et al., Citation2017) and mode choice (Maghrebi et al., Citation2016). When combined with census and land-use data, Twitter data can help estimate OD demand matrices with adequate accuracy (Osorio-Arjona & García-Palomares, Citation2019). Geotagged Twitter, Flickr and Weibo data can provide contextual information for predicting passenger flows (Ni et al., Citation2017) or a proxy for recreational/ leisure travel (Hamstead et al., Citation2018). Social media data were successfully used to describe mobility patterns, miscellaneous spatial–temporal analysis, sentiment analysis, traffic information extraction, incident detection, among others, at the aggregate or disaggregate level.
A significant proportion of Social media data, such as from Twitter, is not geotagged (Chaniotakis & Antoniou, Citation2015), which either limits their application or requires extended data collection periods. Social media data suffers from representativeness issues, e.g. Twitter data is biased towards high-income groups and leisure activities (Chaniotakis et al., Citation2016b; Wu et al., Citation2017). Textual data from social media applications is unstructured, noisy, ambiguous, short and needs significant pre-processing (Grant-Muller et al., Citation2015). Social media data lacks guaranteed long term availability and suffers from reliability and usability issues due to its private ownership and evolving privacy issues. If social media companies decide not to share any data, the impact on transport modelling research could be substantial, e.g. TripAdvisor prohibits using their data for any data analysis and academic research.Footnote18 Free social media data usually come with restrictions, such as API call limits or the non-availability of historical data. These issues could cause reluctance among cities or policymakers in shifting to social media data for transport modelling.
Volunteered geographic information (VGI)
VGI have been used to estimate and map populations and jobs in a given area. Travel demand models usually require representing the actual population, including home and job locations in the study area. Traditionally, census data are used to represent the population. Bast et al. (Citation2015) developed an approach to estimate population numbers solely based on OSM data at an individual building resolution. Bakillah et al. (Citation2014) presented a framework that disaggregates aggregated population data down to individual buildings using buildings and point-of-interest from OSM. Bienzeisler et al. (Citation2020) used a data fusion approach to estimate job locations based on company data and building data from OSM. A similar use case to estimate traffic volumes and disruptions instead of the population was described by Camargo et al. (Citation2020). Another use case for VGI is the classification of land use, which can be used to allocate jobs and households. Arsanjani et al. (Citation2013) used OSM data to classify land use for the city of Vienna.
On the supply side, transport models work with an abstract representation of the transport infrastructure using network graphs. VGI providers such as OSM were initially designed to map roads and allow navigation with accurate road and public transport networks. OSM has become a standard data source for networks in transport simulations, such as SUMO or MATSim (Ziemke et al., Citation2019). Other transport-related applications of VGI include accessibility calculations based on network and point-of-interest data (Lantseva & Ivanov, Citation2016;), traffic light information extraction (Rieck et al., Citation2015), environmental exposure analysis (Kuehnel et al., Citation2019), and bike ridership analysis (Duran-Rodas et al., Citation2019).
VGI can be used in many applications and is available in most parts of the world. However, the lack of strict quality control and sometimes lax mapping or representation standards can lead to inconsistent data (Senaratne et al., Citation2017). Also, the level of detail and completeness differs by area and largely depends on the active community. Therefore, the quality may vary substantially in different parts of the world.
Standardised transport data
For some commonly used data in the transportation field, public standards have been defined to simplify data exchange. A well-known standard is the GTFS, representing the public transport supply and can be used to calculate public transport travel times. GTFS has become a frequently used standard to model public transport supply (Bienzeisler et al., Citation2020; Ziemke et al., Citation2019). GTFS data were also used to study public transport accessibilities (Owen & Levinson, Citation2017). Unfortunately, GTFS data are not available everywhere, mostly focusing on developed countries. While GTFS works well for regular public transport with a fixed schedule, it cannot represent demand-responsive transport types, such as minibuses or ride-hailing. GTFS data are not always made accessible to researchers by the service provider. Routing requests through Google Maps can be used in such cases, though the number of free requests per day is limited.
Similarly, GBFS is an open standard to provide real-time information about the current status of bike-sharing/ other micro-mobility systems and their availability. Thus, GBFS can play a potential role for shared mobility data by bringing the fragmented information from hundreds of bike-share and micro-mobility platforms under a common standard. DATEX II is another example of a common language used for sharing road traffic data (such as vehicle flow, roadworks, parking, traffic measures) between traffic control, management centres and service providers in the EU. In some instances, these data are also available to the public, such as a live feed for the parking situation in Norfolk County, UKFootnote19, or for road traffic counters in Switzerland.Footnote20
The Zephyr foundation and various stakeholders have introduced data standards used by the transport modelling community. For example, the OMX open matrix formatFootnote21 was developed in 2013 and allows transport modellers to share and read different models’ matrices. More recently, Zephyr promoted the General Modelling Network Specification (GMNS), an open format for network data explicitly designed for transport models (Smith et al., Citation2020). The idea is that models should share a common standard for input and output data. Similar to the emergence of public transport datasets after the emergence of GTFS, this could lead to more publicly available network models in the future.
SWOT analysis
We present the SWOT analysis () for the data discussed in the above section. SWOT helps us synthesise the discussion on the data by bringing together aspects that influence the applications and data availability. Spatial–temporal and contextual (travel mode, population sample) coverage, aggregation level, data frequency, and historical data availability are factors that play a role in determining their application. These factors are directly or indirectly determined by the data providers, who are responsible for protecting the user’s privacy and proprietaryinterests.
Table 2. SWOT Analysis.
MPND have extensive spatial–temporal coverage, but these data are privately owned and publicly unavailable. Social media data offer location data with contextual information, which is unique but suffers from sample bias favouring the young and high-income population and leisure activities (Chaniotakis & Antoniou, Citation2015). Further evolving social media platforms and privacy issues increase uncertainty in the availability of these data in future. Due to privacy or commercial interests’ issues concerning disaggregate data from mobile phones, smart cards, and social media, data owners (private or public) often reluctantly share these data or restrict and limit its availability. It is also crucial for data providers to process raw data before sharing to mitigate any privacy concerns. For example, mobile network data or AVL data need to be anonymised or aggregated so that the individual users/ patterns cannot be identified. While such intermediate steps are necessary, they commonly result in losing some information in the resulting data.
Open standards like GTFS have helped increase the usability and interoperability of public transport data. Similarly, GBFS is a relatively new step towards sharing data from new mobility forms, such as bike-sharing. Crowdsourced VGI bridge the gap of missing spatial information by providing an alternate source of large datasets, but their quality and depth depend on the involved community's participation. Successes on the open data front were generated due to the collaboration of data consumers and data providers. These developments have had a positive cascade effect by giving birth to new tools and innovations based on these datasets.
Conclusion
This research classified transport-related data by examining whether they are attainable, affordable, accessible, usable, and redistributable. We also showed how emerging open, and not-so-open data are used in transport modelling applications. Most data types are applied for either supply-side (e.g. GTFS) or demand-side modelling (e.g. social media data). However, no single data excel in all the applications, and thus, data complementarity is vital for building transport models. Therefore, modellers and authorities need to plan on and invest in developing or acquiring complementary data sources.
Mobile phone data, social media data and even smart card data collected by public and private organisations come with challenges, including proprietary ownership and privacy risks. These data have the potential to become publicly available with restricted or free-use licensing if concerns regarding commercial competition, privacy protection, and revenue loss are allayed. On the other hand, community datasets are crowdsourced and thus depend on the participation of local contributors. These issues could be overcome if private companies, communities and the government followed a common objective and shared data cooperatively based on reciprocity. This was partially demonstrated over the last fifteen years as the OGD and open standards matured. The transition towards OGD can help bridge the data availability gap by pushing the PSI or government data from category NP-2 to the public data category. A lesson can be learned from the road or public transport authorities who have made the aggregate traffic or passenger data publicly available.
We could not cover all data applications in detail but rather intended to present a broad overview of the most prominent transport data. The public availability landscape of specific datasets could vary depending on the location, policy ecosystem and technology penetration. Therefore, a location-specific analysis or case studies for selected cities could be avenues for future research.
Supplementary_Material
Download MS Word (21.8 KB)Acknowledgements
We want to thank the three anonymous reviewers for taking the time to provide their valuable comments. We are deeply grateful to them for helping us enrich the manuscript and improve it significantly. We also want to thank Santhanakrishnan Narayanan (TU Munich) for sharing the codes to query the scientific database.
Disclosure statement
No potential conflict of interest was reported by the author(s).
Additional information
Funding
Notes
5 We could not find an official definition of “public data” in two popular dictionaries, namely Oxford and Merriam Webster, although there are references in the grey literature (Kerle, Citation2018; Wynne-Jones, Citation2019)
8 Unique identifier assigned to a device by the device manufacturer for communication within a network
10 Examples of such Statutory rules are the General Data Protection Regulation in EU, the State Secrecy Law in Japan, the Defense Secrets Act in USA or the Trade Secrets Act in Germany.
11 In this paper, “free” implies gratis or free of charge datasets, wherein users don’t need to pay any fees for using the data. Another interpretation of “free” is “free as in the freedom of speech” or libre, which gives the user freedom to modify, adapt, and even distribute the data (Suber, Citation2008).
12 Data costs can correspond to different stages, such as production, curation, analytics, publication, marketing, etc. Thus, the data owner or provider can decide to cover these costs in part or full, from diverse revenue streams including budget, licensing, etc.
13 As per the www.opendefinition.org, requirements of attribution and share-alike conform with the Open data definition, and thus do not count towards restricting usage or distribution of the data.
22 The data was downloaded from Scopus API between January 1 and 31, 2020 via http://api.elsevier.com and http://www.scopus.com
References
- Antoniou, C., Balakrishna, R., & Koutsopoulos, H. N. (2011). A synthesis of emerging data collection technologies and their impact on traffic management applications. European Transport Research Review, 3(3), 139–148. doi:https://doi.org/10.1007/s12544-011-0058-1
- Araghi, B. N., Hammershøj Olesen, J., Krishnan, R., Tørholm Christensen, L., & Lahrmann, H. (2015). Reliability of Bluetooth Technology for travel time estimation. Journal of Intelligent Transportation Systems: Technology, Planning, and Operations, 19(3), 240–255. doi:https://doi.org/10.1080/15472450.2013.856727
- Arzberger, P., Schroeder, P., Beaulieu, A., Bowker, G., Casey, K., Laaksonen, L., … Wouters, P. (2004). An International framework to promote access to data. Science: Policy Forum, 303(March), 1777–1779.
- Backx, M. (2003). Gebouwen redden levens. Toegankelijkheidseisen van gebouwgegevens in het kader van de openbare orde en veiligheid. Delft: Delft University of Technology.
- Bagchi, M., & White, P. R. (2005). The potential of public transport smart card data. Transport Policy, 12(5), 464–474. doi:https://doi.org/10.1016/j.tranpol.2005.06.008
- Bakillah, M., Liang, S., Mobasheri, A., Jokar Arsanjani, J., & Zipf, A. (2014). Fine-resolution population mapping using OpenStreetMap points-of-interest. International Journal of Geographical Information Science, 28(9), 1940–1963. doi:https://doi.org/10.1080/13658816.2014.909045
- Barceló, J., Montero, L., Marqués, L., & Carmona, C. (2010). Travel time forecasting and dynamic origin-destination estimation for freeways based on bluetooth traffic monitoring. Transportation Research Record, 2175, 19–27. doi:https://doi.org/10.3141/2175-03
- Barmpounakis, E., & Geroliminis, N. (2020). On the new era of urban traffic monitoring with massive drone data: The pNEUMA large-scale field experiment. Transportation Research Part C: Emerging Technologies, 111(October 2019), 50–71. doi:https://doi.org/10.1016/j.trc.2019.11.023
- Barry, J. J., Newhouser, R., Rahbee, A., & Sayeda, S. (2002). Origin and destination estimation in New York city with automated fare system data. Transportation Research Record, 1817, 183–187. doi:https://doi.org/10.3141/1817-24
- Bast, H., Storandt, S., & Weidner, S. (2015). Fine-grained population estimation. GIS: Proceedings of the ACM International symposium on Advances in Geographic Information systems, 03-06-nove. doi:https://doi.org/10.1145/2820783.2820828.
- Bathaee, N., Mohseni, A., Park, S. J., Porter, J. D., & Kim, D. S. (2018). A cluster analysis approach for differentiating transportation modes using Bluetooth sensor data. Journal of Intelligent Transportation Systems: Technology, Planning, and Operations, 22(4), 353–364. doi:https://doi.org/10.1080/15472450.2018.1457444
- Bhaskar, A., & Chung, E. (2013). Fundamental understanding on the use of Bluetooth scanner as a complementary transport data. Transportation Research Part C: Emerging Technologies, 37, 42–72. doi:https://doi.org/10.1016/j.trc.2013.09.013
- Bhaskar, A., Qu, M., & Chung, E. (2015). Bluetooth vehicle trajectory by fusing bluetooth and loops: Motorway travel time statistics. IEEE Transactions on Intelligent Transportation Systems, 16(1), 113–122. doi:https://doi.org/10.1109/TITS.2014.2328373
- Bienzeisler, L., Lelke, T., Wage, O., Thiel, F., & Friedrich, B. (2020). Development of an Agent-Based Transport Model for the city of hanover using Empirical mobility data and data fusion. Transportation Research Procedia, 47, 99–106. doi:https://doi.org/10.1016/j.trpro.2020.03.073
- Bonnel, P., Fekih, M., & Smoreda, Z. (2018). Origin-Destination estimation using mobile network probe data. Transportation Research Procedia, 32, 69–81. doi:https://doi.org/10.1016/j.trpro.2018.10.013
- Braunschweig, K., Eberius, J., Thiele, M., & Lehner, W. (2012). The state of open data: Limits of current open data platforms categories and subject descriptors. Conference Proceedings World Wide Web Conference, WWW 2012, Lyon.
- Broach, J., Dill, J., & Gliebe, J. (2012). Where do cyclists ride? A route choice model developed with revealed preference GPS data. Transportation Research Part A: Policy and Practice, 46(10), 1730–1740. doi:https://doi.org/10.1016/j.tra.2012.07.005
- Bwambale, A., Choudhury, C. F., & Hess, S. (2019). Modelling departure time choice using mobile phone data. Transportation Research Part A: Policy and Practice, 130(September), 424–439. doi:https://doi.org/10.1016/j.tra.2019.09.054
- Caceres, N., Wideberg, J. P., & Benitez, F. G. (2007). Deriving origin–destination data from a mobile phone network. IET Intelligent Transport Systems, 1(1), 15–26. doi:https://doi.org/10.1049/iet-its:20060020
- Camargo, C. Q., Bright, J., McNeill, G., Raman, S., & Hale, S. A. (2020). Estimating traffic disruption patterns with Volunteered Geographic information. Scientific Reports, 10(1), 1–8. doi:https://doi.org/10.1038/s41598-020-57882-2
- Castiglione, J., Bradley, M., & Gliebe, J. (2014). Activity-Based travel demand models: A primer. Washington, DC: The National Academies Press. doi:https://doi.org/10.17226/22357.
- Chaniotakis, E., & Antoniou, C. (2015). Use of geotagged social media in urban settings: Empirical evidence on Its potential from twitter. IEEE Conference on Intelligent Transportation Systems, proceedings, ITSC, 2015-octob(1), 214–219. doi:https://doi.org/10.1109/ITSC.2015.44.
- Chaniotakis, E., Antoniou, C., Aifadopoulou, G., & Dimitriou, L. (2017). Inferring activities from social media data. Transportation Research Record, 2666, 29–37. doi:https://doi.org/10.3141/2666-04
- Chaniotakis, E., Antoniou, C., Grau, J. M. S., & Dimitriou, L. (2016a). Can social media data augment travel demand survey data? IEEE Conference on Intelligent Transportation Systems, proceedings, ITSC, 1642–1647. doi:https://doi.org/10.1109/ITSC.2016.7795778.
- Chaniotakis, E., Antoniou, C., & Pereira, F. (2016b). Mapping social media for transportation studies. IEEE Intelligent Systems, 31(6), 64–70. doi:https://doi.org/10.1109/MIS.2016.98
- Charalabidis, Y., Alexopoulos, C., & Loukis, E. (2016). A taxonomy of open government data research areas and topics. Journal of Organizational Computing and Electronic Commerce, 26(1–2), 41–63. doi:https://doi.org/10.1080/10919392.2015.1124720
- Chen, C., Bian, L., & Ma, J. (2014). From traces to trajectories: How well can we guess activity locations from mobile phone traces? Transportation Research Part C: Emerging Technologies, 46, 326–337. doi:https://doi.org/10.1016/j.trc.2014.07.001
- Chen, Y., Mahmassani, H. S., & Frei, A. (2018). Incorporating social media in travel and activity choice models: Conceptual framework and exploratory analysis. International Journal of Urban Sciences, 22(2), 180–200. doi:https://doi.org/10.1080/12265934.2017.1331749
- Childs, S., McLeod, J., Lomas, E., & Cook, G. (2014). Opening research data: Issues and opportunities. Records Management Journal, 24(2), 142-162. https://doi.org/https://doi.org/10.1108/RMJ-01-2014-0005
- Crawford, F., Watling, D. P., & Connors, R. D. (2018). Identifying road user classes based on repeated trip behaviour using Bluetooth data. Transportation Research Part A: Policy and Practice, 113, 55–74. doi:https://doi.org/10.1016/j.tra.2018.03.027
- Cui, Y., Meng, C., He, Q., & Gao, J. (2018). Forecasting current and next trip purpose with social media data and Google places. Transportation Research Part C: Emerging Technologies, 97(September), 159–174. doi:https://doi.org/10.1016/j.trc.2018.10.017
- Duan, Z., & Wei, Y. (2014). Revealing taxi driver route choice characteristics based on GPS data. CICTP, 2014, 565–573. doi:https://doi.org/10.1061/9780784413623.055
- Duran-Rodas, D., Chaniotakis, E., & Antoniou, C. (2019). Built Environment factors affecting bike sharing ridership: Data-driven approach for multiple cities. Transportation Research Record, 2673(12), 55–68. doi:https://doi.org/10.1177/0361198119849908
- European Commission. (2013). What changes does the revised PSI Directive bring? https://ec.europa.eu/digital-singlemarket/en/news/what-changes-does-revised-psi-directive-bring
- European Commission. (2020). Open data. https://digital-strategy.ec.europa.eu/en/policies/open-data
- European Data Portal. (2018). Open Data from private companies? https://data.europa.eu/en/news/open-data-private-companies
- Faroqi, H., Mesbah, M., & Kim, J. (2018). Applications of transit smart cards beyond a fare collection tool: A literature review. Advances in Transportation Studies, 45(September), 107–122. doi:https://doi.org/10.4399/978255166098
- Faroqi, H., Moeckel, R., & Mesbah, M. (2021). Temporal distribution of sociodemographic characteristics at transit stops. Transportation Planning and Technology, 44(2), 208–221. doi:https://doi.org/10.1080/03081060.2020.1868087
- Feng, T., & Timmermans, H. J. P. (2013). Transportation mode recognition using GPS and accelerometer data. Transportation Research Part C: Emerging Technologies, 37, 118–130. doi:https://doi.org/10.1016/j.trc.2013.09.014
- Fransen, K., Neutens, T., Farber, S., De Maeyer, P., Deruyter, G., & Witlox, F. (2015). Identifying public transport gaps using time-dependent accessibility levels. Journal of Transport Geography, 48, 176–187. doi:https://doi.org/10.1016/j.jtrangeo.2015.09.008
- Furno, A., El Faouzi, N. E., Fiore, M., & Stanica, R. (2017). Fusing GPS probe and mobile phone data for enhanced land-use detection. 5th IEEE International Conference on models and Technologies for Intelligent Transportation systems, MT-ITS 2017 - proceedings, 696–698. doi:https://doi.org/10.1109/MTITS.2017.8005601.
- Gadziński, J. (2018). Perspectives of the use of smartphones in travel behaviour studies: Findings from a literature review and a pilot study. Transportation Research Part C: Emerging Technologies, 88(July 2017), 74–86. doi:https://doi.org/10.1016/j.trc.2018.01.011
- Grant-Muller, S. M., Gal-Tzur, A., Minkov, E., Nocera, S., Kuflik, T., & Shoor, I. (2015). Enhancing transport data collection through social media sources: Methods, challenges and opportunities for textual data. IET Intelligent Transport Systems, 9(4), 407–417. doi:https://doi.org/10.1049/iet-its.2013.0214
- Grengs, J., Wang, X., & Kostyniuk, L. (2008). Using GPS data to understand driving behavior. Journal of Urban Technology, 15(2), 33–53. doi:https://doi.org/10.1080/10630730802401942
- Guo, S., Song, C., Pei, T., Liu, Y., Ma, T., Du, Y., … Wang, Y. (2019). Accessibility to urban parks for elderly residents: Perspectives from mobile phone data. Landscape and Urban Planning, 191(January), 103642. doi:https://doi.org/10.1016/j.landurbplan.2019.103642
- Hainen, A. M., Wasson, J. S., Hubbard, S. M. L., Remias, S. M., Farnsworth, G. D., & Bullock, D. M. (2011). Estimating route choice and travel time reliability with field observations of bluetooth probe vehicles. Transportation Research Record, 2256, 43–50. doi:https://doi.org/10.3141/2256-06
- Hamstead, Z. A., Fisher, D., Ilieva, R. T., Wood, S. A., McPhearson, T., & Kremer, P. (2018). Geolocated social media as a rapid indicator of park visitation and equitable park access. Computers, Environment and Urban Systems, 72(July 2017), 38–50. doi:https://doi.org/10.1016/j.compenvurbsys.2018.01.007
- Huang, H., Cheng, Y., & Weibel, R. (2019). Transport mode detection based on mobile phone network data: A systematic review. Transportation Research Part C: Emerging Technologies, 101(January), 297–312. doi:https://doi.org/10.1016/j.trc.2019.02.008
- Jánošíkova, L., Slavík, J., & Koháni, M. (2014). Estimation of a route choice model for urban public transport using smart card data. Transportation Planning and Technology, 37(7), 638–648. doi:https://doi.org/10.1080/03081060.2014.935570
- Janssen, K. (2011). The influence of the PSI directive on open government data: An overview of recent developments. Government Information Quarterly, 28(4), 446–456. doi:https://doi.org/10.1016/j.giq.2011.01.004
- Janssen, M., Charalabidis, Y., & Zuiderwijk, A. (2012). Benefits, adoption barriers and myths of open data and open government. Information Systems Management, 29(4), 258–268. doi:https://doi.org/10.1080/10580530.2012.716740
- Järv, O., Ahas, R., & Witlox, F. (2014). Understanding monthly variability in human activity spaces: A twelve-month study using mobile phone call detail records. Transportation Research Part C: Emerging Technologies, 38, 122–135. doi:https://doi.org/10.1016/j.trc.2013.11.003
- Jokar Arsanjani, J., Helbich, M., Bakillah, M., Hagenauer, J., & Zipf, A. (2013). Toward mapping land-use patterns from volunteered geographic information. International Journal of Geographical Information Science, 27(12), 2264–2278. doi:https://doi.org/10.1080/13658816.2013.800871
- Kelly, P., Krenn, P., Titze, S., Stopher, P., & Foster, C. (2013). Quantifying the Difference between self-reported and Global Positioning systems-measured journey durations: A systematic review. Transport Reviews, 33(4), 443–459. doi:https://doi.org/10.1080/01441647.2013.815288
- Kerle, I. (2018). What is Public Data? https://enigma.com/blog/post/what-is-public-data
- Kickhöfer, B., Hosse, D., Turner, K., & Tirachinic, A. (2016). Creating an open MATSim scenario from open data: The case of Santiago de Chile.
- Kuehnel, N., Kaddoura, I., & Moeckel, R. (2019). Noise shielding in an Agent-Based Transport Model using Volunteered Geographic data. Procedia Computer Science, 151, 808–813. doi:https://doi.org/10.1016/j.procs.2019.04.110
- Kujala, R., Weckstrom, C., Darst, R. K., Mladenovic, M. N., & Saramaki, J. (2018). Data descriptor: A collection of public transport network data sets for 25 cities. Scientific Data, 5, 1–14. doi:https://doi.org/10.1038/sdata.2018.89
- Lantseva, A. A., & Ivanov, S. V. (2016). Modeling transport accessibility with open data: Case study of St. Petersburg. Procedia Computer Science, 101, 197–206. doi:https://doi.org/10.1016/j.procs.2016.11.024
- Llorca, C., Ji, J., Molloy, J., & Moeckel, R. (2018). The usage of location based big data and trip planning services for the estimation of a long-distance travel demand model. Predicting the impacts of a new high speed rail corridor. Research in Transportation Economics, 72(June), 27–36. doi:https://doi.org/10.1016/j.retrec.2018.06.004
- Maghrebi, M., Abbasi, A., & Waller, S. T. (2016). Transportation application of social media: Travel mode extraction. IEEE Conference on Intelligent Transportation Systems, proceedings, ITSC, 1648–1653. doi:https://doi.org/10.1109/ITSC.2016.7795779.
- Malinovskiy, Y., Saunier, N., & Wang, Y. (2012). Analysis of pedestrian travel with static bluetooth sensors. Transportation Research Record, 2299, 137–149. doi:https://doi.org/10.3141/2299-15
- Merriam-Webster. (2020). Data. https://www.merriam-webster.com/dictionary/data
- Milne, D., & Watling, D. (2019). Big data and understanding change in the context of planning transport systems. Journal of Transport Geography, 76(October 2017), 235–244. doi:https://doi.org/10.1016/j.jtrangeo.2017.11.004
- Mockus, M., & Palmirani, M. (2015). Open government data licensing framework. International Conference on Electronic government and the Information Systems perspective. 9265, 287–301. doi:https://doi.org/10.1007/978-3-319-22389-6.
- Murakami, E., & Wagner, D. P. (1999). Can using Global Positioning System (GPS) improve trip reporting? Transportation Research Part C: Emerging Technologies, 7(2–3), 149–165. doi:https://doi.org/10.1016/S0968-090X(99)00017-0
- Ni, M., He, Q., & Gao, J. (2017). Forecasting the subway passenger flow under event occurrences with social media. IEEE Transactions on Intelligent Transportation Systems, 18(6), 1623–1632. doi:https://doi.org/10.1109/TITS.2016.2611644
- North American Bikeshare Association. (2015). General Bikeshare Feed specification. Github. https://github.com/NABSA/gbfs
- OECD. (2015). Data-driven innovation: Big data for growth and well-being. Paris: OECD Publishing. https://doi.org/https://doi.org/10.1787/9789264229358-en.
- OECD. (2019). Enhancing access to and sharing of data: Reconciling risks and benefits for data re-use across societies. Paris: OECD Publishing. doi:https://doi.org/10.1787/276aaca8-en.
- OGP. (2011). Open Government Partnership. https://www.opengovpartnership.org/
- Osorio-Arjona, J., & García-Palomares, J. C. (2019). Social media and urban mobility: Using twitter to calculate home-work travel matrices. Cities, 89(September 2018), 268–280. doi:https://doi.org/10.1016/j.cities.2019.03.006
- Owen, A., & Levinson, D. M. (2017). Developing a comprehensive U.S. Transit accessibility database. In P. Thakuriah, N. Tilahun, & M. Zellner (Eds.), Seeing cities through Big data. Springer Geography (pp. 279–290). Springer, Cham. doi:https://doi.org/10.1007/978-3-319-40902-3_16.
- Pan, G., Qi, G., Wu, Z., Zhang, D., & Li, S. (2013). Land-use classification using taxi GPS traces. IEEE Transactions on Intelligent Transportation Systems, 14(1), 113–123. doi:https://doi.org/10.1109/TITS.2012.2209201
- Papinski, D., Scott, D. M., & Doherty, S. T. (2009). Exploring the route choice decision-making process: A comparison of planned and observed routes obtained using person-based GPS. Transportation Research Part F: Traffic Psychology and Behaviour, 12(4), 347–358. doi:https://doi.org/10.1016/j.trf.2009.04.001
- Pasquetto, I. V., Randles, B. M., & Borgman, C. L. (2017). On the reuse of scientific data. Data Science Journal, 16(Borgman 2015), 1–9. doi:https://doi.org/10.5334/dsj-2017-008
- Pelletier, M. P., Trépanier, M., & Morency, C. (2011). Smart card data use in public transit: A literature review. Transportation Research Part C: Emerging Technologies, 19(4), 557–568. doi:https://doi.org/10.1016/j.trc.2010.12.003
- Prelipcean, A. C., Gidófalvi, G., & Susilo, Y. O. (2017). Transportation mode detection–an in-depth review of applicability and reliability. Transport Reviews, 37(4), 442–464. doi:https://doi.org/10.1080/01441647.2016.1246489
- Rashidi, T. H., Abbasi, A., Maghrebi, M., Hasan, S., & Waller, T. S. (2017). Exploring the capacity of social media data for modelling travel behaviour: Opportunities and challenges. Transportation Research Part C: Emerging Technologies, 75, 197–211. doi:https://doi.org/10.1016/j.trc.2016.12.008
- Rieck, D., Schünemann, B., & Radusch, I. (2015). Advanced traffic light information in openstreetmap for traffic simulations. In M. Behrisch, & M. Weber (Eds.), Modeling mobility with Open data. Lecture notes in mobility (pp. 25-34). Springer, Cham. doi:https://doi.org/10.1007/978-3-319-15024-6_2.
- Rojas, M. B., Sadeghvaziri, E., & Jin, X. (2016). Comprehensive review of travel behavior and mobility pattern studies that used mobile phone data. Transportation Research Record, 2563(2563), 71–79. doi:https://doi.org/10.3141/2563-11
- Ryeng, E. O., Haugen, T., Grønlund, H., & Overå, S. B. (2016). Evaluating Bluetooth and Wi-Fi sensors as a tool for collecting bicycle speed at Varying gradients. Transportation Research Procedia, 14(2352), 2289–2296. doi:https://doi.org/10.1016/j.trpro.2016.05.245
- Sandim, M., Rossetti, R. J. F., Moura, D. C., Kokkinogenis, Z., & Ŕubio, T. R. P. M. (2016). Using GPS-based AVL data to calculate and predict traffic network performance metrics: A systematic review. IEEE Conference on Intelligent Transportation Systems, proceedings, ITSC, 1692–1699. doi:https://doi.org/10.1109/ITSC.2016.7795786.
- Schlaich, J. (2010). Analysing route choice behavior with mobile phone trajectories. Transportation Research Record, 2157, 78–85. doi:https://doi.org/10.3141/2157-10
- Senaratne, H., Mobasheri, A., Ali, A. L., Capineri, C., & Haklay, M. (Muki) (2017). A review of volunteered geographic information quality assessment methods. International Journal of Geographical Information Science, 31(1), 139–167. doi:https://doi.org/10.1080/13658816.2016.1189556
- Smith, S., Berg, I., & Yang, C. (2020). General Modeling Network Specification: documentation, software and data. https://trid.trb.org/view/1693717
- Stopher, P., FitzGerald, C., & Xu, M. (2007). Assessing the accuracy of the sydney household travel survey with GPS. Transportation, 34(6), 723–741. doi:https://doi.org/10.1007/s11116-007-9126-8
- Strong, C., & Wolenetz, J. (2005). Pilot Test of Automatic Vehicle Location on Snow Plows (Issue September).
- Suber, P. (2008). Gratis and libre open access. SPARC Open Access Newsletter. https://dash.harvard.edu/handle/1/4322580
- Sunlight Foundation. (2010). Ten principles for opening up government information. https://sunlightfoundation.com/policy/documents/ten-open-dataprinciples/
- Tang, J., Liang, J., Zhang, S., Huang, H., & Liu, F. (2018). Inferring driving trajectories based on probabilistic model from large scale taxi GPS data. Physica A: Statistical Mechanics and Its Applications, 506, 566–577. doi:https://doi.org/10.1016/j.physa.2018.04.073
- Tavassoli, A., Mesbah, M., & Hickman, M. (2017). Application of smart card data in validating a large-scale multi-modal transit assignment model. Public Transport, 10, 1. doi:https://doi.org/10.1007/s12469-017-0171-1
- The World Bank. (2019). Open Data Essentials. http://opendatatoolkit.worldbank.org/en/essentials.html
- Tolouei, R., Psarras, S., & Prince, R. (2017). Origin-Destination trip matrix development: Conventional methods versus mobile phone data. Transportation Research Procedia, 26(2016), 39–52. doi:https://doi.org/10.1016/j.trpro.2017.07.007
- Travers, J. (2010). Inside Inrix–How traffic data is collected, what it means to your commute. Consumer Reports. https://www.consumerreports.org/cro/news/2010/04/inside-inrix-howtraffic-data-is-collected-what-it-means-to-your-commute/index.htm
- Trépanier, M., Tranchant, N., & Chapleau, R. (2007). Individual trip destination estimation in a transit smart card automated fare collection system. Journal of Intelligent Transportation Systems: Technology, Planning, and Operations, 11(1), 1–14. doi:https://doi.org/10.1080/15472450601122256
- US Government. (2009). Open Government Directive. https://obamawhitehouse.archives.gov/open/documents/opengovernment-directive
- van Loenen, B., & Grothe, M. (2014). INSPIRE empowers Re-Use of public sector information. International Journal of Spatial Data Infrastructures Research, 9, 96–106. doi:https://doi.org/10.2902/1725-0463.2014.09.art4
- Wang, H., Calabrese, F., Di Lorenzo, G., & Ratti, C. (2010). Transportation mode inference from anonymised and aggregated mobile phone call detail records. IEEE Conference on Intelligent Transportation Systems, proceedings, ITSC, 318–323. doi:https://doi.org/10.1109/ITSC.2010.5625188.
- Welch, T. F., & Widita, A. (2019). Big data in public transportation: A review of sources and methods. Transport Reviews, 39(6), 795–818. doi:https://doi.org/10.1080/01441647.2019.1616849
- Welle Donker, F., & van Loenen, B. (2016). Sustainable business models for public sector open data providers. JeDEM - EJournal of EDemocracy and Open Government, 8(1), 28–61. doi:https://doi.org/10.29379/jedem.v8i1.390
- Welle Donker, F., & van Loenen, B. (2017). How to assess the success of the open data ecosystem? International Journal of Digital Earth, 10(3), 284–306. doi:https://doi.org/10.1080/17538947.2016.1224938
- Welle Donker, F., van Loenen, B., & Bregt, A. K. (2016). Open data and beyond. ISPRS International Journal of Geo-Information, 5, 4. doi:https://doi.org/10.3390/ijgi5040048
- Westerman, M. (1995). Probe Vehicle System Concept. JPL’s Wireless Communication Reference Website. http://www.wirelesscommunication.nl/reference/chaptr01/roadtrin/ivhsprob.htm
- Wolf, J., Loechl, M., Thompson, M., & Arce, C. (2003). Trip rate analysis in GPS-enhanced personal travel surveys. In P. Jones & P. R. Stopher (Eds.), Transport Survey Quality and Innovation (pp. 483–498). Emerald Group Publishing Limited. doi:https://doi.org/10.1108/9781786359551-028.
- Wu, X., Lindsey, G., Fisher, D., & Wood, S. A. (2017). Photos, tweets, and trails: Are social media proxies for urban trail use? Journal of Transport and Land Use, 10(1), 789–804. doi:https://doi.org/10.5198/jtlu.2017.943
- Wynne-Jones, L. (2019). Is There a Difference Between Open Data and Public Data? https://blog.thinkdataworks.com/open-data-vs-public-data
- Yang, Y., Yuan, Z., Fu, X., Wang, Y., & Sun, D. (2019). Optimisation model of taxi fleet size based on GPS tracking data. Sustainability, 11(3), 731. doi:https://doi.org/10.3390/su11030731
- Zannat, K. E., & Choudhury, C. F. (2019). Emerging big data sources for public transport planning: A systematic review on current state of Art and future Research directions. Journal of the Indian Institute of Science, 99(4), 601–619. doi:https://doi.org/10.1007/s41745-019-00125-9
- Zhang, Z., He, Q., & Zhu, S. (2017). Potentials of using social media to infer the longitudinal travel behavior: A sequential model-based clustering method. Transportation Research Part C: Emerging Technologies, 85(October), 396–414. doi:https://doi.org/10.1016/j.trc.2017.10.005
- Ziemke, D., Kaddoura, I., & Nagel, K. (2019). The MATSim open Berlin scenario: A multimodal agent-based transport simulation scenario based on synthetic demand modeling and open data. Procedia Computer Science, 151, 870–877. doi:https://doi.org/10.1016/J.PROCS.2019.04.120