
ABSTRACT
There has been a growing interest in understanding the interdependencies between urbanisation and mental health. Although transportation in cities is complex and of foremost importance to support the mobility of goods and passengers, little is known about how it relates to individual psychological distress. This review aims to provide an up-to-date synthesis of research evidence about the influence of transport infrastructure and operational performance (congestion, delays and reliability) on mental health/wellbeing. It is structured around three main interacting concepts that determined the search/selection of articles: identification of the above-mentioned transport-related exposures; use of psychological and physiological validated instruments; and the outcome on mental health/wellbeing. Ultimately, 69 studies were identified involving an empirical quantitative focus that met the inclusion criteria. We summarise the instruments most reported in these studies and the findings linking transport indicators and psychological and physiological outcomes. Across the review, we identified evidence of the contribution of key transport infrastructure, congestion and delay indicators on negative affective states and psychophysiological distress. Regarding transport reliability, the scarce number of studies identified did not allow for drawing similar firm conclusions. We conclude by discussing some limitations and providing recommendations for future research and policy-making agendas.
Introduction
Recently, we have observed an increased role of mobility in the prevention and complementary treatment of mental disorders, primarily by promoting physical activity through active mobility (WHO, Citation2019). Such recent policies relied on evidence of the positive effect of physical activity on mental health – “a state of well-being in which the individual realises his or her own abilities, can cope with the normal stresses of life, can work productively and fruitfully, and is able to make a contribution to his or her community” (WHO, Citation2004, p. 60). However, individual mobility is associated with numerous other dimensions that may impact mental wellbeing: social inclusion, stress, cognitive workload, driving anxiety, or travel satisfaction. Activity-space representation of mobility has shown to have an explanatory power on specific mental disorders such as depression (Perchoux, Chaix, Cummins, & Kestens, Citation2013; Saeb et al., Citation2015). Ultimately, mobility-related attributes experienced by individuals in each of these space–time travel will impact their mental states. Nevertheless, similarly to active mobility, robust evidence of such a relationship is required for constructive and sustainable policy recommendations.
There has been a growing interest in building evidence on the relationship between mobility attributes, urban planning, and mental wellbeing and travel satisfaction. Traditionally, studies have focused on assessments of subjective wellbeing (De Vos, Schwanen, Van Acker, & Witlox, Citation2013). Yet, the increased availability of relatively affordable biosensing technologies has opened the door to more objective quantification of physiological states. Although some factors are expected to impact mental wellbeing (e.g. congestion in traffic, commuting delays, uncertainty and inadequate infrastructure), evidence has rarely been systematically evaluated.
This paper provides a systematic review of studies looking at the relationship between transport infrastructure and operations with mental health/wellbeing, with an emphasis on the physiological and psychological instruments used.
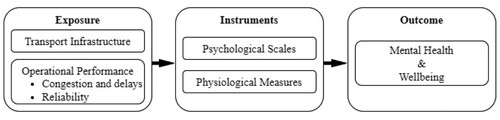
Our work is based on a conceptual framework (see ) composed of three key components: (1) the exposure, or nature of the mobility attribute from the perspective of the mobility provider (i.e. infrastructure and operational performance); (2) the instrument, which can rely on physiological and/or psychological measurements; and (3) the outcome, as an impact on mental health and wellbeing.
Figure 1. Conceptual dimensions and relationships guiding the review.
With this exercise, we aim to:
Provide an up-to-date synthesis of the empirical evidence on how transport infrastructure and its operational performance – namely congestion, delays and reliability – affect individuals’ mental health/wellbeing.
Describe the psychological and physiological measures used in the identified evidence.
Determine key indicators related to the transport infrastructure and its operational performance that have an impact on mental health/wellbeing, to inform future research and policy-making agendas.
Methodology
We considered empirical studies written in English from 1 January 2000 to 30 June 2021, published in full-length peer-reviewed journals. To inform design and eligibility criteria of this systematic review, we adopted a “PECO-approach” – by defining Population, Exposure, Comparator and Outcomes (Morgan, Whaley, Thayer, & Schünemann, Citation2018). We included studies with adult populations (healthy or unhealthy) examining the impacts of congestion, delays, reliability, and/or transport infrastructure on mental health/wellbeing. Comparisons were not specified as criteria. Studies had to provide at least one quantitative outcome measure for mental health/wellbeing – either a validated psychological instrument or an emotional- or stress-related physiological response. As “satisfaction with travel” is considered a domain-specific component of subjective wellbeing, we included studies where satisfaction components were measures of mental state (using validated scales).
Five electronic databases were searched: PubMed, ProQuest, Web of Science, Scopus and TRID. The search strategy followed our conceptual framework () and used search terms related to the 3-pillars structure: exposure (including general mobility and transportation terms, and more specific ones for both infrastructure and operational performance); instruments (including well-known psychological scales and specific search strings for physiological measures); and outcome (including terms covering general mental health/wellbeing, emotional and mood states). Full details of the strategy and search terms can be found in Appendix 1.
Following the Preferred Reporting Items for Systematic Reviews and Meta-Analyses (PRISMA) guidelines (Page et al., Citation2021), depicts the flow of information through the different phases of the review process. Initially, two authors independently screened the identified papers according to titles and abstracts for eligibility. Discrepancies were resolved by team discussion. Studies selected for full-text review were distributed among all the authors, who independently extracted data into a purpose-built, predesigned, and structured template. For the synthesis, studies were first grouped according to each transport-related aspect and then as a function of whether it used psychological or physiological measures.
Figure 2. PRISMA flow diagram.
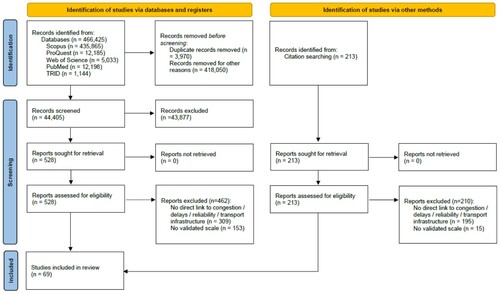
Each included study was also independently assessed by two authors using a quality checklist tool (Kmet, Lee, & Cook, Citation2004) that involves a rating (a score between 0 and 2, wherever possible) on 14 criteria (e.g. study design and sample size). If disagreements occurred, they were resolved through discussion. All studies were included regardless of their quality scores. The vast majority of included studies were classified as high quality (80%), and only 1 (1%) had a low-quality score (see Appendix 2).
Results
This section presents the main findings obtained from our systematic review. We firstly describe the instruments – psychological scales and physiological measures – used by the included studies. We then focus our attention on the empirical data relating each transport-related attributes – infrastructure, congestion and delays, and reliability – with changes in both types of instruments. The information provided sets the ground for identifying key transport-related indicators and on how evidence should be translated to practice.
Instruments used for mental health/wellbeing assessment
Psychological scales
The mental health-related psychological constructs considered in the reviewed papers are affective states (emotions and mood); wellbeing and satisfaction with life or travel; stress and mental workload; and mental health disorders. Appendix 3 provides an overview of the psychological instruments used.
The most frequently considered emotion was anger. The State-Trait Anger Expression Inventory – STAXI (Spielberger, Sydeman, Owen, & Marsh, Citation1999) is the most established psychographic instrument to measure state and trait anger (Fairclough & Spiridon, Citation2012). The Driving Anger Scale – DAS (Deffenbacher, Oetting, & Lynch, Citation1994) measures anger in the context of different traffic situations and can reveal how angry people generally get in traffic as well as when provoked by different kinds of traffic situations. The Driving Anger Expression Inventory – DAX (Deffenbacher, Lynch, Oetting, & Swaim, Citation2002) measures to what degree and in what form drivers express anger to other drivers and differentiates between three forms of aggressive expression: verbal, physical, and using the vehicle to express anger. Anger and driving anger have most frequently been assessed in relation to an outcome of congestion, but also in relation to specific traffic infrastructure. Like the STAXI for anger, the State-Trait Anxiety Inventory – STAI (Spielberger et al., Citation1999) measures a general state and a trait component of anxiety. The Driving Situations Questionnaire (DSQ) – Anxiety measures anxiety specifically in driving situations (Taylor & Paki, Citation2008). Several other instruments have additionally been used to measure driving anxiety and avoidance.
Several studies measured a whole spectrum of different moods, which are mostly understood as more diffuse and longer-lasting affective states – as compared to more specific and shorter termed emotions (Niven, Citation2013). Nevertheless, there is an overlap, as state anger, for example, is also measured as part of the University of Wales Institute of Science and Technology (UWIST) Mood Adjective Checklist (Matthews, Jones, & Chamberlain, Citation1990). While most reviewed studies used instruments based on adjective lists to assess the current mood (e.g. Global Mood Scale – GMS, Brief Mood Introspection Scale – BMIS), one study used a non-verbal pictorial assessment, Self-Assessment Manikin – SAM (Ihme, Unni, Zhang, Rieger, & Jipp, Citation2018; Zhang, Ihme, & Drewitz, Citation2019) and another used a method related to Kahneman’s Day Reconstruction Method – DRM (Kahneman & Krueger, Citation2006; Morris & Hirsch, Citation2016). Also, in terms of mood, we find more specific traffic situation-related instruments, such as the short Travel Mood scale (TMS) and the more comprehensive Driver Behaviour Inventory (DBI), which assesses different emotions while driving.
In contrast to emotions and mood, subjective wellbeing and general satisfaction with life relate to people’s experiences of affect over a long period of time (Niven, Citation2013). Satisfaction with travel is considered a domain-specific component of subjective wellbeing. The most established scale to measure travel-related wellbeing is the Satisfaction with Travel Scale – STS (Ettema et al., Citation2011). Yet, the instrument has sometimes been adapted (He, Thøgersen, Cheung, & Yu, Citation2020) or only used with a focus on the affective dimension of wellbeing while travelling (Lunke, Citation2020).
Several scales assessed the self-reported level of stress and mental workload in general as well as specifically in driving situations. We differentiate between instruments that measure non-specific longer-lasting stress understood as a part of mental health/wellbeing (Cohen, Kamarck, & Mermelstein, Citation1983; Kessler et al., Citation2002), and those focusing on task-stress in a performance situation (e.g. during or just after a driving simulator task). Task-stress can be measured in detail by the Dundee Stress State Questionnaire – DSSQ (Matthews, Szalma, Panganiban, Neubauer, & Warm, Citation2013), which focuses on different facets of task engagement, distress, and worry.
Some instruments focus on stress as typically perceived in driving situations, while others focus on stress when using a public transport. Additionally, Coping Inventory for Task Stress – CITS (Matthews & Campbell, Citation1998) and Driver Coping Questionnaire – DCQ (Matthews, Desmond, Joyner, Carcary, & Gilliland, Citation1996) focus on different strategies to cope with (driver) stress, and both differentiate between task-, emotion-focused coping, and avoidance.
Mental workload is related to a specific task and is understood as the difference between demanded cognitive resources and the cognitive resources available to solve the task. The NASA-Task Load Index – NASA-TLX (Hart & Staveland, Citation1988) and the Rating Scale Mental Effort – RMSE (Zijlstra & van Doorn, Citation1985) are among the most frequently applied (in simulator studies) to measure self-reported mental workload (Widyanti, Johnson, & de Waard, Citation2013).
Regarding mental disorders, short forms of screening instruments like the General Health Questionnaire GHQ-12 (Goldberg et al., Citation1997) and Short Form Health Survey SF-12 (Knies, Citation2014) have been used for the probability and/or severity of a mental disorder. Two screening instruments have been used: for depression, 10-item Center for Epidemiologic Studies Depression – CESD-10 (Andresen, Malmgren, Carter, & Patrick, Citation1994) and for burnout, Maslach Burnout Inventory – MBI (Maslach, Jackson, & Leiter, Citation1997), each one only in a single study.
Physiological measures
The stress response triggers a variety of cognitive, emotional, and biological processes that alter the body’s physical state either directly (and automatically) through the autonomic nervous system (ANS) or neuroendocrine pathways; or as a consequence of the enacting behaviour (Ulrich-Lai & Herman, Citation2009). Most studies used the physiological measures to evaluate the impact of congestion/delay (largely on driving simulators), and fewer for transport infrastructure or reliability (Appendix 4 provides detailed information on used measures).
The ANS is a peripheral physiological system responsible for modulating a wide variety of body systems, including cardiovascular, respiratory, and temperature (Hamill, Shapiro, & Vizzard, Citation2004). It is made up of a complex network of neurons for interoception, as well as activation and relaxation response (sympathetic and parasympathetic pathways, respectively). Despite its general-purpose nature, the ANS assessment is often used to measure stress and emotional response (Critchley & Harrison, Citation2013; Mauss & Robinson, Citation2009; Öhman, Hamm, & Hugdahl, Citation2000). Commonly used measures of ANS activation include electrodermal activity (EDA) and cardiovascular response – heart rate variability (HRV) being more appropriate than heart rate (HR) alone (Camm et al., Citation1996). Hence, most studies included some ANS evaluation (EDA being the most used, followed by HRV and HR). Some studies used measures that are less specific of psychological/emotional distress and more influenced by other factors – such as thermal imaging and respiratory/ventilatory parameters (Stemmler, Citation2004).
The human brain is at the heart of our homeostatic control and the way we react to environmental stress. Part of this reactivity is advantageous in the short-term but it could become maladaptive in the long run (McEwen & Gianaros, Citation2010). Such a central role of the brain in coping with stress reinforces the idea that physiological correlates of psychological distress are more likely found in the brain (Buck, Citation1999; Izard, Citation2007; Panksepp, Citation2007). Electroencephalography (EEG) and functional near-infrared spectroscopy (fNIRS) are popular, non-invasive, and well-established methods for analysing the human brain’s signals (generated by the firing of neurons or by cerebral oxygenation, respectively). Of the studies that used EEG and fNIRS, all except one used a simulated environment (or visual stimuli) in a controlled laboratory-based setting. Di Flumeri et al. (Citation2018) took advantage of the portability of the EEG system (and of the mobile eye-tracking) to run a real driving experiment, performed under different traffic conditions (rush hour and off-peak) and along different road types (main and secondary streets).
Psychological stress also primes behaviours that could be assessed to unravel one’s emotional or cognitive state. The facial expression evaluation has shown utility in the assessment of discrete emotional reactions (Ekman, Citation1993; Russell, Citation1994), explaining its use in some studies. Changes in gaze patterns of drivers were also investigated to explore how congestion affects selective attentional processing. Acute stress can also disrupt cognitive performance or elicit errors, particularly when environmental demands are perceived as taxing or potentially exceeding one's own capacity (Calvo & Gutiérrez-García, Citation2016). Some papers considered cognitive tasks either to evaluate driver’s mental workload, frustration levels, or to assess the impact of unpredictability on motivation.
Finally, the neuroendocrine stress response is vital to control the energy metabolism required for health maintenance and, despite several limitations, the use of salivary cortisol as an index of psychological stress is widespread (Hellhammer, Wüst, & Kudielka, Citation2009). Two studies from the same group asked participants to collect their own saliva samples and, by comparing levels elicited after a daily commute routine against a non-workday at home, they investigated the impact of transport reliability and infrastructure on mental wellbeing.
Relationship between the different transport-related exposures and mental health/wellbeing
Transport infrastructure
Psychological scales
Good public transportation accessibility – as living up to 500 m from a bus stop (Lades, Kelly, & Kelleher, Citation2020) or within a short walking distance from home/work to the station (especially among bus travellers with long commutes) (Lunke, Citation2020), contributed to greater satisfaction. Residents around light rail stations (with easy access and good service) also showed greater satisfaction with travel (Cao, Citation2013). Within public transport stations, walking distance and level of service of the queuing and walking areas (degrees of per capita occupancy of space) can influence passengers’ perception of time, and thus their anxiety, fatigue, and satisfaction (Teng, Pan, & Zhang, Citation2020). Additionally, waiting time for public transport transfers negatively affected travel satisfaction (Gao, Rasouli, Timmermans, & Wang, Citation2017; Lunke, Citation2020; Wener, Evans, Phillips, & Nadler, Citation2003). An experimental study investigating stress of train commuters before and after a major public transport improvement, reported that reduced trip-time (due to a new direct service) was the main contributor to stress reduction (Wener et al., Citation2003). Further transport infrastructure-related stressors in (Mexico) public transport were the vehicles’ comfort – and maintenance-related characteristics, as well as the road networks’ characteristics. Here, stress increased with small, old, dirty buses in a bad state, with little legroom, few/uncomfortable seats and the bad state of roads (Dorantes-Argandar, Rivera-Vázquez, & Cárdenas-Espinoza, Citation2019).
As for driving, the quality of road infrastructure – for example roads with potholes, irregular or unpaved (Dorantes Argandar, Tortosa Gil, & Ferrero Berlanga, Citation2016), narrow roads and tight corners (Rodrigues, Kaiseler, Aguiar, Cunha, & Barros, Citation2015) – influenced driving stress. Moreover, people with the highest anger scores were living in neighbourhoods with narrower and more mountainous roads (Hernández-Hernández, Siqueiros-García, Robles-Belmont, & Gershenson, Citation2019). Intersection design (Samuel et al., Citation2019) and the presence of (working) lights at intersections (Dorantes Argandar et al., Citation2016) were also influencers of the emotional states of motorcycle riders and car drivers, respectively. Other identified road-related variables were the presence of road signs (Høye, Fyhri, & Bjørnskau, Citation2016); adaptive signal control technology, which in turn corresponded with higher speeds and fewer stops (Khattak, Fontaine, & Boateng, Citation2018); and challenges like roadworks, difficult junctions, and lack of car parking (Lades et al., Citation2020; Pykett et al., Citation2020). Interestingly, a road sign with the text “share the road” (with a picture of a smiling cyclist and a car) improved the interaction between car drivers and cyclists (Høye et al., Citation2016).
It is noteworthy that the effect size of transport infrastructure depends on the scale of the analysis and used measures. For instance, a study in California using built and natural environment data at the block-group level and a large health interview survey did not find a significant relationship between mental wellbeing and job accessibility by public transport, percentage of jobs near public transport stations, street network density, or street intersection density (Schoner et al., Citation2018).
Regarding active travel and travel satisfaction, relationships with transport infrastructure were also found. An auto-oriented environment was found to decrease commute wellbeing for cyclists (Smith, Citation2017). A study in Delft and Atlanta found that the top stressors for cyclists were the presence of motor vehicles; poor pavement condition; and poor infrastructure (Gadsby, Hagenzieker, & Watkins, Citation2021). The most stressful factor was the absence of bicycle facilities; components like sight distance or low number of travel lanes (Gadsby et al., Citation2021); but difficult junctions (Pykett et al., Citation2020) were also relevant.
Satisfaction with travel is not only affected by objective trip characteristics, but also by moods (feeling happy or relaxed) – and, for example, walking safety at night was related to travel satisfaction (Gao et al., Citation2017). Glasgow, Le, Geller, Fan, and Hankey (Citation2019), studying mood during travel with an experience sampling method app, reported lower mood when individuals travelled through places with a higher “Walk Score®” (versus higher when individuals travelled through natural environments). The negative effect of walkability is probably related to the fact that walkability is higher in dense urban environments (with environmental stressors, such as noise and air pollution).
Several intercorrelated neighbourhood satisfaction factors were associated with mental health/wellbeing (Leslie & Cerin, Citation2008). These include safety and walkability (related positively with infrastructure for walking/traffic safety, but negatively to traffic load); social network (related positively with street connectivity, but negatively with traffic load); and traffic and noise. Older people who are more satisfied with walking and public transport infrastructure and services, experienced higher social inclusion, physical health, and psychological wellness (He et al., Citation2020). Interestingly, street connectivity was positively correlated with a greater social network, which in turn has a positive association with mental health (Leslie & Cerin, Citation2008). Chng, White, Abraham, and Skippon (Citation2016) found that individuals with good public transport connectivity reported fewer symptoms of psychological distress.
Transport mobility has been found to be related to subjective wellbeing through the mediating variables of environmental mastery, positive relations with others, and self-acceptance (Vella-Brodrick & Stanley, Citation2013). This would justify expenditure in improving transport mobility through infrastructure and increased service provision. Feng, Feng, and Astell-Burt (Citation2017) also suggest that investments in walkability and public transport infrastructure are required to promote (mental) health – as people who more frequently use public transport tend to report better mental health/wellbeing. However, frequent public transport users who perceived the public transport infrastructure to be lower in quality reported poorer psychological outcomes.
Physiological measures
The impact on cyclists of bicycle facilities and related road infrastructure was the main target of studies using ANS measures (Caviedes & Figliozzi, Citation2018; Cobb, Jashami, & Hurwitz, Citation2021; Doorley et al., Citation2015; Fitch, Sharpnack, & Handy, Citation2020; Teixeira et al., Citation2020; Werner, Resch, & Loidl, Citation2019).
Increased EDA stress-response in cyclists was related to factors involving motorised vehicles (being too close to the bicycle lane; and interference at intersections), pedestrians (invading the bicycle lane or with unexpected movement that conflicts with cyclists’ trajectories) and bicycle facilities (when lanes were narrow, rough, unpaved, or noisy) (Caviedes & Figliozzi, Citation2018; Teixeira et al., Citation2020). Cycling on physically segregated facilities (off-street) was associated with less stress than on shared roadways – except if cyclists were confined to a narrow lane or “sandwiched” between parked and motorised vehicles (Caviedes & Figliozzi, Citation2018). Another study (Werner et al., Citation2019) compared EDA response of cyclists as a function of different infrastructures (e.g. dedicated/mixed ways; few/many road crossings); but found no significant associations. Finally, in a more recent study, greater stress levels were observed while riding in the absence of a bicycle lane and with high vehicular flows – inexperienced cyclists being the ones with lower levels of comfort and yielding higher EDA values (Cobb et al., Citation2021). Notably, the riders showing more stress were also the ones more prone to deviate from the centre and with greater lateral position variations.
Stress-related cardiovascular response of cyclists was also investigated (Doorley et al., Citation2015; Fitch et al., Citation2020). In one study, among five road environments tested, only the local road with no centreline and low car speed/volumes consistently provided greater HRV – suggesting that “bicycle boulevard” designs (where traffic is calmed and bicyclists are given travel priority) may reduce stress bicycling environments (Fitch et al., Citation2020). For roads that provide important connections for vehicles (collectors/arterials), reducing outside traffic lane widths and increasing bike lane widths are likely to reduce bicyclist stress. Furthermore, another fully controlled experiment (Doorley et al., Citation2015) found a linear trend between cyclists’ HR and busy roads without a bicycle lane or roundabouts where the cyclist continued straight on.
An on-road car driving experiment took place where participants had to drive through two real traffic corridors – with and without adaptive signal control technology (ASCT), while their HR was measured (Khattak et al., Citation2018). The results showed higher speeds and fewer stops on the ASCT corridor relative to the non-ASCT corridor, accompanied by a significant reduction in driver HR over the ASCT corridor.
In a study with HRV assessment on bus drivers, urban planning issues – narrow roads and tight corners, were also considered stressors (Rodrigues et al., Citation2015). The only non-cycling experiment with EDA assessed public transport users travelling with several biosensors – and reported that waiting for the bus (likely due to fewer buses) increased stress levels, although examining the EDA readings of only one person (Castro, Guevara, & Jimenez-Molina, Citation2020).
Finally, one study (Wener et al., Citation2003) measured train commuters’ salivary cortisol and applied a proofreading task in response to an improvement in public transport infrastructure (a connection to existing tracks and no need to transfer to another train to reach Manhattan), over a 3-years longitudinal study (a caveat being the high drop-out rate). They observed that both salivary cortisol and motivation task scores of users before and after this new infrastructure was built showed strong differences, this being a rare case where physiological data was compared pre- and post- a major public transport intervention.
Congestion and delays
Psychological scales
Associations between congestion/delays and psychological variables related to mental health/wellbeing have been addressed in several studies. They either examined affective and cognitive states that may arise directly in or after the congestion – such as higher workload/stress (Teh, Jamson, Carsten, & Jamson, Citation2014), anger and frustration (Ihme et al., Citation2018; Parker, Lajunen, & Summala, Citation2002); or the relationship between congestion and long-term states, including mental health/wellbeing (Smyth et al., Citation2011; Wang, Rodríguez, Sarmiento, & Guaje, Citation2019).
Most studies focused on car drivers. Short-term effects were often measured in driving simulator experiments, where congestion was, for example, used as part of specific scenarios to induce stress, anger, anxiety, or aggression; combined with self-reports to assess if those scenarios successfully induced such desired effects (Zhang et al., Citation2019). Other studies (Brewer, Citation2000; Rodrigues et al., Citation2015) induced stress or frustration to examine its effect on driver performance – either generally or for specific groups of drivers (e.g. bus drivers).
In a simulator study (Fairclough & Spiridon, Citation2012) frustration was induced by preventing individuals from reaching their destination on time due to congestion at the beginning and end of the route. The results showed a significant increase in self-reported anger and a decrease in perceived control comparing pre- and post-task answers (Fairclough & Spiridon, Citation2012). Another simulator experiment included constraints in scenarios to generate time pressure during a ride in a highly automated vehicle (Techer et al., Citation2019) – participants’ mood/emotional state deteriorated when facing congested conditions, regardless of whether they were under time pressure. Similarly, more results support that after simulated driving in slow traffic, participants express increased anger and stress (Emo, Matthews, & Funke, Citation2016). Although they found that anger induced by congestion did not predict risky behaviours, other simulation experiments reported that road congestion around railway level crossings increased drivers’ frustration, making them more prone to risky behaviour (Larue, Blackman, & Freeman, Citation2020). Moreover, satisfaction with travel was also affected by traffic conditions as heavy traffic was associated with a less positive evaluation (Ettema, Gärling, Olsson, Friman, & Moerdijk, Citation2013; Lades et al., Citation2020).
Teh et al. (Citation2014) examined the effects of traffic density on self-reported workload and found that driver workload increased with traffic flow up to moderate levels and levelled off beyond that. Furthermore, participants scored high for frustration when the slow lane had vehicles moving faster and less congested than the fast lane. Another study found that drivers’ stress increased (and satisfaction with the chosen route decreased) as traffic complexity was greater (Ringhand & Vollrath, Citation2019).
Another study focusing on the interaction between traffic situations (including congestion) and emotions, presented respondents with “realistic and not frequent” descriptions of hypothetical traffic scenarios – and participants reported higher levels of anger and anxiety for higher traffic density and time pressure (Roidl, Frehse, Oehl, & Höger, Citation2013). Experienced drivers reported both less anger and anxiety, while those who reported more intense anger and anxiety did not present it more frequently throughout the experiment. Furthermore, it was found that high traffic density was likely to lead to more impatient driving, triggering anger in other drivers (Parker et al., Citation2002). Also, while older drivers were less reactive to other drivers, males reacted significantly more to most anger-provoking situations than women.
Deffenbacher (Citation2008) did not find a significant relation between anger and its expression in urban (ordinary and rush-hour traffic) versus rural (open country roads) areas, which was expected due to higher levels of congestion in urban areas. Men driving in those reported less driving anger than other groups; yet they reported more aggressive and risky behaviour than women. In a rural community sample, driving in heavy traffic was among the situations generating anxiety the most; consequently, it was highly avoided by drivers (Taylor & Paki, Citation2008). Stress and higher mental workload (as an outcome of congestion) have more extensively been examined for professional drivers, especially bus drivers. Brewer (Citation2000) investigated road anger motivations and activation contexts by comparing bus drivers with non-bus drivers. It was found that bus drivers felt less impatient and irritated and overtook less frequently than non-bus drivers during peak-hour, but the latter felt overall less tense than bus drivers. Also, although both groups experienced similar levels of driving anger, bus drivers were less likely to engage in aggressive behaviours; indeed, they tended to feel more irritated about passengers than about other road drivers. Among non-bus drivers, women tended to report more impatience during peak-hour compared to men (Brewer, Citation2000). One study examining how metro drivers perceived workload (Huang, Li, Liu, Zhu, & Zhu, Citation2019), found that drivers’ workload was mainly affected by the complexity of the driving environment (associated with peak passenger flow) and long-term accumulation of operations.
Another study (Rodrigues et al., Citation2015), with both self-reported and physiological assessment of stress in public transport bus drivers, indicated that 41% reported stress due to events impacting time schedule (e.g. congestion) – with the city centre (dense urban area) being marked as more stressful. While congestion was found to impact the quality of life and mental health in general (resulting in increased stress, tension, and anxiety for those living in congested areas), this effect was particularly stronger for public transport drivers and their families (Nadrian et al., Citation2020). Moreover, the frequency of job-related problems – including high-density road traffic, was also associated with public transport operators’ burnout (Cunradi, Chen, & Lipton, Citation2009).
Considering drivers in general, Morris and Hirsch (Citation2016) measured the intensity of happiness, sadness, fatigue, and stress of 14,000 U.S. drivers. Instead of observing congestion during trips, they relied on indicators (time of the travel, population of the city and city centre vs. suburban residential location). They found that drivers had a slightly less positive mood when driving in the largest cities between 5:00pm-6:00pm (shorter peak hour), but no significant effect was found when using any other definition of peak period (Morris & Hirsch, Citation2016). While their findings reveal limited effects of congestion on emotions, they show the difficulty in assessing emotions and level of congestion at the same time based only on classic self-report measures.
Another set of studies focused on the persistent effects that individuals experience due to congestion. Examining the influence of urban environment on wellbeing, it was found that living in cities with high congestion was associated with lower mental wellbeing (Smyth et al., Citation2011). Living in a more congested city was associated with higher levels of anger (Li, Yao, Jiang, & Li, Citation2014) and related to lower life satisfaction among bus/coach commuters, despite lower mental distress for bus/coach commuters (Chng et al., Citation2016). Road traffic congestion also significantly decreased commute wellbeing for cars and public transport (Smith, Citation2017). Moreover, travelling in congested public transport vehicles (crowded) also impacted negatively on commuting wellbeing (Smith, Citation2017). Survey data from eleven Latin American cities (Wang et al., Citation2019) found commuting time during congested conditions positively related to the probability of being diagnosed with depression – with public transport users having a lower likelihood than drivers.
With the aim of automatically detecting frustration, Ihme et al. (Citation2018) conducted a simulation experiment to trigger frustration (goal-blocking and time pressure) with red lights, construction sites, slow lead cars and pedestrians slowly crossing the street. Frustrating drives were rated as more negative and more arousing than the non-frustrating drives. The work by van Hooff (Citation2015) found that the occurrence of a stressful delay during the work-home commute had a negative effect on employee recovery status after returning home (but not at the end of the evening) seeming to be relatively short-lived.
Friman (Citation2010) examined affective reactions to waiting for public transport (namely bus) and their impact on overall service satisfaction. Based on text descriptions of waiting scenarios, positive and negative waiting experiences produced consistently more affective reactions and changes in the level of satisfaction than neutral experiences, while in-process waiting (during the service) seemed to be more acceptable than pre-process waiting (before service started).
Lunke (Citation2020) investigated how different public transport journey characteristics affected commute satisfaction, including distance to stations, need to transfer, and associated waiting time. Waiting time and reliability were more important than short distances and direct routes, although their effects were stronger on long commutes. This suggests that providing more direct public transport routes, efficient transfers and improving public transport can improve satisfaction and make public transport the preferred transport mode for commuters. However, potential confounding variables (e.g. congestion, seat availability, and commuters’ attitudes toward public transport modes) were not considered in the study.
He et al. (Citation2020) considered walking, rail, bus, and minibus travels to study the correlation between satisfaction with transport systems (impacted by congestion/delays) and social inclusion and wellbeing in the elderly. Although causality was not implied, it proved to be (positively) statistically significant.
Teng et al. (Citation2020) focused on mobility within metro stations, under the hypothesis that passengers’ psychological state could be affected by space congestion, slow walking speed, and increasing queue length. They observed that an enhanced time-lapse effect reflected an increase in anxiety and decrease in service satisfaction (also observed when the queuing time or walking distance of a station exceeded a certain value).
All in all, most reviewed studies provide evidence that congestion and delays are related to negative affective states and mental health problems, the latter especially for professional drivers. They are also a source of road anger and frustration, so that they are not only likely to impact mental health/wellbeing, but also traffic safety (Wickens, Mann, Ialomiteanu, & Stoduto, Citation2016).
Physiological measures
The impact of congestion and delays on mental health/wellbeing have been explored mostly by ANS (cardiac or skin conductance responses) and EEG measures; and predominantly using car simulated driving – with only a few performing real on-road experiments.
One experiment combined three simulated driving scenarios and a similar on-road experiment to study the effect of delay (due to frequent red lights), traffic congestion and surrounding vehicle interference (Yan, Wan, Qin, & Zhu, Citation2018). Drivers’ beta-band on EEG showed a significant increase when they felt angry in all conditions (likely due to arousal); while delta-band activity (likely reflecting relaxation) reduced when the driver was angry on-road (but not in the simulation). Drivers’ cardiac response showed significant volatility in the three induced delay scenarios, being more sensitive (together with EDA) after red light encountering. Overall, drivers’ stress-related cardiac response increased in reaction to adverse traffic events, being greater on-road than in the simulation. Another EEG study exploring post-congestion effects also observed changes in beta-band in brain areas associated with the perception of driving speed (Li et al., Citation2020) – likely related to a more aggressive attitude in the post-congestion situation and decreased perception of speed.
Di Flumeri et al. (Citation2018), using another type of EEG measure (usually associated with mental workload) reported a significant brain activation under real (on-road) settings in rush hours when compared to normal traffic (Di Flumeri et al., Citation2018). These findings support the idea that congestion leads to higher mental workload (eye tracking and self-reported measures were not as sensitive as EEG). Left-hemispheric EEG activation – often associated with anger and worry, was found during a simulated traffic jam (including a delay) scenario (Fairclough & Spiridon, Citation2012). In the same condition, both HR and facial muscle activity were significantly elevated, consistent with a negative emotional and stress-related response. Halim and Rehan (Citation2020) used the spectral power of differential hemispheric asymmetry across five frequency bands, to distinguish brain dynamics as a response to stress stimuli. A drop in alpha rhythm power and initial spike in beta rhythm with driving speed was observed, indicating that subjects had to be more attentive to complete the driving task under time pressure (but with an added level of stress they lost attention).
In an experiment evaluating fNIRS response to frustrating (road blocking) and non-frustrating driving simulator scenarios, brain areas with higher activity in the former scenario were in line with the other neuroimaging literature on frustration; and related with cognitive appraisal, impulse control, and emotion regulation processing (Ihme et al., Citation2018).
Studies more focused on the cardiovascular responses of drivers facing urban traffic congestion contexts or frequent lane changing (Cardone et al., Citation2020; Qi, Wen, & Wu, Citation2015; Qi, Wen, Wu, & Qin, Citation2017) revealed changes in HR, HRV or electrocardiography (ECG) stress levels, reflecting a rapid sympathetic activation as observed in other stressful situations. The results on questionnaires about drivers’ feelings, recorded thermal features and respiration patterns as a function of congestion, further corroborated the cardiac findings, robustly indicating high-stress levels. Similar evidence (with EDA, respiration/ventilation, HR and HRV) was gathered by another study (Singh, Conjeti, & Banerjee, Citation2013) investigating busy driving on-road situations (including traffic congestion).
In contrast to other environmental variables such as weather, Rigas, Goletsis, Bougia, and Fotiadis (Citation2011) indicate that heavy traffic did not have a significant contribution to stress classification based on ECG, EDA, or respiration patterns. However, the limited recordings and small sample size of this work compromise their conclusion. In fact, another study with limited sample size and confounding variables found the opposite – traffic jams significantly affected the stress level of drivers as measured by EDA (Bitkina, Kim, Park, Park, & Kim, Citation2019). Moreover, using an on-road driving experiment where EDA was considered in addition to cardiac activity, Wang and Guo (Citation2021) concluded that foot EDA was able to predict stress in busy roads (congestion). Similar conclusions could be drafted from Dogan, Bogosyan, and Acarman (Citation2019), where EDA stress when driving an electric car was consistent with the ones identified in a post-driving survey.
Studies have also focused on the relationship between congestion/delays and mental wellbeing in public transport (Castro et al., Citation2020; Huang et al., Citation2019; Rodrigues et al., Citation2015). Contrary to previous results, a thorough analysis of HRV in bus drivers (Rodrigues et al., Citation2015) was not conclusive in showing a statistically different distribution for tagged stressful events, such as traffic congestion (presumably due to higher signal noise in real-world). In a study evaluating metro drivers (Huang et al., Citation2019), both HRV and reaction time were collected for two driving modes (manual/automatic) and three daily shifts. Although the physiological indicators and performance had a positive correlation with fatigue, the same was not obvious in reaction times. Whilst the arousal of biological rhythms in the morning relieved fatigue, the large amount of information processing and accurate judgement required during peak passenger flow and associated time pressure led to increased workload and fatigue. The effect of delays was also studied for bus and metro commuters (Castro et al., Citation2020) with EDA and HRV. The authors observed that waiting for the bus increased the probability of feeling sad, with EDA showing a significant association with self-reported emotions.
Finally, two studies have focused on cycling using EDA (Caviedes & Figliozzi, Citation2018; Werner et al., Citation2019). In one study, EDA captured increased stress responses during peak hours and when the bike route was blocked (by cars or people) (Caviedes & Figliozzi, Citation2018). However, the latter experiment found no significant correlation between stress and traffic load (Werner et al., Citation2019) – possible reasons for this include cognitive biases, memory errors and/or small sample size.
Reliability
Psychological scales
We now focus on reliability – i.e. the probability of service failure from the user perspective (as opposed to the operator’s). Depending on the transport mode, different variables that concern travellers can be considered: travel/queueing time in personal transportation or waiting time, boarding and alighting time, seat availability and public transport transfer time. Looking at the distribution of such variables helps in estimating operational reliability, which is often a factor of interest to satisfaction/wellbeing/stress scales since its perception can lead to behavioural change or impact mental health/wellbeing. Associations between reliability and psychological scales have been considered in 10 studies. We can classify these into three reliability measures: direct, combined and proxy measurements.
Few studies directly measured reliability, but surprisingly show strong evidence on the link between predictability and stress – both in commuting settings (Evans, Wener, & Phillips, Citation2002; Sposato, Röderer, & Cervinka, Citation2012; Wener et al., Citation2003) and for professional drivers (Rodrigues et al., Citation2015). Evans et al. (Citation2002) assessed predictability of travel time, perceived stress and salivary cortisol to investigate the role of predictability in commuter rail. All stress-related assessments were related to more unpredictable commutes. Their small sample, limited collection of control variables and absence of an objective reliability measure led the authors to classify its findings as preliminary. Wener et al. (Citation2003) studied new rail commuting options with an ecological experiment. They found that riders on a selected new rail line had lower stress levels, mediated by reduced travel time. Yet, the predictability of the trip was also inversely correlated with stress regardless of changing to the new or staying with the old commuting option. Later, Sposato et al. (Citation2012) extended this to other modes, and through an online survey investigated the relative impact of predictability on commuting stress. They collected self-reported measures and proposed a conceptual model of commuting stress. Similarly to Wener et al. (Citation2003), the authors sustained that predictability is a measure reflecting temporary incidents, which forces the commuter to adapt; rather than being a constant feature in the commuting journey (such as control). Yet, their findings also point to an interactive (negative) effect of predictability and control on commuting stress. Rodrigues et al. (Citation2015) focused on stress responses of a small sample of bus drivers to self-reported and self-labelled events, including deviations to time schedules. Despite not including direct reliability measures, nor relying on a causal model (rather on statistical tests), the work pointed to the negative impact of unreliability sources on stress, along with a unique showcasing of longitudinal (detailed spatial and temporal) data collection.
Another thread of research (De Vos, Schwanen, Van Acker, & Witlox, Citation2019; He et al., Citation2020; Vella-Brodrick & Stanley, Citation2013) combined reliability measures with other travel attributes and focused on its relationship with subjective wellbeing (rather than trip-specific stress). Vella-Brodrick and Stanley (Citation2013) relied on an Australian survey to validate the hypothesis that psychological measurements mediate transport mobility and subjective wellbeing. Perceived reliability was an exposure considered for estimating transport mobility. Yet, the combination of reliability with other exposures into a single variable in the analysis prevented the identification of isolated effects of potential triggers. He et al. (Citation2020) specifically considered a satisfaction score for the service reliability of different modes of transport (rail, bus, and minibus) and for the reliability of the bus information provision system. Such measures were combined into a single (average) measurement of transport satisfaction which was then integrated into a Structural Equation model to estimate the effect of satisfaction with the most commonly used transport systems on the wellbeing of the ageing population. They found that an intermediate effect of social aspects should be considered when modelling the relationship between transport and mental wellbeing. De Vos et al. (Citation2019) brought the dimension of individual decision-making by testing (and confirming) the hypothesis that a positive evaluation of walking and cycling trips (including reliability aspects) positively affects the attitude towards the respective mode (which then positively impact on choosing that mode in leisure trips).
The third thread of reviewed research (Fan, Chen, & Zhang, Citation2021; Larue et al., Citation2020; Lunke, Citation2020) relied on proxy measures of reliability. Larue et al. (Citation2020) focused on congestion at railway level crossings and its impacts on drivers’ mood and potentially (risky) behaviour. Insights about how reliability decreases frustration levels were obtained (despite a small sample size) – once drivers got used to extended waiting times (low variability) at a crossing, they were more likely to violate the crossing rules; and reducing waiting times did not result in an immediate return to baseline behaviour. Lunke (Citation2020) measured (Oslo) public transport commuters’ satisfaction through a cross-sectional Stated Preference survey. Direct reliability measures were not considered in the survey since the user's last trips were the object of the survey. Nevertheless, through ANOVA, perceived service frequency seemed to have no significant effect on commuter satisfaction. Fan et al. (Citation2021) investigated travel happiness for different modes through a web-based survey. Perceived trip duration together with arrival time flexibility was collected considering a recent trip performed by the respondents, but the latter was not significant in the quantitative (regression) analysis.
Physiological measures
We only found two studies that directly measured reliability; and another study (Wener et al., Citation2003) that considered aspects of reliability together with some infrastructure changes. In the first study, greater stress levels measured by HRV monitoring were reported by bus drivers facing unpredictable situations related to schedule changes (Rodrigues et al., Citation2015). In the other one, both salivary cortisol and cognitive effort (with a proofreading task) of train commuters were measured. It was found that rail commuters who perceive their daily commutes as more unpredictable experienced greater stress (elevations in salivary cortisol), while the motivational index (provided by the proofreading task) was not significantly related to commute unpredictability (Evans et al., Citation2002).
Discussion
Summary of evidence
How individuals use transportation systems is critically dependent on its attributes and, while their influence in shaping travel behaviour has been a central focus for research, their consequent impact on mental health/wellbeing has received less attention. Our review aimed to fill this gap and to provide insights for the future role of transport attributes in mental health/wellbeing. To help translating the evidence into their use for policy-making and research, we compiled in a list of key transport-related indicators. Although not exhaustive, it captures the most relevant findings on how transport infrastructure and operational performance relate positively or negatively (or if no association/correlation was found) with mental health/wellbeing.
Figure 3. Key indicators with an impact on mental wellbeing/health.
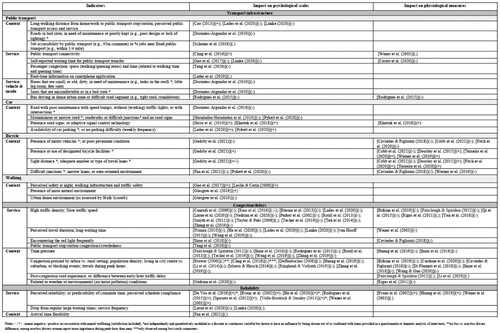
Reviewed studies on transport infrastructures that used psychological scales focused either on stress/anxiety or levels of satisfaction with travel; whereas those reporting physiological measures mainly targeted cyclists. Our summary addressed distinctively the different travel modes. Regarding public transport, shorter walking distances to stops, greater connectivity, shorter waiting time in transfers, increased level of service of the queuing and vehicles’ comfort- or maintenance-related characteristics contribute to higher levels of self-reported mental wellbeing. Both psychological and physiological stress-related effects were also observed for bus drivers in narrow roads and tight corners; and for passengers waiting for the bus. Regarding car drivers, relevant self-reported factors include the quality/maintenance of road infrastructure, width of the roads and availability of parking; whereas, higher speeds and fewer stops induced stress-related biosignals. Notably, the presence of road signs or ASCT showed a positive impact on car drivers in both psychological and physiological assessments. Regarding active travel, several transport infrastructures variables were found to be perceived as stressful – including the presence of motor vehicles, poor pavement condition, absence of bicycle facilities and difficult junctions. Both psychological and physiological cyclists’ stress were related to other traffic being too close or on the bicycle lane, shared (rather than segregated) roadways and narrow, rough, unpaved or noisy bicycle facilities.
The evidence on congestion and delays robustly showed a negative impact across different types of mental health/wellbeing assessments. Such effects were most consistently observed for indicators such as high traffic density and slow traffic speed, which are also expected to happen in urban areas, increased population density and in peak hours. Interestingly, studies also reported stress-induced biological signals corroborating the negative effects of perceived travel duration, waiting time and time pressure.
Fewer studies addressed reliability and mental health/wellbeing, but some indicators related to stress and travel satisfaction in public transport were encountered. Predictability results in lower self-reported stress in commuters and in professional drivers. Stronger stress-related biosignaling was also observed in bus drivers facing unpredictable situations related to schedule changes; and for rail commuters who perceive their daily commutes as more unpredictable. Finally, a positive evaluation of reliability aspects on walking/cycling trips also positively affects the attitude towards these modes.
Limitations
Despite the structured search strategy on multiple databases and empirical evidence targeting, our study has limitations. When discussing transport-related indicators, no weighted contribution as a function of study design or effect sizes was considered – although a quality assessment and individual limitations are described. Furthermore, by applying strict criteria for self-reported scales – focusing on outcomes closely related to psychological distress, we potentially excluded relevant topics (e.g. travel satisfaction without a valid psychological measure; or safety-focused road anger).
Additionally, the reviewed studies also have limitations. While analysing the data we have identified gender (more males) and age (preference for the young) imbalance; and few studies focused on clinical populations or had a longitudinal design (limiting causality inference). Adapted versions or sub-scales of psychological instruments were occasionally used with questionable reliability. Regarding the use of physiological measurements, its associated data collection effort often led to studies with small sample sizes. Despite the advantages in manipulating variables and eliciting scenarios with driving simulators (some scenarios not possible in real-life), such controlled environments are oversimplified and also have power/sample size issues.
Finally, the impact of potential confounding variables (e.g. noise exposure, social interactions, participants’ attitude towards transport services, personality traits, and other context variables) was frequently disregarded.
Policy and research recommendations
Recent policies have started to link mobility-related solutions and mental health/wellbeing by relying on actions for increasing social inclusion, the share of active mobility and green areas, and decreasing congestion (Cooper et al., Citation2004; Dora, Hosking, Mudu, & Fletcher, Citation2011; WHO, Citation2021; Wild et al., Citation2021). Our review shows that the mobility policy agenda can now include further dimensions on action for improved mental wellbeing (). These indicators are intrinsically linked with individual cognitive, physical, time and uncertainty challenges and have proven to impact mental wellbeing. Despite such evidence, little is known on their quantified benefits in terms of complementary treatment/prevention. This is mainly due to (mental) public health impact assessments requirements during mobility planning and transport operations; pre–post studies that can effectively quantify the benefits of interventions; and linked quantitative measures throughout the conceptual chain presented in . Thus, the introduction of key performance indicators as drivers for policy-making is still not possible. Yet, the inclusion of valid psychological measures with robust evidence (Appendix 3) can potentially be introduced in practice for service assessment (e.g. at the level of contract or regulation for public transportation operators).
After reviewing the empirical evidence, we have also identified some needs for future research. New studies should explore built environment characteristics of travel routes and how these are related to mental health/wellbeing. Further work is also needed for better combining the different methodologies to study the relationship between congestion, emotions, and wellbeing – as inconsistencies between reported outcomes still exist due to heterogeneous selection of exposure- and instrument-related measurements. Transport reliability is surprisingly neglected, despite old evidence found in studies related to the impacts of public transport reliability. Additionally, few studies combined both psychological and physiological measures, despite the increased availability of mobility sensing and biosensing technologies. Also, we focused our review on infrastructure and operational attributes which are critical in travel behaviour and decision-making. Such decisions ultimately will influence mental states through subsequent changes in an individual's activity and travel patterns. Understanding such processes is a promising and yet-to-be-explored research path.
Finally, the critical link in our proposed framework () relies on the evaluation of mental health/wellbeing outcomes. The most challenging and needed research stream will be on the systematic quantification of potential gains and losses with interventions within transport attributes and mobility decision-making.
Disclosure statement
No potential conflict of interest was reported by the author(s).
Additional information
Funding
References
- Andresen, E. M., Malmgren, J. A., Carter, W. B., & Patrick, D. L. (1994). Screening for depression in well older adults: Evaluation of a short form of the CES-D. American Journal of Preventive Medicine, 10(2), 77–84. doi:10.1016/S0749-3797(18)30622-6
- Bitkina, O. V., Kim, J., Park, J., Park, J., & Kim, H. K. (2019). Identifying traffic context using driving stress: A longitudinal preliminary case study. Sensors, 19(9), Article 2152. doi:10.3390/s19092152
- Bradley, M. M., & Lang, P. J. (1994). Measuring emotion: The self-assessment manikin and the semantic differential. Journal of Behavior Therapy and Experimental Psychiatry, 25(1), 49–59. doi:10.1016/0005-7916(94)90063-9
- Brewer, A. M. (2000). Road rage: What, who, when, where and how? Transport Reviews, 20(1), 49–64. doi:10.1080/014416400295338
- Buck, R. (1999). The biological affects: A typology. Psychological Review, 106(2), 301–336. doi:10.1037/0033-295X.106.2.301
- Calvo, M. G., & Gutiérrez-García, A. (2016). Cognition and stress. In G. Fink (Ed.), Stress: Concepts, cognition, emotion, and behavior (pp. 139–144). Elsevier Academic Press.
- Camm, A. J., Malik, M., Bigger, J. T., Breithardt, G., Cerutti, S., Cohen, R. J., … Singer, D. H. (1996). Heart rate variability: Standards of measurement, physiological interpretation and clinical use. Circulation, 93(5), 1043–1065. doi:10.1161/01.CIR.93.5.1043
- Cao, J. (2013). The association between light rail transit and satisfactions with travel and life: Evidence from Twin Cities. Transportation, 40(5), 921–933. doi:10.1007/s11116-013-9455-8
- Cardone, D., Perpetuini, D., Filippini, C., Spadolini, E., Mancini, L., Chiarelli, A. M., & Merla, A. (2020). Driver stress state evaluation by means of thermal imaging: A supervised machine learning approach based on ECG signal. Applied Sciences, 10(16), 5673. doi:10.3390/app10165673
- Castro, M., Guevara, C. A., & Jimenez-Molina, A. (2020). A methodological framework to incorporate psychophysiological indicators into transportation modeling. Transportation Research Part C: Emerging Technologies, 118, 102712. doi:10.1016/j.trc.2020.102712
- Caviedes, A., & Figliozzi, M. (2018). Modeling the impact of traffic conditions and bicycle facilities on cyclists’ on-road stress levels. Transportation Research Part F: Traffic Psychology and Behaviour, 58, 488–499. doi:10.1016/j.trf.2018.06.032
- Chng, S., White, M., Abraham, C., & Skippon, S. (2016). Commuting and wellbeing in London: The roles of commute mode and local public transport connectivity. Preventive Medicine, 88, 182–188. doi:10.1016/j.ypmed.2016.04.014
- Cobb, D. P., Jashami, H., & Hurwitz, D. S. (2021). Bicyclists’ behavioral and physiological responses to varying roadway conditions and bicycle infrastructure. Transportation Research Part F: Traffic Psychology and Behaviour, 80, 172–188. doi:10.1016/j.trf.2021.04.004
- Cohen, S., Kamarck, T., & Mermelstein, R. (1983). A global measure of perceived stress. Journal of Health and Social Behavior, 24(4), 385–396. doi:10.2307/2136404
- Cooper, E., Gates, S., Grollman, C., Mayer, M., Davis, B., Bankiewicz, U., & Khambhaita, P. (2004). Transport, health, and wellbeing: An evidence review for the Department for Transport. London: NatCen Social Research. https://assets.publishing.service.gov.uk/government/uploads/system/uploads/attachment_data/file/847884/Transport__health_and_wellbeing.pdf.2
- Critchley, H. D., & Harrison, N. A. (2013). Visceral influences on brain and behavior. Neuron, 77(4), 624–638. doi:10.1016/j.neuron.2013.02.008
- Cunradi, C. B., Chen, M. J., & Lipton, R. (2009). Association of occupational and substance use factors with burnout among urban transit operators. Journal of Urban Health, 86(4), 562–570. doi:10.1007/s11524-009-9349-4
- De Vos, J., Schwanen, T., Van Acker, V., & Witlox, F. (2013). Travel and subjective well-being: A focus on findings, methods and future research needs. Transport Reviews, 33(4), 421–442. doi:10.1080/01441647.2013.815665
- De Vos, J., Schwanen, T., Van Acker, V., & Witlox, F. (2019). Do satisfying walking and cycling trips result in more future trips with active travel modes? An exploratory study. International Journal of Sustainable Transportation, 13(3), 180–196. doi:10.1080/15568318.2018.1456580
- Deffenbacher, J. L. (2008). Anger, aggression, and risky behavior on the road: A preliminary study of urban and rural differences. Journal of Applied Social Psychology, 38(1), 22–36. doi:10.1111/j.1559-1816.2008.00294.x
- Deffenbacher, J. L., Lynch, R. S., Oetting, E. R., & Swaim, R. C. (2002). The Driving Anger Expression Inventory: A measure of how people express their anger on the road. Behaviour Research and Therapy, 40(6), 717–737. doi:10.1016/S0005-7967(01)00063-8
- Deffenbacher, J. L., Oetting, E. R., & Lynch, R. S. (1994). Development of a driving anger scale. Psychological Reports, 74(1), 83–91. doi:10.2466/pr0.1994.74.1.83
- Diener, E. D., Emmons, R. A., Larsen, R. J., & Griffin, S. (1985). The satisfaction with life scale. Journal of Personality Assessment, 49(1), 71–75. doi:10.1207/s15327752jpa4901_13
- Di Flumeri, G., Borghini, G., Aricò, P., Sciaraffa, N., Lanzi, P., Pozzi, S., … Babiloni, F. (2018). EEG-based mental workload neurometric to evaluate the impact of different traffic and road conditions in real driving settings. Frontiers in Human Neuroscience, 12, 09. doi:10.3389/fnhum.2018.00509
- Dula, C. S., & Ballard, M. E. (2003). Development and evaluation of a measure of dangerous, aggressive, negative emotional, and risky driving. Journal of Applied Social Psychology, 33(2), 263–282. doi:10.1111/j.1559-1816.2003.tb01896.x
- Dogan, D., Bogosyan, S., & Acarman, T. (2019). Evaluation of driver stress level with survey, galvanic skin response sensor data, and force-sensing resistor data. Advances in Mechanical Engineering, 11(12). doi:10.1177/1687814019891555
- Doorley, R., Pakrashi, V., Byrne, E., Comerford, S., Ghosh, B., & Groeger, J. A. (2015). Analysis of heart rate variability amongst cyclists under perceived variations of risk exposure. Transportation Research Part F: Traffic Psychology and Behaviour, 28, 40–54. doi:10.1016/j.trf.2014.11.004
- Dora, C., Hosking, J., Mudu, P., & Fletcher, E. R. (2011). Urban transport and health. Module 5 g. Sustainable transport: A sourcebook for policy-makers in developing cities. Eschborn: Deutsche Gesellschaft für Internationale Zusammenarbeit and World Health Organization. https://www.who.int/publications/i/item/9789241502443
- Dorantes Argandar, G., Tortosa Gil, F., & Ferrero Berlanga, J. (2016). Measuring situations that stress Mexicans while driving. Transportation Research Part F: Traffic Psychology and Behaviour, 37, 154–161. doi:10.1016/j.trf.2015.12.014
- Dorantes-Argandar, G., Rivera-Vázquez, E. Y., & Cárdenas-Espinoza, K. M. (2019). Measuring situations that stress public bus users in Mexico: A case study of Cuernavaca, Morelos. Public Transport, 11(3), 577–587. doi:10.1007/s12469-019-00215-y
- Ehlers, A., Taylor, J. E., Ehring, T., Hofmann, S. G., Deane, F. P., Roth, W. T., & Podd, J. V. (2007). The driving cognitions questionnaire: Development and preliminary psychometric properties. Journal of Anxiety Disorders, 21(4), 493–509. doi:10.1016/j.janxdis.2006.08.002
- Ehlers, A., Hofmann, S. G., Herda, C. A., & Roth, W. T. (1994). Clinical characteristics of driving phobia. Journal of Anxiety Disorders, 8(4), 323–339. doi:10.1016/0887-6185(94)00021-2
- Ekman, P. (1993). Facial expression and emotion. American Psychologist, 48(4), 384–392. doi:10.1037/0003-066X.48.4.384
- Emo, A. K., Matthews, G., & Funke, G. J. (2016). The slow and the furious: Anger, stress and risky passing in simulated traffic congestion. Transportation Research Part F: Traffic Psychology and Behaviour, 42(Part 1), 1–14. doi:10.1016/j.trf.2016.05.002
- Ettema, D., Gärling, T., Eriksson, L., Friman, M., Olsson, L. E., & Fujii, S. (2011). Satisfaction with travel and subjective well-being: Development and test of a measurement tool. Transportation Research Part F: Traffic Psychology and Behaviour, 14(3), 167–175. doi:10.1016/j.trf.2010.11.002
- Ettema, D., Gärling, T., Olsson, L. E., Friman, M., & Moerdijk, S. (2013). The road to happiness: Measuring Dutch car drivers’ satisfaction with travel. Transport Policy, 27, 171–178. doi:10.1016/j.tranpol.2012.12.006
- Evans, G. W., Wener, R. E., & Phillips, D. (2002). The morning rush hour: Predictability and commuter stress. Environment and Behavior, 34(4), 521–530. doi:10.1177/00116502034004007
- Fairclough, S. H., & Spiridon, E. (2012). Cardiovascular and electrocortical markers of anger and motivation during a simulated driving task. International Journal of Psychophysiology, 84(2), 188–193. doi:10.1016/j.ijpsycho.2012.02.005
- Fan, A., Chen, X., & Zhang, X. (2021). What factors contribute to higher travel happiness? Evidence from Beijing, China. Journal of Advanced Transportation, 2021, 8861841. doi:10.1155/2021/8861841
- Feng, X., Feng, Z., & Astell-Burt, T. (2017). Perceived public transport infrastructure modifies the association between public transport use and mental health: Multilevel analyses from the United Kingdom. PLoS ONE, 12(8), e0180081. doi:10.1371/journal.pone.0180081
- Fitch, D. T., Sharpnack, J., & Handy, S. L. (2020). Psychological stress of bicycling with traffic: Examining heart rate variability of bicyclists in natural urban environments. Transportation Research Part F: Traffic Psychology and Behaviour, 70, 81–97. doi:10.1016/j.trf.2020.02.015
- Friman, M. (2010). Affective dimensions of the waiting experience. Transportation Research Part F: Traffic Psychology and Behaviour, 13(3), 197–205. doi:10.1016/j.trf.2010.04.006
- Gadsby, A., Hagenzieker, M., & Watkins, K. (2021). An international comparison of the self-reported causes of cyclist stress using quasi-naturalistic cycling. Journal of Transport Geography, 91, 102932. doi:10.1016/j.jtrangeo.2020.102932
- Gao, Y., Rasouli, S., Timmermans, H., & Wang, Y. (2017). Effects of traveller’s mood and personality on ratings of satisfaction with daily trip stages. Travel Behaviour and Society, 7, 1–11. doi:10.1016/j.tbs.2016.11.002
- Glasgow, T. E., Le, H. T. K., Geller, E. S., Fan, Y., & Hankey, S. (2019). How transport modes, the built and natural environments, and activities influence mood: A GPS smartphone app study. Journal of Environmental Psychology, 66, 101345. doi:10.1016/j.jenvp.2019.101345
- Glasgow, T. E., Geller, E. S., Le, H. T., & Hankey, S. (2018). Travel mood scale: Development and validation of a survey to measure mood during transportation. Transportation Research Part F: Traffic Psychology and Behaviour, 59, 318–329. doi:10.1016/j.trf.2018.09.014
- Glendon, A. I., Dorn, L., Matthews, G., Gulian, E., Davies, D. R., & Debney, L. M. (1993). Reliability of the driving behaviour inventory. Ergonomics, 36(6), 719–726. doi:10.1080/00140139308967932
- Goldberg, D. P., Gater, R., Sartorius, N., Ustun, T. B., Piccinelli, M., Gureje, O., & Rutter, C. (1997). The validity of two versions of the GHQ in the WHO study of mental illness in general health care. Psychological Medicine, 27(1), 191–197. doi:10.1017/S0033291796004242
- Halim, Z., & Rehan, M. (2020). On identification of driving-induced stress using electroencephalogram signals: A framework based on wearable safety-critical scheme and machine learning. Information Fusion, 53, 66–79. doi:10.1016/j.inffus.2019.06.006
- Hamill, R. W., Shapiro, R. E., & Vizzard, M. A. (2004). Peripheral autonomic nervous system. In D. Robertson, G. Burnstock, J. F. R. Paton, I. Biaggioni, & P. A. Low (Eds.), Primer on the autonomic nervous system (pp. 1720–1268). London: Elsevier Academic Press.
- Hart, S. G., & Staveland, L. E. (1988). Development of NASA-TLX (Task Load Index): Results of empirical and theoretical research. In P. A. Hancock, & N. Meshkati (Eds.), Advances in Psychology (pp. 139–183). North-Holland. doi:10.1016/S0166-4115(08)62386-9
- He, S. Y., Thøgersen, J., Cheung, Y. H. Y., & Yu, A. H. Y. (2020). Ageing in a transit-oriented city: Satisfaction with transport, social inclusion and wellbeing. Transport Policy, 97, 85–94. doi:10.1016/j.tranpol.2020.06.016
- Hellhammer, D. H., Wüst, S., & Kudielka, B. M. (2009). Salivary cortisol as a biomarker in stress research. Psychoneuroendocrinology, 34(2), 163–171. doi:10.1016/j.psyneuen.2008.10.026
- Hernández-Hernández, A. M., Siqueiros-García, J. M., Robles-Belmont, E., & Gershenson, C. (2019). Anger while driving in Mexico city. PLoS ONE, 14(9), e0223048. doi:10.1371/journal.pone.0223048
- Høye, A., Fyhri, A., & Bjørnskau, T. (2016). Shared road is double happiness: Evaluation of a “share the road” sign. Transportation Research Part F: Traffic Psychology and Behaviour, 42(Part 3), 500–508. doi:10.1016/j.trf.2015.12.006
- Huang, Y.-C., Li, L.-P., Liu, Z.-G., Zhu, H.-Y., & Zhu, L. (2019). Assessment of urban railway transit driver workload and fatigue under real working conditions. Transportation Research Record, 2673(11), 891–900. doi:10.1177/0361198119826071
- Ihme, K., Unni, A., Zhang, M., Rieger, J. W., & Jipp, M. (2018). Recognizing frustration of drivers from face video recordings and brain activation measurements with functional near-infrared spectroscopy. Frontiers in Human Neuroscience, 12, 327. doi:10.3389/fnhum.2018.00327
- International Wellbeing Group. (2006). Personal Well-being Index (4th ed.). Melbourne: Australian Centre on Quality of Life, Deakin University.
- Izard, C. E. (2007). Basic emotions, natural kinds, emotion schemas, and a new paradigm. Perspectives on Psychological Science, 2(3), 260–280. doi:10.1111/j.1745-6916.2007.00044.x
- Kahneman, D., Krueger, A. B., Schkade, D. A., Schwarz, N., & Stone, A. A. (2004). A survey method for characterizing daily life experience: The day reconstruction method. Science, 306(5702), 1776–1780. doi:10.1126/science.1103572
- Kahneman, D., & Krueger, A. B. (2006). Developments in the measurement of subjective well-being. Journal of Economic Perspectives, 20(1), 3–24. doi:10.1257/089533006776526030
- Kessler, R. C., Andrews, G., Colpe, L. J., Hiripi, E., Mroczek, D. K., Normand, S.-L. T., … Zaslavsky, A. M. (2002). Short screening scales to monitor population prevalences and trends in non-specific psychological distress. Psychological Medicine, 32(6), 959–976. doi:10.1017/S0033291702006074
- Khattak, Z. H., Fontaine, M. D., & Boateng, R. A. (2018). Evaluating the impact of adaptive signal control technology on driver stress and behavior using real-world experimental data. Transportation Research Part F: Traffic Psychology and Behaviour, 58, 133–144. doi:10.1016/j.trf.2018.06.006
- Kmet, L. M., Lee, R. C., & Cook, L. S. (2004). Standard quality assessment criteria for evaluating primary research papers from a variety of fields. Alberta: Alberta Heritage Foundation for Medical Research. https://era.library.ualberta.ca/items/48b9b989-c221-4df6-9e35-af782082280e/view/a1cffdde-243e-41c3-be98-885f6d4dcb29/standard_quality_assessment_criteria_for_evaluating_primary_research_papers_from_a_variety_of_fields.pdf
- Knies, G. (2014). Understanding society - The UK household longitudinal study waves 1–4: User manual. Colchester: Institute for Social and Economic Research, University of Essex.
- Lades, L. K., Kelly, A., & Kelleher, L. (2020). Why is active travel more satisfying than motorized travel? Evidence from Dublin. Transportation Research Part A: Policy and Practice, 136, 318–333. doi:10.1016/j.tra.2020.04.007
- Larue, G. S., Blackman, R. A., & Freeman, J. (2020). Frustration at congested railway level crossings: How long before extended closures result in risky behaviours? Applied Ergonomics, 82, 102943. doi:10.1016/j.apergo.2019.102943
- Leslie, E., & Cerin, E. (2008). Are perceptions of the local environment related to neighbourhood satisfaction and mental health in adults? Preventive Medicine, 47(3), 273–278. doi:10.1016/j.ypmed.2008.01.014
- Li, F., Yao, X., Jiang, L., & Li, Y. (2014). Driving anger in China: Psychometric properties of the Driving Anger Scale (DAS) and its relationship with aggressive driving. Personality and Individual Differences, 68, 130–135. doi:10.1016/j.paid.2014.04.018
- Li, G., Lai, W., Sui, X., Li, X., Qu, X., Zhang, T., & Li, Y. (2020). Influence of traffic congestion on driver behavior in post-congestion driving. Accident Analysis & Prevention, 141, 105508. doi:10.1016/j.aap.2020.105508
- Lunke, E. B. (2020). Commuters’ satisfaction with public transport. Journal of Transport & Health, 16, 100842. doi:10.1016/j.jth.2020.100842
- Maslach, C., Jackson, S. E., & Leiter, M. P. (1997). Maslach Burnout inventory. In C. P. Zalaquett, & R. J. Wood (Eds.), Evaluating stress: A book of resources (pp. 191–218). Scarecrow Education.
- Matthews, G., & Campbell, S. E. (1998). Task-induced stress and individual differences in coping. Proceedings of the Human Factors and Ergonomics Society Annual Meeting, 42(11), 821–825. doi:10.1177/154193129804201111
- Matthews, G., Desmond, P. A., Joyner, L., Carcary, B., & Gilliland, K. (1996, May 22-25). Validation of the driver stress inventory and driver coping questionnaire. [Paper presentation]. International Conference on Traffic and Transport Psychology, Valencia, Spain.
- Matthews, G., Desmond, P. A., Joyner, L., Carcary, B., & Gilliland, K. (1997). A comprehensive questionnaire measure of driver stress and affect. In T. Rothengatter & E. C. Vaya (Eds.), Traffic and transport psychology: Theory and application (pp. 317–324). Amsterdam: Pergamon.
- Matthews, G., Jones, D. M., & Chamberlain, A. G. (1990). Refining the measurement of mood: The UWIST Mood Adjective Checklist. British Journal of Psychology, 81(1), 17–42. doi:10.1111/j.2044-8295.1990.tb02343.x
- Matthews, G., Szalma, J., Panganiban, A. R., Neubauer, C., & Warm, J. S. (2013). Profiling task stress with the Dundee Stress State Questionnaire. In L. Cavalcanti, & S. Azevedo (Eds.), Psychology of stress (pp. 49–90). Hauppage, NY: Nova Science.
- Mauss, I. B., & Robinson, M. D. (2009). Measures of emotion: A review. Cognition & Emotion, 23(2), 209–237. doi:10.1080/02699930802204677
- Mayer, J. D., & Gaschke, Y. N. (2001). Brief mood introspection scale (BMIS). Psychology, 19(3), 1995–1995. doi:10.13072/midss.647
- McEwen, B. S., & Gianaros, P. J. (2010). Central role of the brain in stress and adaptation: Links to socioeconomic status, health, ikand disease. Annals of the New York Academy of Sciences, 1186(1), 190–222. doi:10.1111/j.1749-6632.2009.05331.x
- Morgan, R. L., Whaley, P., Thayer, K. A., & Schünemann, H. J. (2018). Identifying the PECO: A framework for formulating good questions to explore the association of environmental and other exposures with health outcomes. Environment International, 121(Pt 1), 1027–1031. doi:10.1016/j.envint.2018.07.015
- Morris, E. A., & Hirsch, J. A. (2016). Does rush hour see a rush of emotions? Driver mood in conditions likely to exhibit congestion. Travel Behaviour and Society, 5, 5–13. doi:10.1016/j.tbs.2015.07.002
- Nadrian, H., Mahmoodi, H., Taghdisi, M. H., Aghemiri, M., Babazadeh, T., Ansari, B., & Fathipour, A. (2020). Public health impacts of urban traffic jam in Sanandaj, Iran: A case study with mixed-method design. Journal of Transport & Health, 19, 100923. doi:10.1016/j.jth.2020.100923
- Niven, K. (2013). Affect. In G. M. D. Gellman, & T. J. R. Turner (Eds.), Encyclopedia of behavioral medicine (pp. 49–50). New York, NY: Springer.
- Öhman, A., Hamm, A., & Hugdahl, K. (2000). Cognition and the autonomic nervous system: Orienting, anticipation, and conditioning. In J. T. Cacioppo, L. G. Tassinary, & G. G. Berntson (Eds.), Handbook of psychophysiology (pp. 533–575). Cambridge: Cambridge University Press.
- Page, M. J., McKenzie, J. E., Bossuyt, P. M., Boutron, I., Hoffmann, T. C., Mulrow, C. D., … Moher, D. (2021). The PRISMA 2020 statement: An updated guideline for reporting systematic reviews. BMJ, 372(71). doi:10.1136/bmj.n71
- Panksepp, J. (2007). Neurologizing the psychology of affects: How appraisal-based constructivism and basic emotion theory can coexist. Perspectives on Psychological Science, 2(3), 281–296. doi:10.1111/j.1745-6916.2007.00045.x
- Parker, D., Lajunen, T., & Summala, H. (2002). Anger and aggression among drivers in three European countries. Accident Analysis & Prevention, 34(2), 229–235. doi:10.1016/S0001-4575(01)00018-5
- Perchoux, C., Chaix, B., Cummins, S., & Kestens, Y. (2013). Conceptualization and measurement of environmental exposure in epidemiology: Accounting for activity space related to daily mobility. Health & Place, 21, 86–93. doi:10.1016/j.healthplace.2013.01.005
- Pykett, J., Chrisinger, B. W., Kyriakou, K., Osborne, T., Resch, B., Stathi, A., & Whittaker, A. C. (2020). Urban emotion sensing beyond ‘affective capture’: Advancing critical interdisciplinary methods. International Journal of Environmental Research and Public Health, 17(23), 9003. doi:10.3390/ijerph17239003
- Qi, W., Wen, H., & Wu, Y. (2015). Method and application of grade division for road traffic congestion based on driver’s feeling. Advances in Mechanical Engineering, 7(11). doi:10.1177/1687814015618860
- Qi, W., Wen, H., Wu, Y., & Qin, L. (2017). Effect model of urban traffic congestion on driver’s lane-changing behavior. Advances in Mechanical Engineering, 9(9). doi:10.1177/1687814017724087
- Rigas, G., Goletsis, Y., Bougia, P., & Fotiadis, D. I. (2011). Towards driver's state recognition on real driving conditions. International Journal of Vehicular Technology, 2011, 617210. doi:10.1155/2011/617210
- Ringhand, M., & Vollrath, M. (2019). Effect of complex traffic situations on route choice behaviour and driver stress in residential areas. Transportation Research Part F: Traffic Psychology and Behaviour, 60, 274–287. doi:10.1016/j.trf.2018.10.023
- Rodrigues, J. G. P., Kaiseler, M., Aguiar, A., Cunha, J. P. S., & Barros, J. (2015). A mobile sensing approach to stress detection and memory activation for public bus drivers. IEEE Transactions on Intelligent Transportation Systems, 16(6), 3294–3303. doi:10.1109/TITS.2015.2445314
- Roidl, E., Frehse, B., Oehl, M., & Höger, R. (2013). The emotional spectrum in traffic situations: Results of two online-studies. Transportation Research Part F: Traffic Psychology and Behaviour, 18, 168–188. doi:10.1016/j.trf.2012.12.009
- Ryff, C. D. (1989). Happiness is everything, or is it? Explorations on the meaning of psychological well-being. Journal of Personality and Social Psychology, 57(6), 1069. doi:10.1037/0022-3514.57.6.1069
- Russell, J. A. (1994). Is there universal recognition of emotion from facial expression? A review of the cross-cultural studies. Psychological Bulletin, 115(1), 102–141. doi:10.1037/0033-2909.115.1.102
- Saeb, S., Zhang, M., Karr, C. J., Schueller, S. M., Corden, M. E., Kording, K. P., & Mohr, D. C. (2015). Mobile phone sensor correlates of depressive symptom severity in daily-life behavior: An exploratory study. Journal of Medical Internet Research, 17(7), e175. doi:10.2196/jmir.4273
- Samuel, O., Walker, G., Salmon, P., Filtness, A., Stevens, N., Mulvihill, C., … Stanton, N. (2019). Riding the emotional roller-coaster: Using the circumplex model of affect to model motorcycle riders’ emotional state-changes at intersections. Transportation Research Part F: Traffic Psychology and Behaviour, 66, 139–150. doi:10.1016/j.trf.2019.08.018
- Schoner, J., Chapman, J., Brookes, A., MacLeod, K. E., Fox, E. H., Iroz-Elardo, N., & Frank, L. D. (2018). Bringing health into transportation and land use scenario planning: Creating a National Public Health Assessment Model (N-PHAM). Journal of Transport & Health, 10, 401–418. doi:10.1016/j.jth.2018.04.008
- Skevington, S. M., Lotfy, M., & O'Connell, K. A. (2004). The World Health Organization's WHOQOL-BREF quality of life assessment: Psychometric properties and results of the international field trial. A report from the WHOQOL group. Quality of Life Research, 13(2), 299–310. doi:10.1023/B:QURE.0000018486.91360.00
- Singh, R. R., Conjeti, S., & Banerjee, R. (2013). A comparative evaluation of neural network classifiers for stress level analysis of automotive drivers using physiological signals. Biomedical Signal Processing and Control, 8(6), 740–754. doi:10.1016/j.bspc.2013.06.014
- Smith, O. (2017). Commute well-being differences by mode: Evidence from Portland, Oregon, USA. Journal of Transport & Health, 4, 246–254. doi:10.1016/j.jth.2016.08.005
- Smyth, R., Nielsen, I., Zhai, Q., Liu, T., Liu, Y., Tang, C., … Zhang, J. (2011). A study of the impact of environmental surroundings on personal well-being in urban China using a multi-item well-being indicator. Population and Environment, 32(4), 353–375. doi:10.1007/s11111-010-0123-z
- Spielberger, C. D., Sydeman, S. J., Owen, A. E., & Marsh, B. J. (1999). Measuring anxiety and anger with the State-Trait Anxiety Inventory (STAI) and the State-Trait Anger Expression Inventory (STAXI). In M. E. Maruish (Ed.), The use of psychological testing for treatment planning and outcomes assessment (pp. 993–1021). New York: Lawrence Erlbaum Associates Publishers.
- Sposato, R. G., Röderer, K., & Cervinka, R. (2012). The influence of control and related variables on commuting stress. Transportation Research Part F: Traffic Psychology and Behaviour, 15(5), 581–587. doi:10.1016/j.trf.2012.05.003
- Stemmler, G. (2004). Physiological processes during emotion. In P. Philippot, & R. S. Feldman (Eds.), The regulation of emotion (pp. 33–70). New York: Lawrence Erlbaum Associates Publishers.
- Taylor, J., & Deane, F. P. (2000). Comparison and characteristics of motor vehicle accident (MVA) and non-MVA driving fears. Journal of Anxiety Disorders, 14(3), 281–298. doi:10.1016/S0887-6185(99)00040-7
- Taylor, J., & Paki, D. (2008). Wanna drive? Driving anxiety and fear in a New Zealand community sample. New Zealand Journal of Psychology, 37(2), 31–37.
- Techer, F., Ojeda, L., Barat, D., Marteau, J.-Y., Rampillon, F., Feron, S., & Dogan, E. (2019). Anger and highly automated driving in urban areas: The role of time pressure. Transportation Research Part F: Traffic Psychology and Behaviour, 64, 353–360. doi:10.1016/j.trf.2019.05.016
- Teh, E., Jamson, S., Carsten, O., & Jamson, H. (2014). Temporal fluctuations in driving demand: The effect of traffic complexity on subjective measures of workload and driving performance. Transportation Research Part F: Traffic Psychology and Behaviour, 22, 207–217. doi:10.1016/j.trf.2013.12.005
- Tennant, R., Hiller, L., Fishwick, R., Platt, S., Joseph, S., Weich, S., Parkinson, J., Secker, J., & Stewart-Brown, S. (2007). The Warwick-Edinburgh Mental Well-being Scale (WEMWBS): Development and UK validation. Health and Quality of Life Outcomes, 5, Article 63. doi:10.1186/1477-7525-5-63
- Teixeira, I. P., da Silva, A. N. R., Schwanen, T., Manzato, G. G., Dörrzapf, L., Zeile, P., … Botteldooren, D. (2020). Does cycling infrastructure reduce stress biomarkers in commuting cyclists? A comparison of five European cities. Journal of Transport Geography, 88, 102830. doi:10.1016/j.jtrangeo.2020.102830
- Teng, J., Pan, W., & Zhang, C. (2020). Quantitative modeling of congestion in metro station based on passenger time perceptions. Transportation Research Record, 2674(5), 270–281. doi:10.1177/0361198120914900
- Ulrich-Lai, Y. M., & Herman, J. P. (2009). Neural regulation of endocrine and autonomic stress responses. Nature Reviews Neuroscience, 10(6), 397–409. doi:10.1038/nrn2647
- van Hooff, M. L. M. (2015). The daily commute from work to home: Examining employees’ experiences in relation to their recovery status. Stress and Health, 31(2), 124–137. doi:10.1002/smi.2534
- Västfjäll, D., Friman, M., Gärling, T., & Kleiner, M. (2002). The measurement of core affect: A Swedish self-report measure derived from the affect circumplex. Scandinavian Journal of Psychology, 43(1), 19–31. doi:10.1111/1467-9450.00265.
- Vella-Brodrick, D. A., & Stanley, J. (2013). The significance of transport mobility in predicting well-being. Transport Policy, 29, 236–242. doi:10.1016/j.tranpol.2013.06.005
- Quinn, R. P., & Shepard, L. J. (1974). The 1972-73 quality of employment survey: Descriptive statistics, with comparison data from the 1969-70 survey of working conditions. University of Michigan, Institute for Social Research.
- Wang, K., & Guo, P. (2021). An ensemble classification model with unsupervised representation learning for driving stress recognition using physiological signals. IEEE Transactions on Intelligent Transportation Systems, 22(6), 3303–3315. doi:10.1109/TITS.2020.2980555
- Wang, X., Rodríguez, D. A., Sarmiento, O. L., & Guaje, O. (2019). Commute patterns and depression: Evidence from eleven Latin American cities. Journal of Transport & Health, 14, 100607. doi:10.1016/j.jth.2019.100607
- Watson, D., & Clark, L. A. (1994). The PANAS-X: Manual for the Positive and Negative Affect Schedule - Expanded Form. University of Iowa, Iowa City. doi:10.17077/48vt-m4t2
- Watson, D., Clark, L. A., & Tellegen, A. (1988). Development and validation of brief measures of positive and negative affect: The PANAS scales. Journal of Personality and Social Psychology, 54(6), 1063–1070. doi:10.1037/0022-3514.54.6.1063
- Wener, R. E., Evans, G. W., Phillips, D., & Nadler, N. (2003). Running for the 7:45: The effects of public transit improvements on commuter stress. Transportation, 30(2), 203–220. doi:10.1023/A:1022516221808
- Werner, C., Resch, B., & Loidl, M. (2019). Evaluating urban bicycle infrastructures through intersubjectivity of stress sensations derived from physiological measurements. ISPRS International Journal of Geo-Information, 8(6), 265. doi:10.3390/ijgi8060265
- Wickens, C. M., Mann, R. E., Ialomiteanu, A. R., & Stoduto, G. (2016). Do driver anger and aggression contribute to the odds of a crash? A population-level analysis. Transportation Research Part F: Traffic Psychology and Behaviour, 42(Part 2), 389–399. doi:10.1016/j.trf.2016.03.003
- Widyanti, A., Johnson, A., & de Waard, D. (2013). Adaptation of the Rating Scale Mental Effort (RSME) for use in Indonesia. International Journal of Industrial Ergonomics, 43(1), 70–76. doi:10.1016/j.ergon.2012.11.003
- Wild, K., Woodward, A., Herbert, S., Tiatia-Seath, J., Collings, S., Shaw, C., & Ameratunga, S. (2021). The relationship between transport and mental health in Aotearoa New Zealand (Waka Kotahi NZ Transport Agency research report 675). https://www.nzta.govt.nz/assets/resources/research/reports/675/675-the-relationship-between-transport-and-mental-health-in-aotearoa.pdf
- World Health Organization. (2004). Promoting mental health: Concepts, emerging evidence, practice. Geneva: World Health Organization. https://apps.who.int/iris/bitstream/handle/10665/42940/9241591595.pdf
- World Health Organization. (2019). Motion for your mind: Physical activity for mental health promotion, protection and care. Copenhagen: WHO Regional Office for Europe. https://www.euro.who.int/__data/assets/pdf_file/0018/403182/WHO-Motion-for-your-mind-ENG.pdf
- World Health Organization. (2021). Green and blue spaces and mental health: New evidence and perspectives for action. Copenhagen: WHO Regional Office for Europe. https://apps.who.int/iris/bitstream/handle/10665/342931/9789289055666-eng.pdf
- Yan, L., Wan, P., Qin, L., & Zhu, D. (2018). The induction and detection method of angry driving: Evidences from EEG and physiological signals. Discrete Dynamics in Nature and Society, 2018, 3702795. doi:10.1155/2018/3702795
- Zhang, M., Ihme, K., & Drewitz, U. (2019). Discriminating drivers’ emotions through the dimension of power: Evidence from facial infrared thermography and peripheral physiological measurements. Transportation Research Part F: Traffic Psychology and Behaviour, 63, 135–143. doi:10.1016/j.trf.2019.04.003
- Zijlstra, F. R. H., & van Doorn, L. (1985). The construction of a scale to measure perceived effort (Technical report). Delft University of Technology.