

Abstract
Introduction
The diagnosis of endometriomas in patients with endometriosis is of primary importance because it influences the management and prognosis of infertility and pain. Imaging techniques are evolving constantly. This study aimed to systematically assess the diagnostic accuracy of transvaginal ultrasound (TVUS) and magnetic resonance imaging (MRI) in detecting endometrioma using the surgical visualisation of lesions with or without histopathological confirmation as reference standards in patients of reproductive age with suspected endometriosis.
Methods
PubMed, Embase, Web of Science, Cumulative Index to Nursing and Allied Health Literature and ClinicalTrials.gov databases were searched from their inception to 12 October 2022, using a manual search for additional articles. Two authors independently performed title, abstract and full-text screening of the identified records, extracted study details and quantitative data and assessed the quality of the studies using the ‘Quality Assessment of Diagnostic Accuracy Study 2’ tool. Bivariate random-effects models were used to determine the pooled sensitivity and specificity, compare the two imaging modalities and evaluate the sources of heterogeneity.
Results
Sixteen prospective studies (10 assessing TVUS, 4 assessing MRI and 2 assessing both TVUS and MRI) were included, representing 1976 participants. Pooled TVUS and MRI sensitivities for endometrioma were 0.89 (95% confidence interval ‘CI’, 0.86–0.92) and 0.94 (95% CI, 0.74–0.99), respectively (indirect comparison p-value of 0.47). Pooled TVUS and MRI specificities for endometrioma were 0.95 (95% CI, 0.92–0.97) and 0.94 (95% CI, 0.89–0.97), respectively (indirect comparison p-value of 0.51). These studies had a high or unclear risk of bias. A direct comparison (all participants undergoing TVUS and MRI) of the modalities was available in only two studies.
Conclusion
TVUS and MRI have high accuracy for diagnosing endometriomas; however, high-quality studies comparing the two modalities are lacking.
PLAIN LANGUAGE SUMMARY
The diagnosis of endometriomas in patients with endometriosis impacts infertility and pain management. We performed a systematic review and meta-analysis to assess the accuracy of transvaginal ultrasound and magnetic resonance imaging for the diagnosis of endometrioma in patients of reproductive age with suspected endometriosis, and to compare the accuracy of the two imaging modalities. Five databases (PubMed, Embase, Web of Science, Cumulative Index to Nursing and Allied Health Literature and ClinicalTrials.gov databases) were searched. Sixteen prospective studies were included, representing 1976 participants. We found high accuracy of transvaginal ultrasound and magnetic resonance imaging for diagnosing endometriomas. There was no statistically significant difference in diagnostic accuracy between the two modalities. However, high-quality studies comparing the two modalities in the same population are lacking.
Introduction
Endometriosis is a chronic condition that has a substantial impact on patients’ quality of life, including social and work functioning (Andysz et al. Citation2018, Zondervan et al. Citation2020). It is associated with various symptoms such as pain (often linked to the menstrual cycle) and infertility (Kennedy et al. Citation2005, Becker et al. Citation2022). Definitive diagnosis of endometriosis is made by histopathological evaluation of at least one endometriosis lesion obtained by surgery (Leyland et al. Citation2010, Becker et al. Citation2022). The invasiveness of such interventions contributes to long delays in diagnosis, with an average of seven years from symptom onset to final diagnosis (Arruda et al. Citation2003, Anastasiu et al. Citation2020). Transvaginal ultrasound (TVUS) and magnetic resonance imaging (MRI) are imaging modalities proposed to accurately diagnose endometriosis without resorting to surgery (Becker et al. Citation2022).
Endometrioma is defined as endometrial-like tissue in the form of a cyst in the ovary and consists of a variable-size mass (International Working Group of AAGL et al. 2021). It is one of the three main phenotypes of endometriosis lesions, along with superficial and deep infiltrative lesions (Deslandes et al. Citation2020). The diagnosis of endometriomas in patients with endometriosis is of primary importance as it influences the management and prognosis of infertility and pain (Parasar et al. Citation2017). Imaging techniques are constantly evolving, and the diagnostic accuracy of MRI and TVUS for such lesions has been reported in several studies. No systematic review using prospective studies has focused on endometrioma as the sole target condition, and TVUS and MRI as the sole imaging techniques.
We conducted a systematic review and meta-analysis to assess the diagnostic accuracy of TVUS and MRI for detecting endometrioma using surgical visualisation of lesions with or without histopathological confirmation in patients of reproductive age with suspected endometriosis, and to compare the accuracy of the two imaging modalities.
Methods
The methodological approaches for this systematic review and meta-analysis are outlined in the Cochrane Handbook for Systematic Review of Diagnostic Test Accuracy (Deeks et al. Citation2022a). The review was conducted according to the Preferred Reporting Items for Systematic Review and Meta-Analysis of Diagnostic Test Accuracy studies (PRISMA-DTA) guidelines (Salameh et al. Citation2020). The protocol was registered in the International Prospective Register of Systematic Reviews (PROSPERO CRD42022366353).
Data sources, search strategy and eligibility criteria
We searched PubMed, Embase, Web of Science Core Collection, Cumulative Index to Nursing and Allied Health Literature (CINAHL) and ClinicalTrials.gov from their inception to 15 February 2022 and then ran an updated search on 12 October 2022. We manually searched the included studies and previous reviews of diagnostic test accuracy (DTA) studies on (various sites of) endometriosis as sources of references to potentially relevant studies. We followed an iterative process, in collaboration with an information specialist. We used the following concepts in the free and controlled vocabulary: ‘endometriosis’, ‘ultrasonography’, ‘sonography’, ‘magnetic resonance imaging’ and ‘diagnostic test accuracy’. We did not employ any search filters (Supplementary Appendices 1–3).
We included peer-reviewed DTA studies published in any language and conducted in any healthcare setting, with no minimal number of participants. Randomised controlled trials and prospective non-randomised (comparative and cohort) studies were considered. We excluded case-control or retrospective cohort studies, narrative or literature or systematic reviews, case reports or series, and studies for which full text was not available, reported only in abstract form or in conference proceedings, or for which information useful for a reliable assessment of eligibility and methodological quality could not be obtained. The participants were of reproductive age (puberty to menopause) with suspected endometriosis based on symptoms (such as dysmenorrhoea, dyspareunia, dyschezia, acute or chronic pelvic pain and infertility) and/or physical examination (Leyland et al. Citation2010, Becker et al. Citation2022) undergoing TVUS and/or MRI as index tests and then the reference standard. The reference standard was visualisation of lesions during surgery (laparoscopy or laparotomy) with or without histological assessment (Maheux-Lacroix et al. Citation2020). Endometrioma, ovarian endometriosis and ovarian endometriotic cysts were the target conditions. This target condition may be primarily studied or secondarily reported in DTA studies of endometriosis, in general or at specific sites or locations.
Study selection and data collection process
Study selection and data collection were performed independently by two reviewers (F.S.K., less than a year’s experience; and R.G.S., first experience in conducting systematic review), who screened titles, abstracts and full-text publications when required. Disagreements were resolved by consensus, and a third reviewer (S.M.L., 11 years’ experience in conducting systematic review) was consulted, if needed. We collected the reasons for the full-text exclusion. To avoid the inclusion of duplicate cohorts from different studies by the same authors, we compared study locations and dates.
We developed a standardised data collection form based on the guidance of data extraction using the Cochrane systematic review methodology (Higgins et al. Citation2022). For missing data, we attempted to contact the authors by e-mail with a reminder if necessary. We excluded studies in which we were unable to construct 2 × 2 tables accurately. The characteristics of the study, participants, index tests, reference standards and values of false positives, false negatives, true positives and true negatives were extracted.
Risk of bias and applicability
Two reviewers (F.S.K. and R.G.S.) independently assessed the risk of bias and applicability concerns using a checklist derived from the Quality Assessment of Diagnostic Accuracy Study 2 (QUADAS-2) tool (Whiting et al. Citation2011). In instances in which discrepancies were not resolved by consensus, a third reviewer (S.M.L.) was consulted. An overall ‘low risk of bias’ or ‘low concern about applicability’ was attributed to a study if no domain had a ‘high’ or ‘unclear’ risk of bias or applicability concern.
Statistical analysis and data synthesis
The diagnostic accuracy measures were sensitivity and specificity. The unit of analysis was the participant (any abnormal finding versus none) and not the ovaries. We performed meta-analyses using bivariate logit normal models (Reitsma et al. Citation2005) with random effects (Deeks et al. Citation2022b) to obtain pooled estimates and 95% confidence interval (CI) of sensitivity and specificity for TVUS and MRI. Individual and pooled estimates of sensitivity, specificity and 95% CI) are presented in paired forest plots. Summary receiver operating characteristic (SROC) plots were generated for TVUS and MRI, with summary values for sensitivity, specificity and point estimates for each study, as well as 95% confidence and 95% prediction regions. We initially assessed heterogeneity by visually examining forest plots. The magnitude of heterogeneity was assessed using a 95% prediction region.
We considered pooled estimate points of sensitivity and specificity above 70% to indicate a very good classification (Haynes Citation2012). TVUS and MRI were assessed as clinically useful imaging tests to replace diagnostic surgery if sensitivity was ≥94% with specificity ≥79% (Wykes et al. Citation2004). The criteria for a sensitive test when negative ruling out (SNOUT) endometrioma were set at a sensitivity of ≥95% and specificity ≥50%. The criteria for a specific triage test when positive ruling in (SPIN) endometrioma was set at a specificity of ≥95%, with a sensitivity of ≥50%. TVUS and MRI are considered as approaching replacement or triage tests with diagnostic estimates within 5% of the set thresholds and having low accuracy with all other diagnostic estimates (Nisenblat et al. Citation2016).
TVUS and MRI accuracies were compared using test‐level covariates in bivariate normal logit models. For tests that involved more than ten eligible studies (Thompson and Sharp Citation1999), we formally explored heterogeneity using study-level covariates (one at a time) in random-effects meta-regressions. We performed sensitivity analysis to assess the impact of each study on results of the meta‐analysis by excluding one study at the time from each pooled estimate (‘leave‐one‐out’ procedure). All p-values were calculated by computing the change in the −2 log likelihood when the covariate was added to the model, using the chi-squared statistic. Differences were considered statistically significant at p < 0.05. Analyses were performed using the R software (R Core Team Citation2023).
Results
Study selection and characteristics
We identified 3855 citations, of which 108 studies were further considered after screening the titles and abstracts. A total of 16 studies (Guerriero et al. Citation1996a, Citation1996b, Citation2007, Ubaldi et al. Citation1998, Exacoustos et al. Citation2003, Hottat et al. Citation2009, Grasso et al. Citation2010, Hudelist et al. Citation2011, Manganaro et al. Citation2012, Scarella et al. Citation2013, Piessens et al. Citation2014, Khan et al. Citation2018, Sofic et al. Citation2018, Bhatty et al. Citation2020, Goncalves et al. Citation2021, Puri et al. Citation2022) were included in the systematic review and meta-analyses representing 1976 participants (). summarises the key characteristics of the included studies. They were published in peer-reviewed journals between 1996 and 2022 (median year, 2011). The prevalence of endometrioma varies from 16% to 80% across studies (median 31.5%). Ten studies (Guerriero et al. Citation1996a, Citation1996b, Citation2007, Ubaldi et al. Citation1998, Exacoustos et al. Citation2003, Hudelist et al. Citation2011, Scarella et al. Citation2013, Piessens et al. Citation2014, Bhatty et al. Citation2020, Goncalves et al. Citation2021) (1460 participants) reported on TVUS alone, four (Hottat et al. Citation2009, Grasso et al. Citation2010, Manganaro et al. Citation2012, Khan et al. Citation2018) (402 participants) on MRI alone and two (Sofic et al. Citation2018, Puri et al. Citation2022) (114 participants) on both TVUS and MRI. TVUS was performed using a probe with a resolution between 3.5 and 9 MHz [two missing data (Bhatty et al. Citation2020, Goncalves et al. Citation2021)]. MRI scans were performed with a 1.5 or 3.0 T system (one with missing data (Khan et al. Citation2018)). Two studies (Manganaro et al. Citation2012, Khan et al. Citation2018) used direct laparoscopic visualisation alone as reference standard, while the others used histopathologic confirmation (Guerriero et al. Citation1996a, Citation1996b, Citation2007, Ubaldi et al. Citation1998, Exacoustos et al. Citation2003, Hottat et al. Citation2009, Grasso et al. Citation2010, Hudelist et al. Citation2011, Scarella et al. Citation2013, Piessens et al. Citation2014, Sofic et al. Citation2018, Bhatty et al. Citation2020, Goncalves et al. Citation2021, Puri et al. Citation2022) [specimens obtained at laparoscopy in eight studies (Ubaldi et al. Citation1998, Exacoustos et al. Citation2003, Guerriero et al. Citation2007, Grasso et al. Citation2010, Hudelist et al. Citation2011, Piessens et al. Citation2014, Goncalves et al. Citation2021, Puri et al. Citation2022) and at laparotomy or laparoscopy in five studies (Guerriero et al. Citation1996a, Citation1996b, Hottat et al. Citation2009, Scarella et al. Citation2013, Sofic et al. Citation2018), with one (Bhatty et al. Citation2020) missing data—i.e. whether it was a laparoscopy and/or laparotomy].
Figure 1. Flow diagram according to PRISMA (preferred reporting items for systematic review and meta-analysis) 2020. CINAHL, Cumulative Index to Nursing and Allied Health Literature.
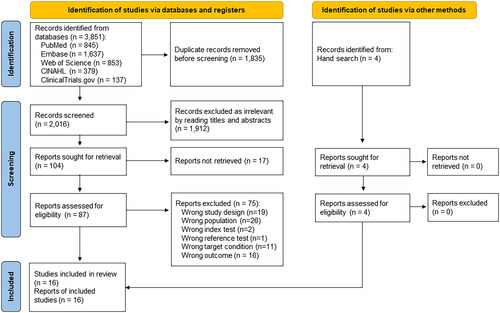
Table 1. Characteristics of included studies.
Risk of bias and applicability
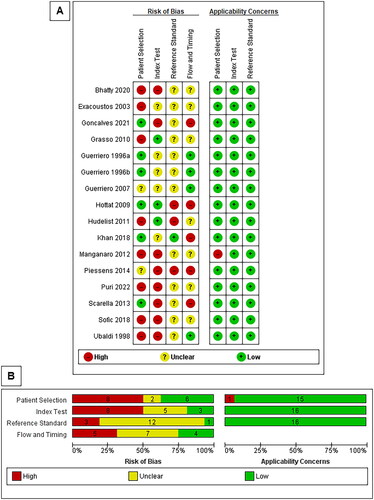
The risk of bias was unclear (due to poor reporting) or high in at least one domain in all the studies (). All studies were attributed to low applicability concerns for all domains, except for one study (Manganaro et al. Citation2012) that enrolled participants to assess MRI accuracy and incorporated some participants based on ultrasound findings. Inclusion or exclusion of this study from the analysis did not modify the results (Supplementary Appendix 4).
Figure 2. Risk of bias and applicability concerns summary: review authors’ judgements about each domain for each study (A) and presented for each domain as percentages across all studies (B). Note: The numbers on the bar for each domain represent the number of studies scored as high, unclear or low risk of bias or applicability.
Synthesis of results
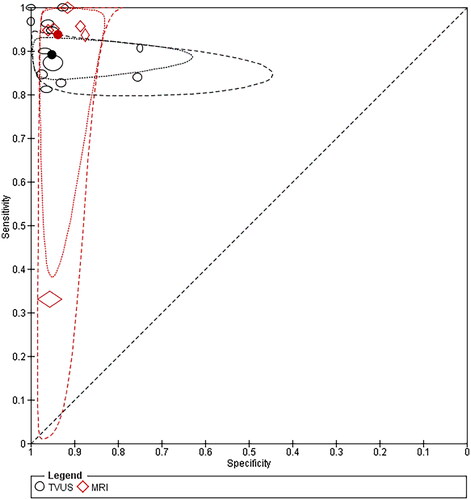
The forest plot () features were consistently high study-specificity (for TVUS), high study-sensitivity (for MRI) and greater uncertainty (indicated by the CI width) and variability (indicated by the scatter of point estimates) in sensitivity than in specificity across studies, mainly for TVUS. A potential outlier (Khan et al. Citation2018) in the assessment of MRI was identified in the SROC plot with a sensitivity of 0.33 and specificity of 0.96 (). By excluding this study from the meta-analysis, the estimate appeared slightly higher for MRI sensitivity (with reduced CI indicating better precision) and comparable for MRI specificity compared with the respective sensitivity and specificity values obtained from the six MRI studies (Supplementary Appendix 4). Substantial heterogeneity was observed in sensitivity and specificity, as indicated by the extent of the prediction regions around the summary points in the SROC plot ().
Figure 3. Forest plot exhibiting study‐specific estimates and pooled sensitivity and specificity for TVUS (A) and MRI (B) in diagnosing ovarian endometriosis. TP, true positive; FP, false positive; FN, false negative; TN, true negative; CI, confidence interval. Notes: Studies are presented for TVUS and MRI and are ordered according to the year of publication. Summary or pooled values for sensitivity and specificity are represented by polygons (black dashed vertical lines mark the point estimates for sensitivity and specificity) and study-specific estimates of sensitivity and specificity are represented by squares with 95% confidence intervals (black solid horizontal lines).
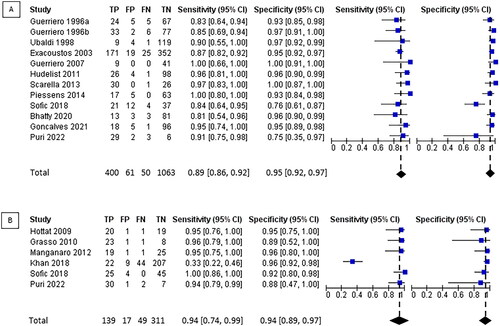
Figure 4. Summary receiver operating characteristic plot of TVUS and MRI for detection of ovarian endometriosis. TVUS, transvaginal ultrasound; MRI, magnetic resonance imaging. Notes: The markers for each test on the summary receiver operating characteristic plots represent pairs of sensitivity and specificity from the included studies. The size of each marker was scaled based on the sensitivity and specificity of the study. The solid circles (summary points) represent the summary (pooled) estimates of the sensitivity and specificity for each test. Each summary point is surrounded by a dotted line representing the 95% confidence region and a dashed line representing the 95% prediction region (the region within which it is 95% certain that the results of a new study will lie).
Pooled sensitivity of TVUS and MRI for endometrioma was 0.89 (95% CI, 0.86–0.92) and 0.94 (95% CI, 0.74–0.99), respectively. Pooled specificity of TVUS and MRI for endometrioma was 0.95 (95% CI, 0.92–0.97) and 0.94 (95% CI, 0.89–0.97), respectively ().
TVUS met the criteria for the SPIN triage test (specificity ≥95% and sensitivity ≥50%), but did not meet the criteria for either a replacement test (sensitivity ≥94% and specificity ≥79%) or a SNOUT triage test (sensitivity ≥95% and specificity ≥50%). Publication year (p = 0.15), TVUS probe resolution (p = 0.37), risk of bias in participant selection (p = 0.80), risk of bias in the conduct or interpretation of TVUS (p = 0.70) and risk of bias in participants’ flow and timing (p = 0.58) did not explain the heterogeneity (Supplementary Appendix 5). Other planned subgroup analyses were not performed because of the lack of data in the included studies. Using the leave-one-out procedure, the specificity appeared higher with a more precise estimate after excluding one study (Sofic et al. Citation2018) (Supplementary Appendix 4). The MRI did not meet the criteria for replacement, SPIN or SNOUT triage tests. We did not explore the sources of heterogeneity among MRI studies (<10 studies).
In the indirect comparison of the two imaging modalities (12 studies), there was no statistically significant difference in pooled sensitivity and specificity (p-value of 0.47 and 0.51, respectively) (Supplementary Appendix 6). In only two studies (Sofic et al. Citation2018, Puri et al. Citation2022), the imaging modalities were directly compared in the same set of patients. Compared to MRI, TVUS had lower diagnostic accuracy with a lower pooled specificity (0.75; 95% CI, 0.63–0.85 versus 0.91; 95% CI, 0.81–0.96; with a p-value of 0.02) but no statistical difference in pooled sensitivities (0.88; 95% CI, 0.76–0.94 versus 0.97; 95% CI, 0.87–0.99; with a p-value of 0.07) (, Supplementary Appendix 6).
Discussion
In this systematic review based on prospective studies, we observed the high accuracy of TVUS and MRI for diagnosing endometrioma. Based on all the studies, there was no statistically significant difference in diagnostic accuracy between the two modalities (indirect comparison). Unfortunately, only two studies allowed for a direct comparison of the modalities (all participants underwent TVUS and MRI), and all studies were attributed to a high risk of bias, which limits the interpretation of the results.
Based on this systematic review, TVUS and MRI are good imaging options for the diagnosis of endometriomas. However, diagnostic accuracy is not the only factor that should be considered when choosing a diagnostic modality. Accessibility, reproducibility, tolerance and cost are other important factors (Maheux-Lacroix et al. Citation2014, Citation2016). Compared to MRI, standard pelvic ultrasound is usually low cost, widely accessible and better tolerated than MRI (Kinkel et al. Citation2006, Hudelist et al. Citation2011, Liu and Ren Citation2021, Guerriero et al. Citation2022). This finding supports the idea that TVUS should be the first-choice modality for the diagnosis of endometrioma. In women with suspected endometriosis, TVUS can also be used to diagnose other endometriosis lesions (Guerriero et al. Citation2022), but this requires expertise and more time than a basic pelvic ultrasound.
TVUS met the predetermined criteria for the SPIN triage test (specificity of 95%) in this review, while MRI almost met the criteria (specificity of 94%). When an endometrioma is diagnosed using one of these modalities, it is considered valid enough to confirm the diagnosis. However, when no endometrioma is diagnosed, laparoscopy can be considered to push the investigation according to recent international guidelines if relevant in the clinical context (Becker et al. Citation2022).
Direct comparison of MRI and TVUS (all participants undergoing TVS and MRI) was limited by the number (two studies, 114 patients) and quality (low) of available studies for this analysis. MRI was superior to TVUS in terms of specificity and could therefore be superior in avoiding false-positive results (endometrioma that ends up as cysts of another nature). However, this meta-analysis was based on limited data, which jeopardised the precision and applicability of the results (Deeks et al. Citation2022a). The importance of recognising the subtypes of pelvic endometriosis should be emphasised, since they may affect symptom presentation and method of diagnosis. Indeed, there is potential for overlap between subtypes. Some patients may have multiple subtypes of the disease simultaneously, such as the frequent co-occurrence of endometriomas and deep endometriosis (Allaire et al. Citation2023). Particularly, it was found that, in patients who experience severe pain, finding an endometrioma on ultrasound should lead to additional investigation (Chapron et al. Citation2003). Thus, the assessment and comparison of the sensitivity and specificity of TVUS and MRI appear beneficial in specific situations. Furthermore, combining the advantages of these two individual imaging methods may enhance abnormality detection beyond what each modality can achieve alone (Bazot et al. Citation2022). We acknowledge that diagnostic accuracy is not the only factor that should be considered when choosing a diagnostic method. The tolerance, costs and diagnostic accuracy of such imaging modalities or their combination will need to be assessed and compared to define the roles of these imaging options in the care of women with suspected endometriosis.
This review was limited by the quality of the included studies, and all studies were of low methodological quality, underlining the persistent need for high-quality studies on the subject. Future studies should clearly report the diagnostic criteria for endometriotic lesions and allow for a direct comparison of imaging options. We observed heterogeneity between studies, which is expected for systematic reviews of DTA studies (Macaskill et al. Citation2022). We were unable to explain the heterogeneity of our subgroup analyses and believe that variations in imaging techniques (bowel preparation, contrast, etc.) and expertise (skills of the operator) (Fraser et al. Citation2015) might have contributed to the differences between the studies, although the data did not allow us to test these hypotheses. However, multiple studies have been published since the last review on imaging modalities (including TVUS and MRI) for the non-invasive diagnosis of different types of endometriosis (Nisenblat et al. Citation2016), allowing for more precise estimates, more powerful analyses and exclusion of retrospective designs (Bazot et al. Citation2009). This was performed using an a priori protocol and rigorous methodology (Deeks et al. Citation2022a); thus, our results were both comprehensive and reproducible.
In conclusion, both TVUS and MRI have a high accuracy for diagnosing endometriomas. However, the conclusions are based on low-quality studies, and future work is required to appropriately compare each option in terms of diagnostic accuracy, tolerability, reproducibility, availability and costs, while distinguishing between basic and more specialised ultrasound for endometriosis.
Author contributions
Study conception and design: F.S.K., H.T.V.Z. and S.M.L. Data collection: F.S.K., R.G.S., F.B. and S.M.L. Statistical analysis: F.S.K. Data analysis and interpretation of results: F.S.K., R.G.S., F.B., H.T.V.Z., A.N. and S.M.L. Writing—original draft: F.S.K. Writing—review and editing: F.S.K., R.G.S., F.B., H.T.V.Z., A.N. and S.M.L. Supervision: S.M.L.
Supplemental Material
Download PDF (922.2 KB)Acknowledgement
None.
Data availability statement
The authors confirm that data supporting the findings of this study are available within the article and its supplementary materials.
Additional information
Funding
References
- Allaire, C., Bedaiwy, M.A., and Yong, P.J., 2023. Diagnosis and management of endometriosis. Canadian Medical Association Journal, 195 (10), E363–E371.
- Anastasiu, C.V., et al., 2020. Biomarkers for the noninvasive diagnosis of endometriosis: state of the art and future perspectives. International Journal of Molecular Sciences, 21 (5), 1750.
- Andysz, A., et al., 2018. Endometriosis – the challenge for occupational life of diagnosed women: a review of quantitative studies. Medycyna Pracy, 69 (6), 663–671.
- Arruda, M.S., et al., 2003. Time elapsed from onset of symptoms to diagnosis of endometriosis in a cohort study of Brazilian women. Human Reproduction, 18 (4), 756–759.
- Bazot, M., et al., 2009. Diagnostic accuracy of physical examination, transvaginal sonography, rectal endoscopic sonography, and magnetic resonance imaging to diagnose deep infiltrating endometriosis. Fertility and Sterility, 92 (6), 1825–1833.
- Bazot, M., Spagnoli, F., and Guerriero, S., 2022. Magnetic resonance imaging and ultrasound fusion technique in gynecology. Ultrasound in Obstetrics & Gynecology: The Official Journal of the International Society of Ultrasound in Obstetrics and Gynecology, 59 (2), 141–145.
- Becker, C.M., et al., 2022. ESHRE guideline: endometriosis. Human Reproduction Open, 2022 (2), hoac009.
- Bhatty, S., et al., 2020. Role of ultrasonography in diagnosing adnexal masses: cross-sectional study. Pakistan Journal of Medical & Health Sciences, 14 (4), 917–918.
- Chapron, C., et al., 2003. Deep infiltrating endometriosis: relation between severity of dysmenorrhoea and extent of disease. Human Reproduction, 18 (4), 760–766.
- Deeks, J.J., Higgins, J.P.T., and Altman, D.G., eds., 2022a. Cochrane Handbook for Systematic Reviews of Diagnostic Test Accuracy (Version 2.0, 2022). Cochrane. Available from: https://training.cochrane.org/handbook-diagnostic-test-accuracy/current.
- Deeks, J.J., Higgins, J.P.T., and Altman, D.G. eds., 2022b. Chapter 9: analysing data and undertaking meta-analyses. In: J.J. Deeks, P. Bossuyt, M. Leeflang, Y. Takwoingi and E. Flemyng, eds., 2022. Cochrane Handbook for Systematic Reviews of Diagnostic Test Accuracy (Version 2.0, 2022). Cochrane. Available from: https://training.cochrane.org/handbook-diagnostic-test-accuracy/current.
- Deslandes, A., et al., 2020. Current status of transvaginal ultrasound accuracy in the diagnosis of deep infiltrating endometriosis before surgery: a systematic review of the literature. Journal of Ultrasound in Medicine: Official Journal of the American Institute of Ultrasound in Medicine, 39 (8), 1477–1490.
- Exacoustos, C., et al., 2003. Staging of pelvic endometriosis: role of sonographic appearance in determining extension of disease and modulating surgical approach. The Journal of the American Association of Gynecologic Laparoscopists, 10 (3), 378–382.
- Fraser, M.A., et al., 2015. Routine vs. expert-guided transvaginal ultrasound in the diagnosis of endometriosis: a retrospective review. Abdominal Imaging, 40 (3), 587–594.
- Goncalves, M.O., et al., 2021. Systematic evaluation of endometriosis by transvaginal ultrasound can accurately replace diagnostic laparoscopy, mainly for deep and ovarian endometriosis. Human Reproduction, 36 (6), 1492–1500.
- Grasso, R.F., et al., 2010. Diagnosis of deep infiltrating endometriosis: accuracy of magnetic resonance imaging and transvaginal 3D ultrasonography. Abdominal Imaging, 35 (6), 716–725.
- Guerriero, S., et al., 1996a. Tumor markers and transvaginal ultrasonography in the diagnosis of endometrioma. Obstetrics and Gynecology, 88 (3), 403–407.
- Guerriero, S., et al., 1996b. Transvaginal ultrasonography combined with CA-125 plasma levels in the diagnosis of endometrioma. Fertility and Sterility, 65 (2), 293–298.
- Guerriero, S., et al., 2022. Advances in imaging for assessing pelvic endometriosis. Diagnostics, 12 (12), 2960.
- Guerriero, S., et al., 2007. Tenderness-guided” transvaginal ultrasonography: a new method for the detection of deep endometriosis in patients with chronic pelvic pain. Fertility and Sterility, 88 (5), 1293–1297.
- Haynes, R.B., 2012. Clinical epidemiology: how to do clinical practice research. USA: Lippincott Williams & Wilkins.
- Higgins, J., Thomas, J., Chandler, J., Cumpston, M., Li, T. and Page, M., eds., 2022. Cochrane Handbook for Systematic Reviews of Interventions version 6.3 (updated February 2022). Cochrane. Available from: https://training.cochrane.org/handbook.
- Hottat, N., et al., 2009. Endometriosis: contribution of 3.0-T pelvic MR imaging in preoperative assessment—initial results. Radiology, 253 (1), 126–134.
- Hudelist, G., et al., 2011. Transvaginal sonography vs. clinical examination in the preoperative diagnosis of deep infiltrating endometriosis. Ultrasound in Obstetrics & Gynecology: The Official Journal of the International Society of Ultrasound in Obstetrics and Gynecology, 37 (4), 480–487.
- International Working Group of AAGL, et al., 2021. An international terminology for endometriosis, 2021. Human Reproduction Open, 2021 (4), hoab029.
- Kennedy, S., et al., 2005. ESHRE guideline for the diagnosis and treatment of endometriosis. Human Reproduction, 20 (10), 2698–2704. and,
- Khan, K.S., et al., 2018. MRI versus laparoscopy to diagnose the main causes of chronic pelvic pain in women: a test-accuracy study and economic evaluation. Health Technology Assessment, 22 (40), 1–92.
- Kinkel, K., et al., 2006. Diagnosis of endometriosis with imaging: a review. European Radiology, 16 (2), 285–298.
- Leyland, N., et al., 2010. Endometriosis: diagnosis and management. Journal of Obstetrics and Gynaecology Canada, 32 (7), S1–S3.
- Liu, N. and Ren, Q., 2021. Magnetic resonance imaging feature analysis and evaluation of tubal patency under convolutional neural network in the diagnosis of infertility. Contrast Media & Molecular Imaging, 2021, 5175072–5175077.
- Macaskill, P., Takwoingi, Y., Deeks, J.J., and Gatsonis, C., 2022. Chapter 9: Understanding meta- analysis. In: J.J. Deeks, P. Bossuyt, M. Leeflang, Y. Takwoingi, and E. Flemyng, eds., 2022. Cochrane Handbook for Systematic Reviews of Diagnostic Test Accuracy (Version 2.0, 2022). Cochrane. Available from: https://training.cochrane.org/handbook-diagnostic-test-accuracy/current.
- Maheux-Lacroix, S., et al., 2014. Hysterosalpingosonography for diagnosing tubal occlusion in subfertile women: a systematic review with meta-analysis. Human Reproduction, 29 (5), 953–963.
- Maheux-Lacroix, S., et al., 2016. Imaging for polyps and leiomyomas in women with abnormal uterine bleeding: a systematic review. Obstetrics and Gynecology, 128 (6), 1425–1436.
- Maheux-Lacroix, S., et al., 2020. Diagnostic accuracy of intraoperative tools for detecting endometriosis: a systematic review and meta-analysis. Journal of Minimally Invasive Gynecology, 27 (2), 433–440.e1.
- Manganaro, L., et al., 2012. Feasibility of 3.0T pelvic MR imaging in the evaluation of endometriosis. European Journal of Radiology, 81 (6), 1381–1387.
- Nisenblat, V., et al., 2016. Imaging modalities for the non-invasive diagnosis of endometriosis. The Cochrane Database of Systematic Reviews, 2 (2), CD009591.
- Parasar, P., Ozcan, P. and Terry, K.L., 2017. Endometriosis: epidemiology, diagnosis and clinical management. Current Obstetrics and Gynecology Reports, 6 (1), 34–41.
- Piessens, S., et al., 2014. Can anyone screen for deep infiltrating endometriosis with transvaginal ultrasound? The Australian & New Zealand Journal of Obstetrics & Gynaecology, 54 (5), 462–468.
- Puri, S., et al., 2022. Comparison between ultrasonography and magnetic resonance imaging in endometriosis: a prospective study in a tertiary hospital. Journal of South Asian Federation of Obstetrics and Gynaecology, 14 (2), 85–90.
- R Core Team, 2023. R: a language and environment for statistical computing. R Foundation for Statistical Computing, Vienna, Austria. https://www.R-project.org/.
- Reitsma, J.B., et al., 2005. Bivariate analysis of sensitivity and specificity produces informative summary measures in diagnostic reviews. Journal of Clinical Epidemiology, 58 (10), 982–990.
- Salameh, J.-P., et al., 2020. Preferred reporting items for systematic review and meta-analysis of diagnostic test accuracy studies (PRISMA-DTA): explanation, elaboration, and checklist. BMJ, 370, m2632.
- Scarella, C.A., et al., 2013. Ultrasonido transvaginal para la detección preoperatoria de endometriosis profunda en pacientes con dolor pélvico crónico. Revista Chilena De Obstetricia y Ginecología, 78 (2), 114–118.
- Sofic, A., et al., 2018. Magnetic resonance imaging (MRI) and transvaginal ultrasonography (TVU) at ovarian pain caused by benign ovarian lesions. Acta Informatica Medica, 26 (1), 15–18.
- Thompson, S.G. and Sharp, S.J., 1999. Explaining heterogeneity in meta-analysis: a comparison of methods. Statistics in Medicine, 18 (20), 2693–2708.
- Ubaldi, F., et al., 1998. The role of transvaginal ultrasonography In the direction of pelvic pathologies in the infertility workup. Human Reproduction, 13 (2), 330–333.
- Whiting, P.F., et al., 2011. QUADAS-2: a revised tool for the quality assessment of diagnostic accuracy studies. Annals of Internal Medicine, 155 (8), 529–536.
- Wykes, C.B., Clark, T.J. and Khan, K.S., 2004. Accuracy of laparoscopy in the diagnosis of endometriosis: a systematic quantitative review. BJOG: An International Journal of Obstetrics and Gynaecology, 111 (11), 1204–1212.
- Zondervan, K.T., Becker, C.M. and Missmer, S.A., 2020. Endometriosis. The New England Journal of Medicine, 382 (13), 1244–1256.