?Mathematical formulae have been encoded as MathML and are displayed in this HTML version using MathJax in order to improve their display. Uncheck the box to turn MathJax off. This feature requires Javascript. Click on a formula to zoom.
Abstract
This study examines the rationality of Japanese government construction forecasts between 1960 and 2019 and investigates whether the construction forecasts have an information advantage over other government’s forecasts using a recently developed test under instabilities in forecasting environments. The Japanese government construction forecasts broadly served as a reliable benchmark for most of the economic development process until the 1990s. This finding suggests that those construction forecasts contributed to effective and careful resource allocation planning in the construction and related industries and to the Japanese economy’s post-war growth. There were, however, a few irrational construction forecasts after 2000, indicating that recent construction forecasts can be improved by incorporating information from the government’s macroeconomic forecasts. The results indicate that misleading results demonstrating that all forecasts were rational were obtained if relying on the standard rationality test. These findings also suggest that governmental agencies in various countries may benefit from publishing construction forecasts because those forecasts would contribute to promoting sustainable development and growth in construction industry, not only in advanced but also developing countries.
Introduction
The construction industry and its activity are important economic sectors during any stage of economic development. Construction activity significantly contributes to economic growth in many countries because it provides employment and business opportunities (Ofori Citation1990). It is affected by overall economic performance because construction investment responds to activity in other domestic sectors (Hua Citation1996), and is both directly and indirectly impacted by government policies and external shocks (Ofori Citation1990). Business cycles in the domestic economy, government policies, and external shocks increase the difficulty of construction forecasting. More reliable forecasts of construction demand would, therefore, help not only governments but also private construction industry organizations to propose preventive policies and strategies for supporting sustainable growth in the overall economy and the industry.
Demand forecasting for the construction market has attracted considerable attention from construction economists. More reliable analytical techniques for forecasting construction demand were identified by comparing the prediction accuracy of time-series forecasting models, often employing univariate, multivariate, and vector error correction models (VECM). Further, key macroeconomic variables serving as good predictors of construction demand and investment have been investigated and identified. However, evaluation of publicly available construction forecasts has rarely been performed (Oshodi et al. Citation2020). In part, this is due to a lack of forecasts with a sufficiently large number of observations. This is in a sharp contrast to the macroeconomic forecasting literature, where forecasts of key macroeconomic variables produced by authorities, including central banks and governments, have been extensively examined regarding their performance.
One strand of the macroeconomic forecasting literature evaluates whether forecasts meet some minimal requirements including unbiasedness or information efficiency, namely forecast rationality (e.g. Mincer and Zarnowitz Citation1969, West and McCracken Citation1998), and provides insights into how forecasters form their expectations. This is because economic forecasts are crucial for the decision making of various economic agents, including industries, households, and policymakers. If economic agents use irrational forecasts for decision making, the outcomes would be inefficient and government policies would not be fully effective, implying that government forecasts play an important role in the context of policymaking and policy effectiveness (Beaudry and Willems Citation2022).
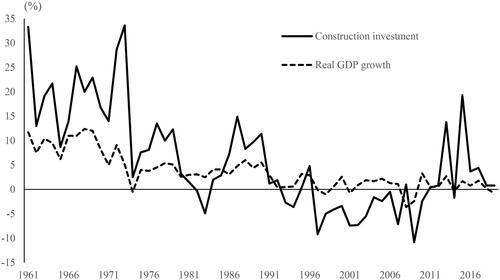
This study investigates the rationality of government construction forecasts in Japan, which have been published since 1960, and whether the construction forecasts have an information advantage over other government’s forecasts using a newly developed test under instabilities in forecasting environments. It also examines whether the construction forecasts have an information advantage over other related variables to gain insights into improving those forecasts. The forecasts cover a long period that includes various stages of economic development,Footnote1 with high economic growth in the 1960s, moderate growth in the 1970s and 1980s, and prolonged stagnated growth after the 1990s, including external shocks (oil shocks in 1970s, the Asian currency crisis in late 1990s, and the global financial crisis in 2007–2008), domestic business cycles, as well as internal shocks (bubble economy in the late 1980s and its burst in the early 1990s, and the Great East Japan Earthquake in 2011). As indicated by , total construction exhibits similar patterns to temporal economic growth, although exceptions exist because of the effects of natural disasters and policies. Therefore, this analysis provides evidence of whether the government construction forecasts have provided reliable information on the construction industry over the various stages of Japan’s economic development. In addition, analysis of the government’s forecast rationality is of particular interest, especially considering Japan’s postwar era (between 1950s and 1980s), when it was often referred to as a “Construction StateFootnote2.” During this period, the construction industry played a significant economic role (Woodall Citation1996).
Figure 1. Construction investment and economic growth.
Although it proves enlightening to examine the construction forecasts for the long sample period and various events, a crucial practical problem exists: economic time-series data are prone to instabilities, which violates the stationarity assumed in the standard forecast rationality tests. A recent notable example is the 2007–2008 global financial crisis when several macroeconomic variables and their relationships changed drastically. More generally, Stock and Watson (Citation1996) found considerable instabilities in large datasets of key macroeconomic variables. To address this issue, this study uses Rossi and Sekhposyan’s (Citation2016) “Fluctuation Rationality” test, which enables the evaluation of forecast rationality in environments characterized by instabilities. In the presence of instabilities, Fluctuation Rationality tests are more powerful than traditional tests and illustrate when predictive ability appears or breaks down in the data.
The rest of the paper is organized as follows. The next section reviews related studies. The third section describes the data and examines forecast performances based on error measures. The fourth section introduces the statistical approaches. The fifth section presents the results and investigates in which construction forecasts and periods those forecasts could be improved. The sixth section discusses the findings’ implications. Finally, the last section concludes the paper.
Literature review
While considerable effort has been devoted to building statistical models for construction demand forecasting, studies rarely evaluate the rationality of construction demand forecasts. This study is, to the best of my knowledge, the first that evaluates rationality of publicly available construction demand forecasts. This type of forecast evaluation is called “tests of absolute forecasting performances”; it provides insights into how forecasters form their expectations. The literature contained no such studies, although Oshodi et al. (Citation2020) conducted a systematic review of 48 articles related to construction demand forecasts since 1975. Most studies in construction forecasting belong to another strand, often called “tests of relative forecasting performances”, where the focus is on identifying which of two competing forecasting models perform better (e.g. Diebold and Mariano Citation1995, Clark and McCracken Citation2001).
The literature on building statistical forecasting models for construction demand can be broadly classified into two types of the latter strand: the univariate and the causal models (Fan et al. Citation2010). By using univariate modelling techniques that include exponential smoothing and Box-Jenkins techniques, the former model has been used for predicting construction demand, prices, or activities (Hua and Pin Citation2000, Goh Citation2005, Wong et al. Citation2007). Fan et al. (Citation2010) examined forecasting models that covered the period of the 1997 Asian economic crisis and the SARS epidemic. Tan et al. (Citation2015) developed a forecasting model to predict the annual growth of construction demand in Hong Kong. Kissi et al (Citation2018) found that the autoregressive integrated moving average model, incorporating exogenous variables such as construction tender price in Ghana, outperformed models that did not consider exogenous variables. Lei et al. (Citation2023) showed that machine learning approaches yielded superior performance in constructing output models for Hubei Province in China compared to time-series models.
There are also studies involving popular modelling techniques using causal models such as VECM (Neale and Ameen Citation2001, Wong et al. Citation2007). Wong and Ng (Citation2010) predicted how construction tender price outperformed univariate and multivariate time-series regression models in Hong Kong. Fan et al. (Citation2011) examined forecasting models of Hong Kong construction demand with a sample that covered the 1997 Asian economic crisis and the SARS epidemic. Jiang and Liu (Citation2011) and Jiang et al. (Citation2014) constructed forecasting models of Australian construction demand. Lunsford (Citation2015) examined residential investment in the US and found that ECM models outperform univariate and multivariate time-series models. Oteng-Abayie and Dramani (Citation2019) examined the co-movement between the prime building cost index and macroeconomic indicators in Ghana. Kim et al. (Citation2021) developed a forecasting model for the Korean residential construction and concluded that such forecasting models can provide insights to the construction industry stakeholders.
Rational expectations that economic agents use all available information and make decisions have been one of the defining features in the rebuilding of macroeconomic models starting in the 1970s. Additionally, there have also been discussions that, in forming their expectations, economic agents typically face constraints on information acquisition and processing (Coibion and Gorodnichenko Citation2012). To examine rationality, which has been one of the major issues, “tests of absolute forecasting performances” have been widely used and provided substantial evidence indicating bias in their forecasts, which stands as evidence against their rationality. Frankel (Citation2011) and Frankel and Schreger (Citation2013) found that government budgetary forecasts were overly optimistic. For Japan, Tsuchiya (Citation2016) found that the year-ahead real and nominal gross domestic product (GDP) forecasts by the Japanese government were too optimistic, and the inflation forecasts were biased. Martinez (Citation2015) and Ericsson (Citation2017) showed that U.S government forecasts of the federal debt were not rational. Arai (Citation2020) found evidence against the rationality of the Congressional Budget Office’s macroeconomic and budgetary forecasts. Although most of these studies did not consider instability in the forecast environment, Rossi and Sekhposyan (Citation2016) found that the rationality of inflation forecasts in the U.S. was rejected in their test but not rejected in the standard test.
The studies on those construction forecasts in “tests of relative forecasting performances” showed that major macroeconomic variables, including GDP, interest rates, and exchange rates, were closely related to the construction forecasts’ performances. The studies on the governments’ macroeconomic forecasts except construction forecasts, in “tests of absolute forecasting performances”, produced evidence against rationality. Therefore, this study investigates rationality of the government construction forecasts under instability and the relationship with the government’s macroeconomic forecasts and public works budget to draw implications and assist in improving the government’s construction forecasts.
Data
Forecast and actual data
Since 1960, the Ministry of Land, Infrastructure, Transport and Tourism (MLIT) has published construction forecasts for the ongoing fiscal year in and around June. For example, fiscal 2010 spans the period from April 2010 to March 2011. Since 1960, MLIT publishes two types of sub-components forecasts: construction forecasts in the public and private sectors and construction forecasts in building and civil engineering. Therefore, this study examines the total construction forecast as well as its two pairs of sub-components to obtain insights into whether there are differences in forecast performances and rationality among those categories, as well as insights into the relationship between the private and public sectors.
Building consists of housing and non-housing construction regardless of its nature (i.e. whether public or private). Civil engineering consists of public infrastructure and other types of public construction, including railroad, telecommunication, electric power, private gas companies, and private sector real estate and construction, among others.Footnote3 The MLIT produces its public sector forecasts using projections of the Japanese macroeconomy- and public works-related budgets released by the National Government and local governments, both available in April, at the latest. The MLIT indicates that its forecasts for the private sector are generated by employing forecast models of construction starts and considering various organizations’ capital investment plans. However, the MLIT does not reveal specific forecasting models (Ministry of Land, Infrastructure, Transport and Tourism Citation1998). Every year, the construction forecasts are used as a reference in corporate management and the construction industry; the construction forecasts are used to develop their investment plans (Ministry of Land, Infrastructure, Transport and Tourism Citation2021). The construction forecasts are also used to assess risk and develop business strategies from a financial perspective (Miura et al. Citation2021).
The proportion of public construction to total construction is between 30% and 45%. The share of private construction to public construction varies between 55% and 70%. The share of building construction is between 50% and 65%, while the share of civil engineering construction is between 35% and 50%. During the sample period, more than 85% of the building construction was attributed to private construction, while around 75% of the civil engineering construction was attributed to public construction. These trends are reflected in the fluctuations observed in the proportion of public and private constructions over the sample period. The share of private construction in building construction increased in the late 1980s and decreased in the 1990s, whereas the share of public construction in civil engineering decreased in the late 1980s and increased in the 1990s and the early 2000s.
Actual values were obtained from publications releasing the construction forecasts. Actual values for a given year are published two years later because the statistics for calculating actual values are unavailable in the following year’s publication. This study examines the forecasts up to the 2019 fiscal year because the actual values are only available up to that year. Note that the published percentage changes from the previous fiscal years in the actual and forecast data are used in my analysis.
shows actual and forecast values of total construction over the sample period.Footnote4 The actual growth rates showed a downward trend from the early sample period to the end of the 2000s, and a slight increase in the 2010s, although they fluctuated greatly. The growth rates between 1960s and 1970s were on average larger than 10%, while they were on average around 5% in 1980s. In the 1990s, total construction exhibited negative growth owing to a decade of economic stagnation in Japan. In the 2000s, the negative growth rates rose because of the prolonged economic slowdown and the reduction of public construction caused by large budget deficits. In the 2010s, average growth rates returned to the level of the positive growth rates of the 1980s. Overall, average growth rates are similar between private and public construction, while the fluctuation in private construction is larger than that in public construction. Similarly, average growth rates do not differ between building and civil engineering construction, while the fluctuation in building construction is larger than that in civil engineering construction.
Figure 2. Forecast and actual values.
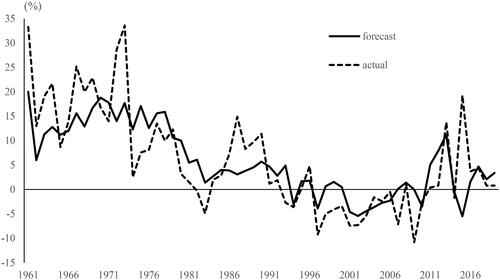
Forecast data exhibit patterns similar to those of the actual data. There are two notable differences. First, the average growth rates are broadly the largest in the 1970s. Second, variability in public and civil engineering construction in the 2010s is the largest owing to two unexpected shocks: the first is government spending, including public and civil engineering construction in 2011 and 2012 related to rebuilding after the Great East Japan earthquake. The second is the expenditure of a large amount of carryover funds from the previous year in 2015.
shows descriptive statistics of the actual and forecast data. It provides means, standard deviations, maximums, and minimums for total, public, private, building, and civil engineering construction, respectively. It also provides those descriptive statistics for the five construction investments by decade as well as a full sample. These descriptive statistics show results consistent with the characteristics shown in .
Table 1. Descriptive statistics.
Forecast performances
To measure forecast performance,Footnote5 a forecast error is defined as where
is the actual data and
is the projection in construction
at target year t. To capture forecast accuracy quantitatively, mean absolute error (MAE), and root mean squared error (RMSE) are calculated.
(1)
(1)
(2)
(2)
As MAE and RMSE are sensitive to outliers, median absolute error (MdAE) is also calculated:
(3)
(3)
To capture bias in the forecasts, mean forecast error (MFE) is calculated.
(4)
(4)
Further, owing to its wide use in the literature, Theil’s U is calculated to measure forecast accuracy.
(5)
(5)
This equation provides the ratio of the RMSE of the forecasts to the RMSE of a “no-change” or “naïve” forecast. In other words, Theil’s U evaluates the forecasts using the no-change forecasts as a benchmark. A value less than 1 indicates that the forecast is better than a no-change forecast, whereas a value greater than 1 indicates that the forecast is worse than a no-change forecast. Therefore, Theil’s U works as a benchmark stipulating that a forecast should meet the minimal criteria.
shows the error measures. The forecast performances measured as MAE and RMSE broadly improved from the beginning of the sample period through the 2000s and worsened during the 2010s. This indicates that the improvement in forecast performance is in line with the decrease in actual and forecast values. The forecast performance of public construction is better than the forecast performance of private construction in all decades except the 2010s. The forecast performance of civil engineering construction is better than the forecast performance of building construction in all decades except the 2010s. The forecast performances measured as MdAE are broadly consistent with those of MAE and RMSE, while the magnitude of deterioration in forecasting accuracy during the 2010s is smaller than those of MAE and RMSE. MFEs of all construction forecasts for the full sample are positive (i.e. underprediction). However, the degree of underprediction bias is not large. The direction and magnitude of bias differ among the decades. MFE of the total exhibits a large underprediction in the 1960s and underprediction in the 2010s, with overprediction in the remaining decades. The pattern of MFEs of private and building construction show the same pattern of total construction, while the MFEs of public and civil engineering constructions also exhibit underprediction in the 1970s and 1980s. Overprediction of private and building construction is relatively larger in 1990s and 2000s.
Table 2. Error measures.
In sum, the overall MFE exhibits less biased or unbiased forecast errors, whereas those forecast errors exhibit instability because there are decades with under- or over-prediction and decades with significant changes in the direction of the bias. Besides other studies, this finding is in line with that of Ericsson (Citation2017), who showed that the magnitude and direction of biases differ between booms and recessions. Therefore, the Fluctuation Rationality test is appropriate in this situation.
also shows Theil’s U. It shows that all but the public construction forecast for full sample is better than the benchmark naïve forecasts. The performance of the private construction forecast is good, while the performance of the public construction forecast is not good. Furthermore, the performances broadly tend to worsen in the 1980s and after the 2000s. The total construction forecast is better than the benchmark in all decades except the 1980s, when it is worse than the benchmark in the 1980s because of the poor performance of the public construction forecast in that decade. The public construction forecast underperforms the benchmark not only in the 1980s but also in the 1960s, 2000s, and 2010s. By contrast, the private construction forecast outperforms the benchmark in all decades. The building construction forecast is better than the benchmark except in the 1980s. The civil engineering construction forecast is inferior to the benchmark in the 1980s, 2000s, and 2010s.
Method
Rationality test
The most widely used test of forecast rationality (Mincer and Zarnowitz Citation1969, West and McCracken Citation1998) examines whether forecast errors have a zero mean or whether they are uncorrelated with any other variable known at the time of the forecast. The common test to evaluate forecast rationality is called the standard rationality test here. The test statistic of the standard rationality test is a simple F-test whose null hypothesis of rationality is that and
in the regression
(6)
(6)
where the forecast error is denoted by
is the realized value,
is the construction forecast based on the information available at time
and
is an error term. The test is designed to test the null hypothesis that
and, under the null, has an asymptotic chi-squared distribution with degrees of freedom of 1.
However, these assume stationarity and are invalid in the presence of instability. In fact, in the presence of instabilities, tests that focus on a model’s average out-of-sample performance may be misleading because they may average out instabilities. To make the tests robust to instability, Rossi and Sekhposyan (Citation2016) proposed estimating the following forecast rationality regressions in rolling windows of size m,
(7)
(7)
where
refers to an out-of-sample forecast made at time j using data available up to that time. At time t, parameter estimates
are obtained by using data from
to
By repeating this procedure at times
a sequence of parameter estimates is derived over time. Therefore, the hypothesis of rationality to be tested is
(8)
(8)
where
and
is the time-varying parameter value.
Rossi and Sekhposyan (Citation2016) proposed the following Fluctuation Rationality test,
where
(9)
(9)
is the Wald test in regressions computed at time t over rolling windows of size m and is based on the parameter estimated
which is sequentially estimated in the above regression, and
is a heteroscedasticity and autocorrelation robust estimator (HAC) of the asymptotic variance of the parameter estimate
in the same rolling window (Newey and West Citation1987). In this study, tests conducted under the assumption that
are referred to as “tests for forecast rationality.” The zero restriction under the null hypothesis ensures that the forecast errors are truly unpredictable given the information set available at the time the forecast is made.
This study focuses on a version of a test where the parameter estimator error is irrelevant, the forecasts are model free, or the model’s parameters are rollingly estimated in a finite window of data, although their test is valid in more general situations.Footnote6 The null hypothesis is rejected if where
is the critical value at the
% significance level with the number of restrictions equal to l. As shown by Rossi and Sekhposyan (Citation2016), the standard tests would have more power to detect lack of rationality in small samples, given that the forecast environment is stable; however, when the forecast environment is unstable, the standard tests, even asymptotically, may have no power in certain situations, while their proposed tests would have power.
Note that this study sets the rolling windows of size m equal to 25 to capture the economic development process, which is proposed by Rossi and Sekhposyan (Citation2016) as the minimum number of observations that are likely to satisfy required assumptions of the Fluctuation Rationality test. This study also examines the case of a window size at 30 because test results with the window size at 25 are not as robust, and the robustness improves significantly as the window size increases from 25 (Rossi and Sekhposyan Citation2016)Footnote7. In addition, to address autocorrelation in the error term in EquationEquations (6)(6)
(6) and Equation(7)
(7)
(7) , this study uses HAC standard errors with a lag of one (Newey and West Citation1987). The autocorrelation of order 1 in the error term arises due to overlapping forecast horizons. The overlapping forecast horizons result from the fact that the ongoing fiscal year forecasts are formed based on the estimated previous fiscal year forecasts; that is, at the time when ongoing fiscal-year forecasts are produced, the previous fiscal-year’s actual values are not yet available.
Information advantage test
This study’s second objective is to examine whether the construction forecasts have an information advantage over other related variables. To do so, this study also considers the following regression that extends the rationality test by incorporating other related variables:
(10)
(10)
where
refers to the other related variables
This extended regression encompasses another variable and tests whether the construction forecast
already contains the information that the newly included related variable
contains, which is called the information advantage test hereafter. To test whether the construction forecast has information advantage over other variables, the null hypothesis of no information advantage of the other variable that
is tested. If
the other variable does not contain information that can explain the forecast errors. This result would imply that the construction forecasts include information about the other variables. In other words, the construction forecasts have an information advantage over the other variables. Conversely, if
the other variables contain useful information related to the forecast errors that the construction forecasts do not contain, namely, the other variables have an information advantage over the construction forecasts.
The test statistic of the standard and Fluctuation Rationality tests for information advantage is calculated similarly to the rationality test. For the standard rationality test, under the null hypothesis that the test statistic has an asymptotic chi-squared distribution with degrees of freedom of 2. For the Fluctuation Rationality test, the Wald test statistic
is calculated in a similar manner as described by Rossi and Sekhposyan (Citation2016). Note that the critical value differs from the critical value in the rationality test because of the number of restrictions, which is one in the information advantage test instead of two in the rationality test. The rolling windows of size
equals 25 and HAC standard errors with a lag of one are used similarly to the rationality test.
Regarding the other related variables, this study focuses on the Japanese government’s macroeconomic forecasts and the public works-related budget for the same target years as the construction forecasts. These variables were selected because, as described in Forecast and actual data, the variables released by the government are input for the construction forecasts. Further, these macroeconomic variables can be considered closely related to construction activity. Specifically, these macroeconomic forecasts are those forecasts of GDP growth, private investment (private non-residential investment), residential investment, and public investment. Note that all but the GDP growth forecast are forecasts in nominal terms because the construction forecasts are also in nominal terms. The GDP growth forecasts are in real termsFootnote8 to represent the business cycle or overall economic development, and economic growth measured as real GDP growth—the measure of an economy’s total income—is a good indicator of construction investment in the literature.
The macroeconomic forecasts by the Japanese government are usually published in January each year. The public works-related budget that includes the supplementary budget is used because the initial budget, usually enacted in January, has been revised to include the supplemental one, usually enacted in April. Therefore, these additional variables can be incorporated into the construction forecasts, and thus can be included in the information set, because these construction forecasts are released in June.
Results
First, this section provides results of rationality tests for each construction forecast. Next, it investigates when rationality is not satisfied under the Fluctuation Rationality tests among those forecasts whose null hypothesis of rationality is rejected. Later, this section provides results of information advantage tests regarding whether other related forecasts have additional information over those construction forecasts and investigates when those other forecasts have additional information.
Rationality tests
presents the results of the standard rationality test and Fluctuation Rationality test for each construction forecast. It shows that all forecasts are rational under the standard rationality tests because the test statistics of the F-test cannot be rejected even at the 10% significance level. The Fluctuation Rationality test, however, indicates that public and private construction forecasts are not rational because the test statistics reaches maximums of 25.9 and 14.8, respectively, and the tests reject the null hypothesis of forecast rationality at the 1% significance level. By contrast, the rest of the construction forecasts remain rational under the Fluctuation Rationality tests. The results of public and private construction forecasts clearly illustrate the advantage of the Fluctuation Rationality test. If we rely on the standard rationality test, we obtain the misleading results that all forecasts were rational. The results also suggest that instabilities existed in Japan’s construction forecasts over economic development.
Table 3. Rationality tests.
To further investigate when forecast rationality is violated, shows sequence of test statistics of public and private construction forecasts over time. For the public construction forecast, the sequence of
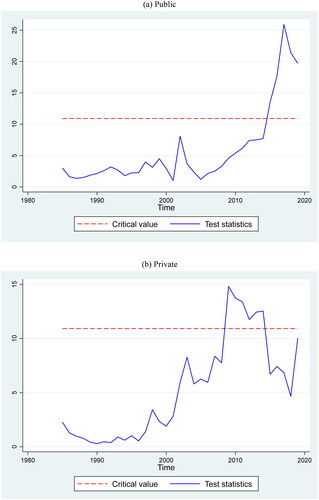
(depicted by a blue line) exceeds the critical value line at the 5% significance level (depicted by the dashed red line), which provides evidence against forecast rationality after 2015. For the private construction forecast, evidence against forecast rationality appears to be between 2009 and 2014. These findings suggest that forecast rationality is primarily likely to be violated in recent decades. This is probably attributable to the existence of the largest postwar external and domestic shocks, the global financial crisis and the Great East Japan Earthquake, during that period. This is consistent with the fact that the forecast performances indicated by Theil’s U worsened in the recent decade. In other words, the Japanese government construction forecasts have served as a reliable benchmark during most of the economic development process. This finding also suggests that these construction forecasts contributed to effective and careful resource allocation planning in the construction and related industries, and then also contributed to Japan’s economic growth.
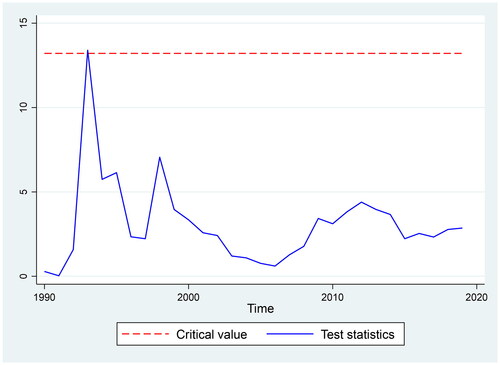
Figure 3. Test statistic of Fluctuation Rationality test.
Information advantage tests
shows the results of the information advantage tests under the standard and Fluctuation Rationality tests. It shows that a few of the standard rationality tests reject the null hypothesis of the information advantage of the construction forecast. However, GDP growth and residential investment forecasts provide additional information for public construction forecasts. Public works-related budgets provide additional information for civil engineering construction forecasts.
Table 4. Information advantage tests.
The Fluctuation Rationality tests indicate that the GDP, private, and residential investment forecasts provide additional information for all construction forecasts. The finding that the GDP forecast provides additional information for the construction forecast is in line with the literature showing that actual GDP growth is a good predictor of construction activity. The findings suggest that the information on the overall economic activity measured by GDP growth can improve construction forecasts. Further, the information on private sector activity measured by private and residential investments can also improve not only private construction forecasts but also public construction forecasts.
By contrast, the public investment forecast provides additional information only for the private and building construction forecasts. The public works related budget provides no additional information. These findings suggest that information regarding the public sector (measured by the public investment forecast and public works-related budget) is already incorporated in most of the construction forecasts, while information regarding the public sector can improve private-related construction forecasts (private and building construction with large share of private construction).
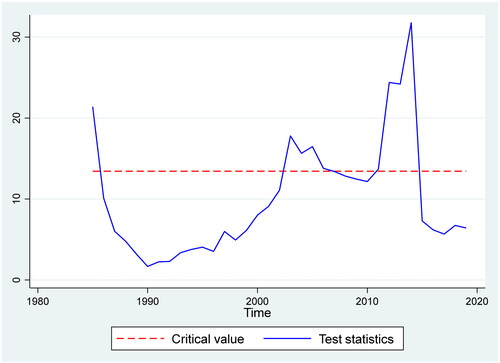
shows the sequences of test statistics for the total construction forecast regarding the real GDP growth forecast.Footnote9 The years and periods where the test statistics exceed the critical value of the 5% significance level vary among each construction forecast; however, the null hypothesis of information advantage is broadly rejected between 1985 and 1989 and between 2002 and 2014, suggesting that these construction forecasts could be improved in the mid to the end of the 1980s and the two recent decades by incorporating information included in the GDP growth forecasts. Particularly, information in the real GDP growth forecasts can improve the construction forecasts when GDP and construction growth are relatively low and volatile, as shown in and .
Figure 4. Test statistic of information advantage test regarding real GDP growth.
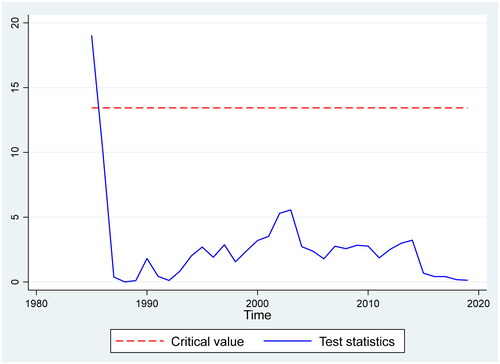
shows the sequences of test statistics for the total construction forecast regarding the private investment forecast.Footnote10 Although the years and periods where the test statistics exceed the critical value of the 5% significance level vary among each construction forecast, the null hypothesis of information advantage is broadly rejected after 1997. This suggests that those construction forecasts could be improved in most periods. Particularly, public and civil engineering construction forecasts can be improved in the early years of the sample periods, which indicates that private sector information can be utilized not only in the latter half of the samples but also the first half. and show that the construction forecasts can be broadly improved using the residential investment forecast between 1985 and 1988. The civil engineering construction forecast can also be improved after 2012. and show that the public investment forecast provides additional information for the private and building construction forecast only in 1985. Similar to the results in the rationality tests using the Fluctuation Rationality test, information advantage of the other variables emerged when the forecast performances worsened as indicated by Theil’s U.
Figure 5. Test statistic of information advantage test regarding private investment.
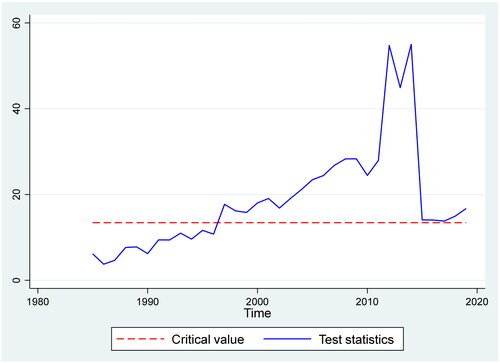
Figure 6. Test statistic of information advantage test regarding residential investment.
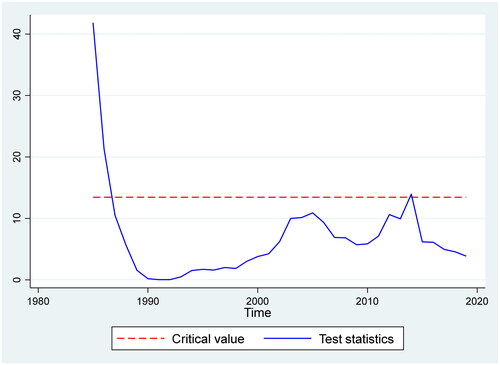
Figure 7. Test statistic of information advantage test regarding public investment: Private.
Robustness
This section examines the robustness of the previous section’s results by setting the window size at 30. shows the results of the rationality and information advantage tests under the Fluctuation Rationality test. It broadly shows results consistent with the primary analysis in the previous section. There are two differences. First, the residential investment forecast lost its information advantage to the total, private, and building construction forecasts. Second, the public investment forecast has no information advantage, while the public works-related budget has an information advantage for the private construction forecast.
Table 5. Rationality and information advantage tests: Robustness.
The sequences of test statistics also provide broadly consistent results with the main analysis. The differences are noted; however the figures are not reported here to save space (see ). The remarkable difference is that there is no information advantage of the GDP and private investment forecasts in the sample period’s early years. There is also no information advantage of the residential investment forecast for the civil engineering construction forecast until the late 2000s. While the residential investment forecast gained an information advantage for the public construction forecast in 2008 and 2009, the residential investment forecast lost an information advantage to the public construction forecast in the early years of the sample period. The public works related budget has an information advantage for the private investment forecast in 1993.
Discussion
This section discusses the results’ implications. First, the construction forecasts are broadly rational and have an information advantage between the 1960s and 1990s, indicating that those construction forecasts provided useful information and guidance to the stakeholders in the Construction State. This finding also suggests that providing rational forecasts likely supported functioning and stakeholder coordination by contributing to effective and careful resource allocation planning in the construction and related industries. This is because the construction industry in Japan proved to be very profitable (EU-Japan Centre Citation2015) and highly innovative in investing in electronic technologies (Abdel-Wahab and Vogl Citation2011) compared to other OECD countries. The significant role of construction investment, with embedded social welfare spending, might have increased the reliability of the construction forecasts. Therefore, from a policy perspective, this suggests that preparing and publishing construction forecasts by governmental agencies would contribute to sustainable construction industry growth in other countries.
Second, however, in the most recent two decades since 2000, there is room for improvement in the construction forecasts by incorporating information included in the GDP growth and private investment forecasts; yet, public sector information included in the public investment forecast and public works-related budget is of limited advantage in improving the construction forecasts. These results suggest that in the construction forecasting process, public sector information has been fully used, but private sector information has not been used sufficiently. Alternatively, the forecasting process has missed or mis-specified the interaction of construction activity between private and public sectors. These results also suggest that because the private sector economy has developed and become more complex, it has been unable to successfully use this information for construction forecasts in the most recent decades. More reliable construction forecasts could be developed by examining the relationship between the private and public sectors in recent years.
Third, information in the government investment forecasts broadly improved construction forecasts during the external shocks of the 2008–2009 global financial crisis and the domestic shock of Great East Japan Earthquake in 2011 and 2012. This result suggests that incorporating such new information can help us better understand the impacts of those external shocks on the construction industry and reduce the systematic bias in construction forecasts. When a large external shock occurs, it would be helpful for MLIT to publish revised forecasts that take into account new information. This would provide construction industry stakeholders with new information for better decision-making. The implication that practitioners in the construction industry can use the government investment forecasts to gain insights into the impacts of shocks on the construction industry even though MLIT does not release revised forecasts emerges from this result.
Lastly, the similarities and differences between the results of the present study and those of previous studies are summarized to highlight the contributions of the current study. The discovery that construction forecasts could be enhanced during external shocks aligns with the existing literature on construction and macroeconomic forecasts. Tests evaluating relative forecasting performance have consistently shown that unforeseen shocks have a significant impact on these forecasts. However, rationality of the construction forecasts over the four decades is in a sharp contrast to previous studies. This finding provides evidence that the government forecasts played a role in promoting innovation and growth in the construction and related industries by assisting their effective and careful resource allocation planning. Beaudry and Willems (Citation2022) showed that optimistically biased forecasts could have negative macroeconomic consequences. Further, the present study revealed that examining the interrelationship between the private and public sectors is required to improve recent construction forecasts.
Conclusion
This study investigates rationality in the Japanese government’s construction forecasts and an information advantage of the construction forecasts over the government’s macroeconomic forecasts between 1960 and 2019. This study employs the recently developed Fluctuation Rationality test to accommodate forecasting environment instabilities and draw policy implications. The results indicate that if we depend solely on the standard rationality test, the Japanese government’s construction forecasts will be mistakenly considered rational. The Japanese government construction forecasts broadly provided reliable information in the postwar era of the Construction State and then contributed to the growth of the Japanese economy. There exist, however, some construction forecasts that were irrational after 2000, which was revealed by applying the Fluctuation Rationality test, indicating insights into how to improve those forecasts. These results provide the following implications for improvements. The construction forecasts of recent decades could be improved by incorporating the government’s GDP growth and private investment forecasts. More reliable construction forecasts could be developed by examining the relationship between the private and public sectors in recent years.
The results also have implications for the construction industries of other countries. Governments or authoritative bodies in various countries may want to consider publishing construction forecasts. These construction forecasts would be beneficial not only for advanced countries but also for developing countries, as they can facilitate the growth and development of their sustainable construction industries. In preparing and releasing such forecasts, the relationship between the private and public sectors should be carefully examined and considered, including the possible release of updated forecasts when a large external shock hits the economy.
Finally, this study has limitations along with a future research agenda. First, the observations here are limited owing to their annual frequency. Second, political influences were not investigated, as it is beyond this study’s scope. A direct and detailed investigation of this relationship is required, which presents an interesting future agenda. Another such agenda lies in investigating the relationship between private and public sector construction to obtain insights for improving construction forecasts. Additionally, it would be worthwhile to investigate whether the construction forecasts can be influenced by factors or variables not addressed in the study and whether incorporating these elements can enhance the accuracy of the forecasts.
Acknowledgments
I am grateful to an associate editor and seven anonymous referees for their helpful comments. I gratefully acknowledge financial support from the Japan Society for the Promotion of Science (JSPS Grant Number JP22K01510).
Disclosure statement
There are no conflicts of interest to declare.
Data availability statement
The data that support the findings of this study are available from the author upon reasonable request.
Notes
1 See Ito and Hoshi (Citation2020) for details on Japanese economy.
2 “Construction State” indicates that in Japan, public works replaced policy responses that other developed countries accomplished through social welfare spending (Estévez-Abe Citation2008).
3 See MLIT (1998) for detailed definitions for data used in this study.
4 See in Appendix for each sub-component forecasts.
5 See Chapter 2 of Ord et al. (Citation2017) for use and interpretation of the measures of forecast accuracy described in this section.
6 See Rossi and Sekhposyan (Citation2016) for details on the implementation in the general case.
7 There are large size distortions in small samples with a rolling window size of less than 25.
8 Although not reported, analysis of the nominal GDP growth forecast provides qualitatively similar results.
9 See for each sub-component forecast.
10 See for each sub-component forecast.
References
- Abdel-Wahab, M., and Vogl, B., 2011. Trends of productivity growth in the construction industry across Europe, US and Japan. Construction management and economics, 29 (6), 635–644.
- Arai, N., 2020. Investigating the inefficiency of the CBO’s budgetary projections. International journal of forecasting, 36 (4), 1290–1300.
- Beaudry, P., and Willems, T., 2022. On the macroeconomic consequences of over-optimism. American economic journal: macroeconomics, 14 (1), 38–59.
- Clark, T.E., and McCracken, M.W., 2001. Tests of equal forecast accuracy and encompassing for nested models. Journal of econometrics, 105 (1), 85–110.
- Coibion, O., and Gorodnichenko, Y., 2012. What can survey forecasts tell us about information rigidities? Journal of political economy, 120 (1), 116–159.
- Diebold, F.X., and Mariano, R.S., 1995. Comparing predictive accuracy. Journal of business and economic statistics, 13 (3), 253–263.
- Ericsson, N.R., 2017. How biased are US government forecasts of the federal debt? International journal of forecasting, 33 (2), 543–559.
- Estévez-Abe, M., 2008. Welfare and capitalism in postwar Japan. Cambridge: Cambridge University Press.
- EU-Japan Centre. 2015. Sustainable building and construction sector in Japan: analysis of opportunities for European firms. Tokyo: Centre for Industrial Cooperation.
- Fan, R.Y.C., Ng, S.T., and Wong, J.M.W., 2010. Reliability of the Box–Jenkins model for forecasting construction demand covering times of economic austerity. Construction management and economics, 28 (3), 241–254.
- Fan, R.Y.C., Ng, S.T., and Wong, J.M.W., 2011. Predicting construction market growth for urban metropolis: an econometric analysis. Habitat international, 35 (2), 167–174.
- Frankel, J., 2011. Over-optimism in forecasts by official budget agencies and its implications. Oxford review of economic policy, 27 (4), 536–562.
- Frankel, J., and Schreger, J., 2013. Over-optimistic official forecasts and fiscal rules in the Eurozone. Review of world economics, 149 (2), 247–272.
- Goh, B.H., 2005. The dynamic effects of the Asian financial crisis on construction demand and tender price levels in Singapore. Building and environment, 40 (2), 267–276.
- Hua, G.B., 1996. Residential construction demand forecasting using economic indicators: a comparative study of artificial neural networks and multiple regression. Construction management and economics, 14 (1), 25–34.
- Hua, G.B., and Pin, T.H., 2000. Forecasting construction industry demand, price and productivity in Singapore: the Box-Jenkins approach. Construction management and economics, 18 (5), 607–618.
- Ito, T., and Hoshi, T., 2020. The Japanese economy. Cambridge, MA: MIT Press.
- Jiang, H., and Liu, C., 2011. Forecasting construction demand: a vector error correction model with dummy variables. Construction management and economics, 29 (9), 969–979.
- Jiang, H., Xu, Y., and Liu, C., 2014. Market effects on forecasting construction prices using vector error correction models. International journal of construction management, 14 (2), 101–112.
- Kim, K.-B., Cho, J.-H., and Kim, S.-B., 2021. Model-based dynamic forecasting for residential construction market demand: a systemic approach. Applied Sciences, 11 (8), 3681.
- Kissi, E., et al., 2018. Forecasting construction tender price index in Ghana using autoregressive integrated moving average with exogenous variables model. Construction economics and building, 18 (1), 70–82.
- Lei, M., et al., 2023. Application of GSM-SVM for forecasting construction output: a case study of Hubei Province. Buildings, 13 (1), 48.
- Lunsford, K.G., 2015. Forecasting residential investment in the United States. International journal of forecasting, 31 (2), 276–285.
- Martinez, A.B., 2015. How good are US government forecasts of the federal debt? International journal of forecasting, 31 (2), 312–324.
- Mincer, J. A., and Zarnowitz, V., 1969. The evaluation of economic forecasts. In Economic forecasts and expectations: analysis of forecasting behavior and performance. Cambridge, MA: National Bureau of Economic Research, 3–46.
- Ministry of Land, Infrastructure, Transport and Tourism. 1998. Construction statistics guidebook. Ministry of Land, Infrastructure, Transport and Tourism. Available from https://www.mlit.go.jp/toukeijouhou/chojou/csg/contents.htm
- Ministry of Land, Infrastructure, Transport and Tourism. 2021. Construction investment outlook for fiscal year 2021. Tokyo, Japan: Ministry of Land, Infrastructure, Transport and Tourism (in Japanese).
- Miura, F., Takasaki, K., & Ogawa, K. 2021. Impact of the sharp decline in construction investment on the management of the construction industry. In. Construction Economic Report. No. 73. Research Institute of Construction and Economy (in Japanese), 162–192.
- Neale, R., and Ameen, J., 2001. Discussion of “earthmoving productivity estimation using linear regression techniques” by Richard Neale and Jamal Ameen. Journal of construction engineering and management, 127 (1), 88–89.
- Newey, W.K., and West, K.D., 1987. A simple, positive semi-definite, heteroskedasticity and autocorrelation consistent covariance matrix. Econometrica, 55 (3), 703–708.
- Ofori, G., 1990. The construction industry: aspects of its economics and management. Singapore: NUS Press.
- Ord, K., Fildes, R. A., and Kourentzes, N., 2017. Principles of business forecasting. 2nd ed. New York: Wessex Press, A1.
- Oshodi, O., et al., 2020. Construction output modelling: a systematic review. Engineering, construction and architectural management, 27 (10), 2959–2991.
- Oteng-Abayie, E.F., and Dramani, J.B., 2019. Time-frequency domain causality of prime building cost and macroeconomic indicators in Ghana: implications for project selection. Construction management and economics, 37 (5), 243–256.
- Rossi, B., and Sekhposyan, T., 2016. Forecast rationality tests in the presence of instabilities, with applications to Federal Reserve and survey forecasts. Journal of applied econometrics, 31 (3), 507–532.
- Stock, J.H., and Watson, M.W., 1996. Evidence on structural instability in macroeconomic time series relations. Journal of business and economic statistics, 14 (1), 11–30.
- Tan, Y., et al., 2015. Grey forecasting of construction demand in Hong Kong over the next ten years. International journal of construction management, 15 (3), 219–228.
- Tsuchiya, Y., 2016. Assessing macroeconomic forecasts for Japan under an asymmetric loss function. International journal of forecasting, 32 (2), 233–242.
- West, K.D., and McCracken, M.W., 1998. Regression-based tests of predictive ability. International economic review, 39 (4), 817–840.
- Wong, J.M.W., and Ng, S.T., 2010. Forecasting construction tender price index in Hong Kong using vector error correction model. Construction management and economics, 28 (12), 1255–1268.
- Wong, J.M.W., Chan, A.P.C., and Chiang, Y.H., 2007. Forecasting construction manpower demand: a vector error correction model. Building and environment, 42 (8), 3030–3041.
- Woodall, B., 1996. Japan under construction: corruption, politics, and public works. Berkeley, CA: University of California Press.
Appendix
Figure A1. Forecast and actual values.
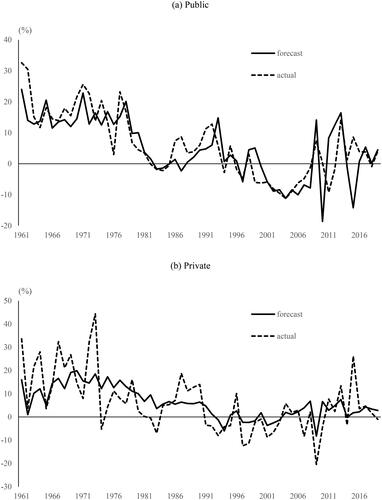
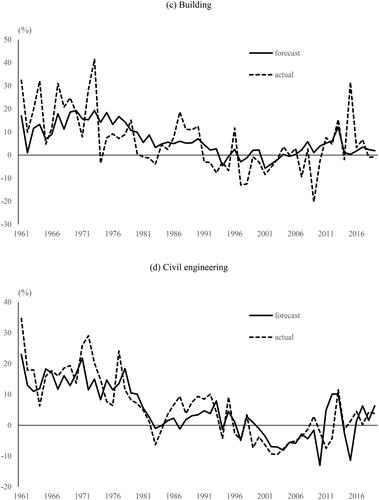
Figure A2. Test statistic of information advantage test regarding real GDP growth.
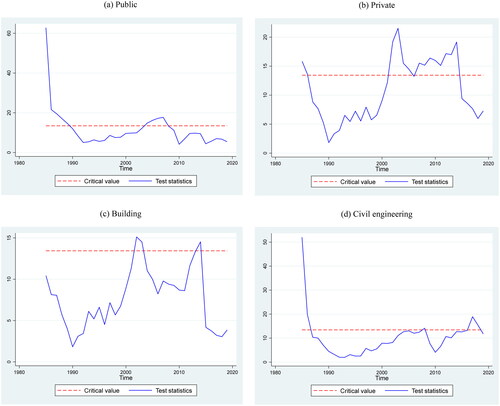
Figure A3. Test statistic of information advantage test regarding private investment.
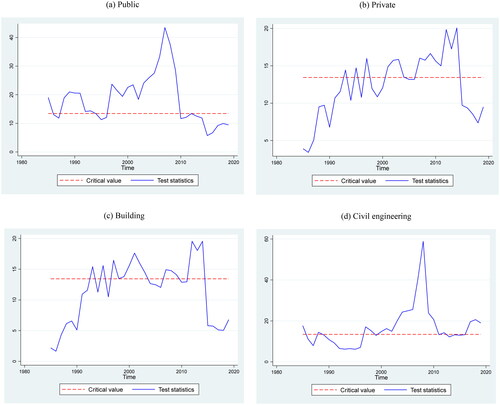
Figure A4. Test statistic of information advantage test regarding residential investment.
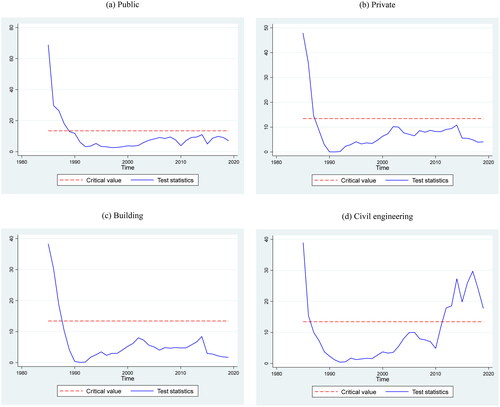
Figure A5. Test statistic of information advantage test regarding public investment: Building.
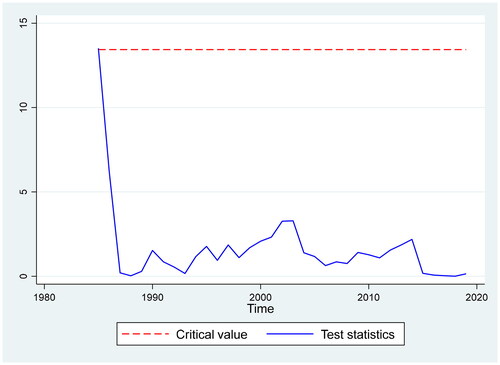
Figure A6. Test statistic of information advantage test regarding real GDP growth: Robustness.
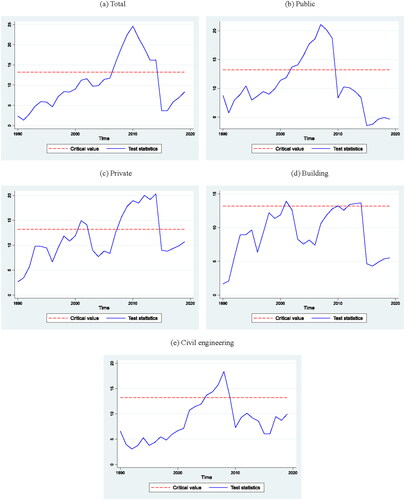
Figure A7. Test statistic of information advantage test regarding private investment: Robustness.
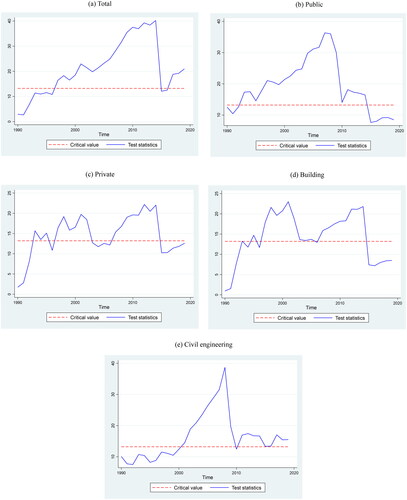
Figure A8. Test statistic of information advantage test regarding residential investment: Robustness.
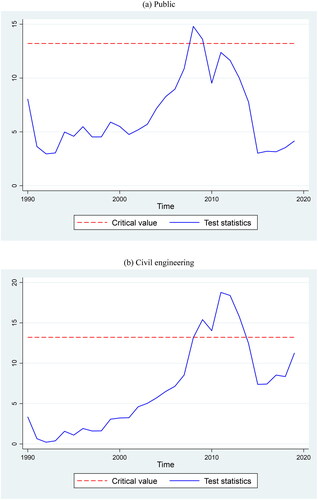
Figure A9. Test statistic of information advantage test of private investment regarding public works related budget.