
 ?Mathematical formulae have been encoded as MathML and are displayed in this HTML version using MathJax in order to improve their display. Uncheck the box to turn MathJax off. This feature requires Javascript. Click on a formula to zoom.
ABSTRACT
People increasingly use microblogging platforms such as Twitter during natural disasters and emergencies. Research studies have revealed the usefulness of the data available on Twitter for several disaster response tasks. However, making sense of social media data is a challenging task due to several reasons such as limitations of available tools to analyse high-volume and high-velocity data streams, dealing with information overload, among others. To eliminate such limitations, in this work, we first show that textual and imagery content on social media provide complementary information useful to improve situational awareness. We then explore ways in which various Artificial Intelligence techniques from Natural Language Processing and Computer Vision fields can exploit such complementary information generated during disaster events. Finally, we propose a methodological approach that combines several computational techniques effectively in a unified framework to help humanitarian organisations in their relief efforts. We conduct extensive experiments using textual and imagery content from millions of tweets posted during the three major disaster events in the 2017 Atlantic Hurricane season. Our study reveals that the distributions of various types of useful information can inform crisis managers and responders and facilitate the development of future automated systems for disaster management.
1. Introduction
Three devastating natural disasters in 2017, namely Hurricane Harvey, Hurricane Irma, and Hurricane Maria, caused catastrophic damage worth billions of dollars and numerous fatalities, and left thousands of affected people. During such life-threatening emergencies, affected and vulnerable people, humanitarian organisations, and other concerned authorities search for information useful to prevent a crisis if possible or help victims. During disasters and emergencies, humanitarian organisations and other government agencies, public health authorities, and military are tasked with responsibilities to save lives and reach out to people who need help (Gralla, Goentzel, and VandeWalle Citation2013). These formal response organisations rely on timely and credible information to make rapid decisions to launch relief operations. The information needs of these stakeholders vary depending on their role, responsibilities, and the situation they are dealing with (Vieweg, Castillo, and Imran Citation2014). However, during time-critical situations, the importance of timely and factual information increases, especially when no other traditional information sources such as TV or Radio are available (Vieweg Citation2012; Castillo Citation2016).
The growing use of Information and Communication Technologies (ICT), mobile technologies, and social media platforms such as Twitter and Facebook has provided easy-to-use and effective opportunities to the general public to disseminate and ingest information. Millions of people increasingly use social media during natural and human-induced disasters (Hughes and Palen Citation2009; Purohit et al. Citation2014; Castillo Citation2016). Research studies have demonstrated the usefulness of social media information for a variety of humanitarian tasks such as ‘situational awareness’ (Starbird et al. Citation2010; Vieweg Citation2012). Although, information available on social media could be useful for response agencies, making sense of it under time-critical situations is a challenging task (Hiltz and Plotnick Citation2013). For instance, due to high-volume and high-velocity of social media data streams, manual analysis of thousands of social media messages is impossible (Hiltz, Kushma, and Plotnick Citation2014; Ludwig et al. Citation2015).
Making sense of social media data to help responders involves solving multi-faceted challenges including parsing unstructured and brief content, filtering out irrelevant and noisy content, handling information overload, among others. Over the last few years, a number of Artificial Intelligence (AI) techniques and computational methods have been proposed which try to learn useful information from social media data for disaster response and management under time-critical situations (Stieglitz et al. Citation2018a; Stieglitz, Mirbabaie, and Milde Citation2018). These techniques aim to solve various challenges ranging from information filtering, overload, and categorisation to summarisation (Imran et al. Citation2015; Castillo Citation2016; Rudra et al. Citation2016). Despite extensive work in the past, limited focus has been given to understand the usefulness of multimodal content (e.g. images, text, and videos) on social networks.
In this study, we describe a methodological approach based on the state-of-the-art AI techniques ranging from unsupervised to supervised learning for an in-depth analysis of multimodal social media data collected during disasters. Furthermore, we present three case studies where we apply the proposed methodology on the Twitter data collected during three disasters, namely Hurricanes Harvey, Irma, and Maria, for a comprehensive understanding of these real-world devastating crisis events. Specifically, we perform sentiment analysis to comprehend how people's thoughts and feelings change over time as disaster events progress. To help concerned authorities to quickly sift through big crisis data, we employ clustering techniques to group semantically similar messages and find high-level categories. We use topic modelling techniques to understand the different topics discussed during each day. To help humanitarian organisations fulfil their specific information needs, we use supervised classification techniques to classify both textual and imagery content into humanitarian categories. Furthermore, we employ named-entity recognition (NER) techniques to identify critical entities such as persons, organisations, and locations to understand the data and context around it better. We also make our data available at the CrisisNLPFootnote1 repository for researchers and practitioners to advance research in this field. We publish tweet ids and a tool to download full tweet content from Twitter. We believe our methodological, empirical, and dataset contributions will also shed light in human–computer interaction research for understanding user communication types and behaviours in online social networks during disasters (Wobbrock and Kientz Citation2016).
The rest of the paper is organised as follows. In Section 2, we present the main objectives of our study followed by a review of the literature in Section 3. Then, we describe our data collection details in Section 4. Later in Section 5, we present our experiments and analysis results. We discuss our findings in Section 6, and finally, conclude the paper in Section 7.
2. Objectives of the analysis
Depending on their role and capacity, the information needs of formal response organisations and other humanitarian non-governmental organisations (NGOs) vary. Moreover, local government departments such as police, fire, and municipality, among others, seek information that is aligned with their response priorities as well as the given crisis situation, its context, severity, and evolution over time. For instance, many humanitarian organisations seek high-level information about a crisis situation such as the scale of the disaster event, affected population size in the disaster zone, urgent needs of the affected people such as food, water, and shelter, and overall economic impact of the disaster. In contrast, other organisations such as police forces seek information concerning individual emergency situations such as reports of trapped people that need to be rescued or injured people that need urgent medical assistance, etc. Such cases require the immediate attention of concerned authorities. These varying information needs of different humanitarian stakeholders can be classified into two main categories: (i) information needs that help authorities to understand the ‘big picture’ of a situation, i.e. ‘situational awareness’ (Vieweg et al. Citation2010), and (ii) information needs that help authorities to launch a rapid response to an emergency situation, i.e. ‘actionable information’ (Zade et al. Citation2018). This work focuses mainly on improving situational awareness of humanitarian organisations about a disaster event. The three main research questions that we address in this study are the following:
RQ 1: How do different content types (i.e. textual and imagery content) convey complementary useful information to improve situational awareness?
RQ 2: In which ways can computational techniques, such as topic modelling, clustering, sentiment analysis, named-entity recognition, and classification, be used to process textual as well as imagery data in social media specifically to improve situational awareness?
RQ 3: How can we devise a methodology that capitalises on several computational techniques effectively in a unified framework to help humanitarian organisations in their relief efforts (mainly related to situational awareness)?
In order to answer these questions, we analyse data collected from Twitter during three natural disasters and perform an extensive analysis of both textual and imagery content.
2.1. Textual content analysis
We seek to gain an understanding of the textual information posted on social media during disasters from different angles. With a target to fulfil situational awareness needs of different humanitarian organisations, in this work, we employ several state-of-the-art AI techniques to analyse and understand useful information for humanitarian decision-makers and responders while filtering out irrelevant information to reduce information overload burden on responders.
2.1.1. Targeting specific information needs
Many humanitarian organisations have predetermined information needs. For example, the United Nations (UN) humanitarian organisations use a cluster coordination approach in which different organisations focus on different humanitarian tasksFootnote2 (Vieweg, Castillo, and Imran Citation2014). For instance, the World Health Organisation (WHO) focuses on health, the United Nations Children's Fund (UNICEF) on children and education, and the World Food Programme (WFP) on food security. In this work, we take a longitudinal approach to cover the different information needs of UN organisations. First, we define a taxonomy of information needs learned from previous studies (Imran et al. Citation2015), and then use supervised machine learning techniques to automatically categorise the collected data into the predefined categories. The categories included in our taxonomy representing several humanitarian information needs are as follows:
Injured or dead people: corresponds to the reports of injured people and fatalities due to the disaster.
Infrastructure and utility damage: corresponds to the reports of damage to infrastructures such as buildings, bridges, roads, houses, and other utility services such as power lines and water pipes.
Caution and advice: messages that contain warnings, cautions, and advice about the disaster that could be useful for other vulnerable people or humanitarian organisations.
Donation and volunteering: corresponds to the messages containing requests for donations of goods, money, food, water, shelter, etc. and/or messages containing donation offers.
Affected individual: corresponds to the reports of affected people due to the disaster.
Missing and found people: corresponds to the reports of missing or found people due to the disaster.
Sympathy and support: corresponds to the messages that show any type of sympathy or support towards the victims of the disaster.
Personal: corresponds to the personal updates that are mostly useful for an individual's family and friends, but probably not for humanitarian organisations.
Other useful information: corresponds to the messages, which do not belong to any of the above categories but are still useful and potentially important for humanitarian organisations.
Irrelevant or not related: corresponds to the messages which are not in English or not relevant to the disaster or irrelevant for humanitarian response.
Topics of discussion on social media during different disasters vary and, even within an event, topics change rapidly (Imran, Mitra, and Srivastava Citation2016). One factor that might cause a change in the topic of discussion is varying aid needs of affected people. To understand the temporal variance between different informational categories in the taxonomy, we aim to investigate the distribution of the classified messages over time.
2.1.2. Identifying sentiment
Determining the sentiment of people during disasters and emergencies can help understand people's concerns, panics, and emotional feelings regarding various issues related to the event. It also helps responders establish stronger situational awareness of the disaster zone (Nagy and Stamberger Citation2012; Caragea et al. Citation2014). To establish such an understanding, we aim to perform the sentiment analysis on the collected data. With this analysis, we expect to find issues that cause anger and negative sentiment among affected people and outsiders. Humanitarian organisations can see this as a tool to keep an eye on public sentiment to find critical issues affecting large populations and plan their response in a timely manner.
2.1.3. Identifying critical entities (persons, locations, organisations)
Rapidly assessing a situation is critical for effective disaster response. Three typical entities have been recognised as fundamental elements in natural language processing (NLP): ‘persons’, ‘ organisations’ and ‘locations’ (Finkel, Trond, and Manning Citation2005). These named entities in text messages provide ways to understand the data and context around it better. Among other ways, finding entities could help crisis managers rapidly sift through thousands of messages while discarding noise. For instance, a location unrelated to the event or the name of a past event can be used to filter out all messages that mention them. The name of a well-known organisation (e.g. a non-governmental organisation (NGO), a government agency or an established media corporation) mentioned in a message makes the message more trustworthy than if delivered by an unknown source. The location name of a specific street, bridge, park or river can help managers to send a rescue team to the right place. The name of a person can be used to identify a local contact or understand that an important person is missing. To extract such entities, we use the Stanford Named-Entity Recognizer (Finkel, Trond, and Manning Citation2005) in this work.
2.1.4. Tracking incidents
Large-scale disasters that are either too severe (e.g. intense earthquakes) or long-running (e.g. wars, conflicts) usually cause many small-scale incidents, which are troublesome to small communities or a limited number of people. Examples of such small-scale events include ‘airport shutdown due to an earthquake’, ‘school closures due to hurricane warnings’, etc. Many of such events are hard to anticipate by humanitarian organisations beforehand. Therefore, responders are usually not well-prepared to handle them. Timely identification of small-scale events after a big disaster can facilitate humanitarian responders launch timely response to help those who are in need or address the issue. For this purpose, we introduce the ‘Other useful information’ category in the taxonomy described above. This category contains messages that do not belong to any of the informative categories in the taxonomy but convey important information potentially useful for humanitarian responders. We expect small-scale issues and incidents to appear in this category. Since the types of information present in the messages that belong to the ‘Other useful information’ category are not known, we cannot use supervised machine learning techniques to understand what those incidents or discussion topics are during a disaster. Instead, similar to Imran and Castillo (Citation2015), we use a state-of-the-art topic modelling technique called Latent Dirichlet Allocation (LDA) (Blei, Ng, and Jordan Citation2003) to identify the latent events or topics in the ‘Other useful information’ category.
2.2. Multimedia content analysis
Capturing the moment via images or videos, and sharing them online has already become a usual habit for many social media users. Thanks to this new phenomenon, social media users can easily share much more information in a much more effective way than just typing up text messages to share their feelings and opinions. Therefore, analysis of this multimedia content (i.e. images and videos) bears significant potential, especially in the context of crisis response and management. For instance, an image can provide more information about the severity and extent of damage caused by a disaster, more detailed understanding of shelter needs and quality, more accurate assessment of ongoing rescue operations, faster identification of lost or injured people, etc. The importance of multimedia content has also been highlighted by Reuter et al. (Citation2016) in a survey study with 761 emergency service staff. According to their report, two-thirds of the respondents think both images and videos are good sources of information during emergencies. However, implications of the multimedia content on social media have not yet been studied in depth, unlike their text-only counterparts. There are only a few recent studies in this emerging research area that explore how social media image and video content can provide critical information, especially during crisis events such as natural disasters, for emergency management and response organisations. Due to the fairly nascent nature of the domain, we will focus only on the analysis of imagery content in this study.
2.2.1. Identifying relevant and unique imagery content
Although images on social media can provide valuable information during emergencies, not all of the collected images are related to the crisis event itself or present relevant information for emergency management and response organisations (Chen et al. Citation2013; Peters and de Albuquerque Citation2015; Nguyen et al. Citation2017b). Social media users can post all sorts of images using event-specific hashtags (such as #HurricaneHarvey, #HurricaneIrma, or #HurricaneMaria) to advertise their content even though this can be considered as unethical behaviour during natural disasters and emergencies. Besides relevancy, redundancy in social media images is another important issue that needs to be addressed in order to extract succinct information useful for humanitarian organisations. People can just re-tweet an existing image (i.e. exact duplicates) or share slightly-altered (e.g. rescaled, cropped, text embedded, etc.) versions of an existing image (i.e. near duplicates). These images usually do not provide any additional contextual information, and hence, should be eliminated from the data processing pipeline for optimal use of time as well as human and machine computation resources during time-critical crisis situations. In light of the aforementioned studies, we investigate the feasibility of cleaning social media imagery data from irrelevant and redundant content and analyse whether social media imagery can be a source of information for crisis response and management.
2.2.2. Extracting useful information
Detection of relevant and unique imagery content is certainly necessary but not sufficient in the context of crisis response and management. Humanitarian organisations do need more concise situational awareness information to assess the overall crisis situation. In order to utilise the full potential of imagery content available on social media, accurate machine learning models should be developed for each particular humanitarian use case. For example, understanding the extent of the infrastructure and utility damage caused by a disaster is one of the core situational awareness tasks listed earlier. Several studies in the literature have already shown that social media images can be analysed for automatic damage assessment in addition to the textual content analysis (Liang, Caverlee, and Mander Citation2013a; Daly and Thom Citation2016; Lagerstrom et al. Citation2016; Nguyen et al. Citation2017c). Inspired by these studies, we perform an infrastructural damage assessment task on cleaned social media imagery content.
3. Literature review
In this section, we first discuss related work that focuses on crisis informatics. Then, we highlight some of the relevant state-of-the-art work on supervised and unsupervised techniques for analysing text and images.
3.1. Social media-driven crisis informatics
Crisis informatics, or crisis computing, is an emerging interdisciplinary field, which combines computing and the knowledge of social science to extract disaster-related information (Soden and Palen Citation2018). In this field, a major focus is to use and exploit social media data due to its timely availability and abundance. Social media analytics is the term that is commonly used for the analysis of social media data by combining and adopting different computational methods (Stieglitz et al. Citation2018c, Citation2018b). Several studies highlight the benefits of social media analytics, which builds upon social media platforms such as Twitter and Facebook, for curating, analysing and summarising crisis-related information to help decision-makers and relief efforts (Vieweg et al. Citation2010; Terpstra et al. Citation2012; Imran et al. Citation2014, Citation2015; Nazer et al. Citation2017; Tsou et al. Citation2017; Reuter and Kaufhold Citation2018). The related literature in this domain can be divided into two categories, namely (i) ‘situational awareness’, which corresponds to research work that focuses on understanding the big picture during a disaster event and (ii) ‘actionable’, which corresponds to works that focus on identifying and extracting actionable information that enables first responders to help victims.
3.1.1. Situational awareness information processing
The concept of situational awareness refers to the understanding of the ‘big picture’ in an emergency situation (Vieweg Citation2012). The more situational awareness formal humanitarian organisations and people have, the better prepared they are to make informed decisions. Several studies contribute towards enhancing situational awareness of an event using social media, and most of them focus on Twitter mainly because of its timeliness and availability of information from a large user base. For instance, Kryvasheyeu et al. (Citation2016) present that physical disaster effects as well as real and perceived threats are directly observable through the intensity and composition of Twitter messages. Moreover, Hagen et al. (Citation2017) analyse Twitter network structure to understand the flow of information and how different actors and communities contribute towards influential topics. Similarly, Kim and Hastak (Citation2018) explore how emergency agencies and organisations can better plan operation strategies for a disaster by utilising individuals' information on a social network.
Inspired by such studies, Landwehr et al. (Citation2016) present a Twitter tracking and analysis system, called TWRsms, and elaborate on the associated challenges to deploy such a system. Their system targets a particular place, Padang Indonesia. They report that using this system they can identify where the population is, who are the local opinion leaders, and also the content of the tweets. Their findings suggest that identifying local opinion leaders can be helpful for early warning. Later on, Avvenuti et al. (Citation2017) propose ‘Earthquake Alerts and Report System,’ which exploits tweets to understand how such a system can be useful during crisis-related events. The system collects tweets during an ongoing crisis event, filters irrelevant content, detects an event, assesses damage, and for the sake of comprehensibility, it provides a visualisation. The authors conclude that such a system is highly important for crisis-related events.
For a more comprehensive survey of the literature on the analysis of social media data using different AI techniques and computational methods in the crisis informatics domain, we refer the reader to Imran et al. (Citation2015) and Castillo (Citation2016).
3.1.2. Actionable information processing
In contrast to the concept of situational awareness, actionable information research works focus on how to obtain the right information for the right person (i.e. disaster responder) at the right time during a disaster event. For instance, Zade et al. (Citation2018) conducted a large-scale survey and interviewed several officials from humanitarian organisations. The authors identified that the notion of actionability differ from responder to responder, and there are several factors that inform whether a piece of information is actionable or not. These factors include timeliness, location, information source credibility, responder's role, and context.
Compared to situational awareness research, very limited focus has been given to learn the actionability of social media content during disasters. A recent study by Avvenuti et al. (Citation2018) investigates this crucial aspect and presents a system called CrisMap, which extracts potential crisis-related actionable information from tweets by adopting a classification technique based on word embeddings and by exploiting a combination of readily-available semantic annotators to geo-parse tweets. The system then visualises the extracted information in customisable web-based dashboards and maps. This is very initial step towards modelling actionability of social media content, which needs more focus from the research community.
3.2. Clustering
Clustering is an unsupervised machine learning approach that can be used for categorising text documents into groups. There are different clustering algorithms including partition- (e.g. K-means), hierarchical- (e.g. BRICH), density- (e.g. DBSCAN), grid- (e.g. Wave-Cluster), and model-based (e.g. EM) approaches. A number of surveys have been already reported in the literature on different clustering approaches (Fahad et al. Citation2014; Xu and Tian Citation2015). In this study, we use K-means algorithm (Hartigan and Wong Citation1979), which is the simplest and yet computationally efficient algorithm among others, thanks to its lower algorithmic complexity.
3.3. Tweet classification
For general tweet classification task, current literature shows the use of classic algorithms such as Maximum Entropy, Logistic Regression, Random Forest, Naïve Bayes classifier, and Conditional Random Fields (CRFs) and deep learning-based techniques such as Convolutional Neural Networks (CNN) (Nguyen et al. Citation2017a), and Long-Short-Term-Memory Networks (LSTM) (Rosenthal, Farra, and Nakov Citation2017). For the tweet classification task in this study, we use a classifier developed based on the Random Forest learning scheme.
3.4. Sentiment analysis
The state-of-the-art research on sentiment analysis focus mostly on classifying sentiment in either one of two labels, i.e. positive or negative, or five labels, i.e. very positive to very negative, from textual information (Pang and Lee Citation2008) such as movie-reviews (Pang, Lee, and Vaithyanathan Citation2002), tweets (Paltoglou and Thelwall Citation2010), and newspaper articles and comments (Celli et al. Citation2016). For sentiment analysis, one of the common approaches is to use a sentiment lexicon (e.g. SentiWordNet, Sentiment Treebank, and Psycholinguistic features) as features for designing the sentiment classifier (Socher et al. Citation2013; Cambria et al. Citation2016). In Nagy and Stamberger (Citation2012), the authors report the use of emoticons along with SentiWordNet helps in improving the classification of sentiment from microblogs dataset collected during disasters and crises. Socher et al. (Citation2013) present the use ‘Sentiment Treebank’ can help in detecting sentiment labels with an accuracy of 80.7 –85.4%. Other common approaches include the utilisation of word embeddings along with deep neural networks. More extensive comparative studies can be found in SemEval tweet classification task (Rosenthal, Farra, and Nakov Citation2017). Over time several open-source tools have also been developed for sentiment analysis. The most widely-used tool is the Stanford CoreNLP Natural Language Processing Toolkit (Manning et al. Citation2014b), which supports all preprocessing to sentiment classification methods. In our study, we use Stanford sentiment analysis toolkit, which allows us to classify tweets with five labels, i.e. very positive to very negative.
3.5. Named-entity recognition
The task of Named-Entity Recognition (NER) has a long history in NLP for extracting entities from newspaper articles (Alam, Magnini, and Zanoli Citation2015). These are mainly based on generative machine learning models. The extraction of named entities from tweets is more challenging due to the noisy structure of social media data. Recent approaches for entity recognition from tweets include LSTM, Bidirectional-LSTM, and CRFs (Baldwin et al. Citation2015; Limsopatham and Collier Citation2016; He and Sun Citation2017). For the NER task, we use the Stanford NER toolkit, which is based on CRFs (Finkel, Trond, and Manning Citation2005; Manning et al. Citation2014a). The F1-score of the system is 88.76% on CoNLL 2003 dataset.
3.6. Topic modelling
Because the supervised approaches for text classification require human annotated labels, the use of the semi-supervised and unsupervised approaches has started increasing in the last decade or so. In the text analysis domain, one of the well-known techniques is topic modelling, which uses Latent Dirichlet Allocation (LDA) based on a generative probabilistic model (Blei, Ng, and Jordan Citation2003). LDA provides an explicit representation of textual content. For tweet analysis, there are many studies which analyse tweets to extract information using different variants of LDA topic modelling technique (Hong and Davison Citation2010; Mendoza, Poblete, and Castillo Citation2010; Chae et al. Citation2014; Yang et al. Citation2014; Gründer-Fahrer et al. Citation2018). Therefore, our study of topic modelling is also based on LDA. The work by Gründer-Fahrer et al. (Citation2018) stands out among others since it uses LDA followed by a visualisation approach, as discussed in (Sievert and Shirley Citation2014), for analysing the results of the topic models, relevance ranking, and identifying topic labels. Such work is quite inspiring for future research.
3.7. Image processing
In addition to the textual content analysis, recent studies have also been focusing on the analysis of imagery content shared on social media (Alam, Imran, and Ofli Citation2017; Nguyen et al. Citation2017b, Citation2017c). Combining textual and visual content can provide highly relevant information. For instance, Bica, Palen, and Bopp (Citation2017) study the social media images posted during two major earthquakes in Nepal during April-May 2015. Their study focuses on identifying geotagged images and their associated damage, local vs. global information fusion with images and they also develop an annotation scheme for image analysis. Their findings suggest that global Twitter users emphasise recovery and relief efforts while local users emphasise suffering and major damage. More recently, Alam, Ofli, and Imran (Citation2018b) present an image processing pipeline to extract meaningful information from social media images during a crisis situation, which has been developed using deep learning-based techniques. For this study, we use the same system to execute all of our image processing tasks.
4. Data collection and description
This study uses Twitter data collected during three natural disasters: Hurricanes Harvey, Irma, and Maria. We decided to focus on these three hurricanes among others during the 2017 Atlantic hurricane seasonFootnote3 based on the following two criteria: (i) whether the hurricane was classified as Category 4 or higher and (ii) whether the hurricane made landfall in a human-populated area. These two criteria indicate the most critical disaster events with extremely high societal disturbance and community harm. We used the Twitter streaming API to collect tweets that match with event-specific keywords and hashtags. This API returns 1% of the whole Twitter data at a particular time. As discussed earlier, images convey more information about the disaster situation than simple words, and hence, analysis of social media image data bears significant potential for crisis response and management purposes. A reasonable proportion of tweets posted during natural disasters include imagery content. In this study, we also collected images and analysed them. In the following subsections, we discuss the details of the dataset for each event.
4.1. Hurricane Harvey
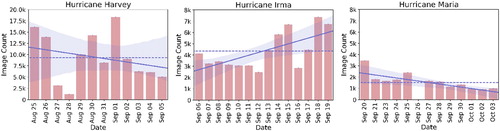
According to WikipediaFootnote4, Hurricane Harvey was a Category 4 storm when it hit Texas, USA on 25 August 2017. It caused nearly USD 125 billion in damage, which is record-breaking compared with any natural disaster in US history. For Hurricane Harvey, we started the data collection on 25 August 2017 using keywords: ‘Hurricane Harvey’, ‘Harvey’, ‘HurricaneHarvey’ and ended on 5 September 2017. In total, 6,732,546 tweets were collected during this period. (left chart) depicts the distribution of daily tweets in this collection. Surprisingly, we have a significantly lower number of tweets (i.e. less than 0.25 million per day) from August 25 to August 28Footnote5 compared to the next five days where a two-million-tweet peak can be observed on a single day, i.e. August 30. Among the Hurricane Harvey tweet data, 115,525 were found to have an image URL, out of which a total of 110,597 images were collected. (left chart) shows the distribution of image tweets on each day.
Figure 1. The total number of tweets collected for each event per day – Hurricane Harvey (left), Hurricane Irma (centre), and Hurricane Maria (right). Horizontal dashed lines show the average number of tweets per day, whereas the solid lines indicate the trends in the daily tweet data volume.
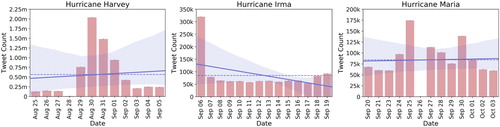
Figure 2. The total number of image tweets collected for each event per day – Hurricane Harvey (left), Hurricane Irma (centre), and Hurricane Maria (right). Horizontal dashed lines show the average number of image tweets per day, whereas the solid lines indicate the trends in the daily image tweets data volume.
4.2. Hurricane Irma
Hurricane IrmaFootnote6 caused catastrophic damage in Barbuda, Saint Barthelemy, Saint Martin, Anguilla, and the Virgin Islands. On Friday September 8, a hurricane warning was issued for the Florida Keys and the Florida governor ordered all public schools and colleges to be closed. The Irma storm was a Category 5 hurricane, which caused USD 64.7 billion in damage. We collected Hurricane Irma-related data from Twitter starting from 6 September 2017 to 19 September 2017 using the keywords: ‘Hurricane Irma’, ‘Irma storm’, ‘Irma’. In total, 1,207,272 tweets were collected during this period. (middle chart) shows the distribution of daily tweets of Hurricane Irma data. On the first day (i.e. September 6), we can see a surge of tweets in which more than 300,000 tweets were collected. However, during the next days the distribution stayed steady around 50,000 tweets per day. Besides, 60,973 of these Hurricane Irma tweet data contained image URLs, and we were able to download 60,932 of those images. The distribution of image tweets across days is shown in (middle chart).
4.3. Hurricane Maria
Hurricane MariaFootnote7 was a Category 5 hurricane that slammed Dominica and Puerto Rico and caused USD 90 billion in damage, resulting in thousands of deaths while leaving many more without homes, electricity, food, and drinking water. The data collection for Hurricane Maria was started on 20 September 2017 and ended on 3 October 2017. In total, we collected 1,096,335 tweets during this period using keywords: ‘Hurricane Maria’, ‘HurricaneMaria’, ‘Tropical Storm Maria’, ‘Maria Storm’. The right chart in shows the daily tweet distribution for the Hurricane Maria data.Footnote8 From the Hurricane Maria data, we found 19,681 tweets with image URLs and we were able to download all of them. The distribution of image tweets collected on each day is shown in (right chart).
We note that the keywords selected to collect data are high-level but still specific to all three hurricane events. The Twitter API returns tweets that mention these keywords. However, high-level keywords could bring more noisy data compared to specific keywords. This is due to the irrelevant messages that people post about mundane events, advertisements, jokes, etc.
On average, the daily volume of tweets containing images is higher for Hurricane Harvey (i.e. ) than those of Hurricane Irma (i.e.
) and Hurricane Maria (i.e.
). While the total number of image tweets per day exceeds
on certain days during Hurricane Harvey, the highest number of image tweets remains
per day for Hurricane Irma and
per day for Hurricane Maria. For Hurricanes Harvey and Maria, the trend lines indicate a decrease in the total number of image tweets per day as time passes, whereas we see an increase in total number of image tweets per day for Hurricane Irma.
5. Experimental methodology and results
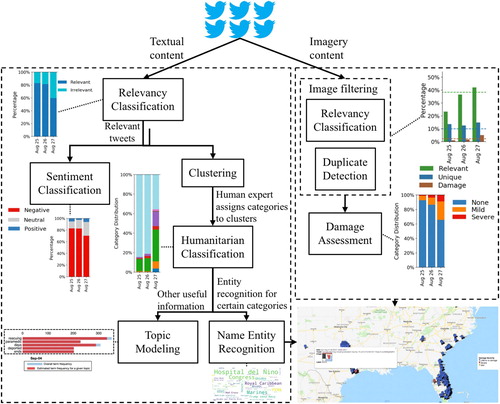
To analyse the three disaster events from the social media lens and to fulfil the objectives discussed in Section 2, we perform several experiments using the collected datasets. This section provides details of our experimental setup and analytical results. In , we present a high-level overview of our experimental methodology and sequence of steps we perform. The two branches of show different techniques to perform textual (i.e. left branch), and imagery (i.e. right branch) content analysis. The final result goes onto a map in case the data is geotagged or into a ranked-list otherwise. The textual content analysis comprises the following tasks: (i) filtering irrelevant tweets, (ii) classifying sentiment, (iii) topic modelling, (iv) classifying tweets into humanitarian categories, (v) identifying named entities, and (vi) detecting emerging topics. Whereas the imagery analyses branch includes filtering irrelevant and duplicate images and assessing the damage severity level from images. In the following subsections, we discuss the details of each component shown in the figure.
Figure 3. Overview of the proposed methodology with a sequence of data processing components for analysing both text and imagery content.
5.1. Textual content analysis
Tweets textual content is usually brief, informal, noisy, and full of shortened words, misspellings, and special characters. We perform preprocessing of tweet text before using them for further analysis. Specifically, we remove non-English words, stop words, non-ASCII characters, numbers, URLs, and the hashtag sign. Punctuation marks are replaced with white-spaces. The remaining words are converted to lowercase.
5.1.1. Relevancy classifier
Similar to the past studies (Alam, Ofli, and Imran Citation2018a), we observe several thousand tweets about advertisements, promotions, celebrities, etc., that use one of the event-specific hashtags such as #Harvey, and hence, are captured by our system. The idea of applying the relevancy classifier is to filter out such irrelevant tweets before performing further analysis. We trained a Random Forest (RF) classifier using the labelled dataset from Nguyen et al. (Citation2017a) consisting of tweets. The model is evaluated using a separate set of
tweets. The performance of the model in terms of F1 is 0.82.
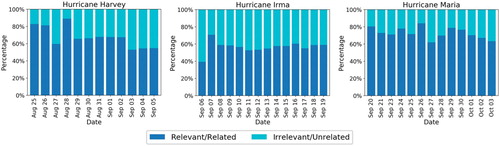
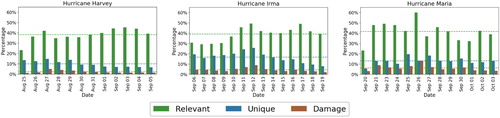
Based on the classification results, in , we show the distribution of ‘relevant’ vs. ‘irrelevant’ messages for each day of the three events. The results clearly show that social media data is not always clean and relevant. Almost half of the messages on each day across all three events are found as irrelevant, let alone useful for disaster response. Identifying and discarding these irrelevant messages is still a research challenge due to several reasons including differences in disaster events (floods vs. earthquakes), regions they occur (Asia vs. America), and languages the people of those regions speak (English vs. non-English). The proportion of relevant messages seems to follow a decreasing trend from to
during Hurricane Harvey whereas it stays approximately constant around
for Hurricane Irma and
for Hurricane Maria.
Figure 4. Daily proportion of relevant and irrelevant tweets for Hurricane Harvey (left), Hurricane Irma (center), and Hurricane Maria (right).
5.1.2. Clustering approach
One of the important challenges to classify a new disaster event data (e.g. using a supervised machine learning technique) is to first determine categories (i.e. classes) to which the messages should be classified. These classes should ideally be representative of the underlying data in the sense that they reflect the issues caused by the disaster event. For this purpose, we use clustering techniques on the potentially relevant data obtained from the relevancy classifier. Automatically generated clusters are then manually observed by human experts to assign a category name/label to each cluster. As shown in , the clustering approach can help an expert annotator determine humanitarian labels.
Our experiments consist of clustering tweets for each day of an event with the aim to find interesting groups representing useful information for situational awareness or other disaster response tasks. To perform clustering, we first design a feature vector for each tweet by exploiting a pre-trained word embedding with a finite vocabulary of dimension d. Each tweet
is a vector of
words
with each word as a fixed d-dimension representation in the word embedding space
. A tweet is thus represented as a
matrix
, where column j is a word
. We average column wise the matrix
to get tweet
represented as a d-dimensional vector
in the word embedding space
. The word embedding model
was trained with a continuous bag-of-words (CBOW) word2vec model (Mikolov et al. Citation2013) on a large crisis dataset with vector dimension d=300, a context window of size 5, and k=5 negative samples (Alam, Joty, and Imran Citation2018b, Citation2018a).
The dimension of our tweet vector is d=300, which is still too large to handle big data size, e.g. more than two million tweets on August 30 during Hurricane Harvey. In order to reduce the computational cost and get faster processing, we applied Principal Components Analysis (PCA) (Dunteman Citation1989). We analysed the data for each day, and while using PCA we fixed the cumulative variance of the first principal components to
.
Since the size of the data and its content vary for each day, the number of components varies from 5 to 25 but always capture of the total variance.
After applying PCA, we use K-means clustering algorithm (Hartigan and Wong Citation1979) within the space spanned by the PCA components. One important problem in clustering is to determine the number of clusters. We apply a grid-search approach for a different number of clusters and compute the silhouette value (Rousseeuw Citation1987).Footnote9 Finally, we pick the number of clusters that yields the maximum silhouette value. Then, we consider the optimal clusters and compute the first 10 nearest neighbours from the centre of each cluster. We manually analyse the corresponding 10 tweets to understand the topic of a cluster.
In , we present a few selected scatter plots of the clustering results. (a) shows the scatter plot of the clusters for Hurricane Harvey on 27 August 2017, with four clusters and an average silhouette value of 0.12. Manual analysis by an expert annotator shows that cluster ‘0’ represents ‘other useful information’, ‘1’ represents ‘damage’, ‘2’ represents ‘personal opinion’, and ‘3’ represents ‘caution and advice’.
Figure 5. Scatter plots representing the clustering results for Hurricanes Harvey, Irma, and Maria. (a) Hurricane Harvey, 27 August 2017. (b) Hurricane Irma, 7 September 2017 and (c) Hurricane Maria, 20 September 2017.
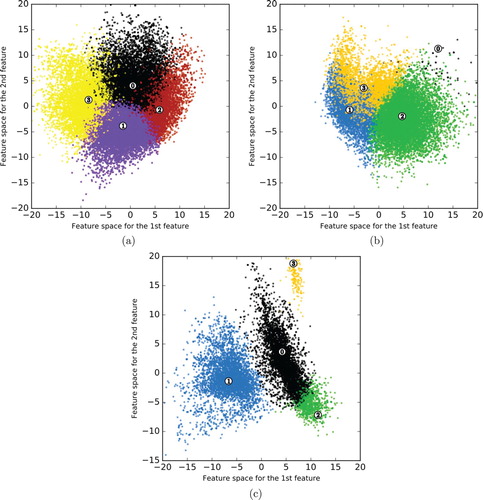
(b) shows the scatter plot of the clusters for Hurricane Irma on 7 September 2017. The number of clusters is four with an average silhouette value of 0.232. Our analysis suggests that cluster ‘0’ represents ‘personal updates’, ‘1’ represents ‘caution and advice’, ‘2’ represents ‘infrastructure damage’, and ‘3’ represents ‘other useful information’.
(c) shows the scatter plot of the clusters for Hurricane Maria on 20 September 2017. The number of clusters is four with an average silhouette value of 0.438. From the manual analysis, we see that cluster ‘0’ represents tweets related to ‘damages’, ‘1’ represents ‘after effect’, ‘2’ represents ‘personal opinion’ and ‘updates’ about Hurricane Maria, and ‘3’ represents ‘other useful information’.
Due to the noisy nature of the data as well as the inherent task complexity, we also observed overlaps in the clusters. For example, in (a), we see that there is an overlap between clusters ‘0’ and ‘2’, ‘0’ and ‘3’, as well as ‘1’ and ‘3’. This observation indicates that creating meaningful and coherent groupings of tweets can be computationally difficult, which is also reflected by the low silhouette value of 0.12. Such cases can be difficult to analyse even for expert annotators.
shows a few tweets from the ‘other useful information’ cluster of each event. The first tweet from Hurricane Harvey reports the cancellation of an event due to the disaster. This is an important information if captured timely could potentially help concerned public. Similarly, the tweet from Hurricane Maria reports the closure of an office due to the hurricane. In the third example, which is from Hurricane Irma, an update states that airports reopened and many people are without power These are all critical yet important small events, which are caused by the main disaster event. Such small events are hard to predict thus impossible to plan an appropriate response to them. However, timely detection of these events can help authorities overcome their severity.
Table 1. Example tweets from the ‘other useful information’ cluster.
5.1.3. Classification of humanitarian categories
When information needs are known, as in the case of many humanitarian organisations, supervised machine learning techniques are preferred over unsupervised techniques to categorise data. In this section, we report the results obtained from the supervised classification of the three events' data. In order to prepare the training data, one viable approach is to use semi-supervised techniques as discussed in the previous section, e.g. clustering followed by human supervision (see Section 5.1.2). For this study, to develop a classifier, we used a decision tree-based learning scheme known as Random Forest along with human-labelled Twitter data from a number of past disasters from CrisisNLP (Imran, Mitra, and Castillo Citation2016).Footnote10 The labelled data were collected during more than 30 past disasters including hurricanes, earthquakes, and floods.
shows the class distribution of our training, development (dev), and test sets. The training set is used to train the model, the development set is used for parameter tuning, and the test set is used for the model evaluation. To train the model, we used a bag-of-words approach. The performance obtained using the test set in terms of the F1-score is 0.64 and accuracy of 0.66 (weighted averages across all categories). In , we also present the performance results of individual categories. The trained model is then used to classify all the tweets of the three events which were classified as ‘relevant’ by our relevancy classifier (Section 5.1.1).
Table 2. Data distribution used to train a text classification model for humanitarian categories.
Table 3. Category-wise performance of the text classification model in terms of Precision (P), Recall (R), and F1-score.
In , we present a day-wise distribution of the automatically classified tweets for the three events. One clear pattern is that the most prevalent category is the ‘other useful information’ category across all events. This is not surprising because many of the tweets that do not belong to one of the other specific humanitarian categories but are still relevant to the disaster event fall into this category. We defer an in-depth evaluation of this category until Section 5.1.6. The second most dominant category is ‘donation and volunteering’. This category contains tweets either requesting any kind of donations, or offering help or donations. However, the donation category seems to emerge slowly as the disaster event progresses. For instance, see the first few days of all three events when fewer donation-related data is found. In the early hours or days of an event, fewer donation requests or help offers are due to the limited information available about the devastation of the event and affected people. As time progresses, information spreads, which leads to more situational awareness, and thus more requests or donation offers start appearing from the general public as well as from NGOs. More intelligent systems which can predict people's urgent needs in advance can overcome this information scarcity issue.
Figure 6. Temporal distribution of categories based on the automatic classification of tweet text into one of the humanitarian categories for Hurricane Harvey (left), Hurricane Irma (centre), and Hurricane Maria (right).
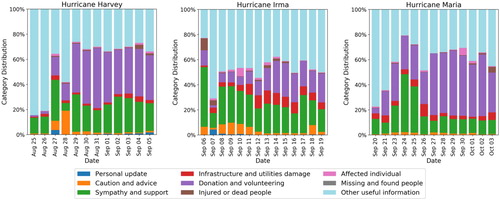
In contrast, ‘caution and advice’ messages seem to appear mostly at the beginning of an event and then slowly disperse. The behaviour of sharing warning and caution messages at the beginning of an event is understandable as especially in the case of disaster events like hurricanes, it is easy to predict their path and expected landfall date/time in advance. The early predictions of such events help the general public and officials to post warnings for people who are under threat. The ‘sympathy and support’ category contains prayer and thought messages and it seems consistent across all the events and days except for the last five days of Hurricane Maria where we observe lower proportion of sympathy messages as compared to the other two events.
Among the other relatively less prevalent categories, the ‘infrastructure and utilities damage’ category gradually emerges and becomes more prominent during the middle days of the events. This is again due to the limited information availability during the early days of an event. The ‘injured or dead people’ category appears during some days of Hurricanes Irma and Maria, but the ‘missing and found people’ category is among the least prevalent, as actually there were no missing or found cases reported during the three events.
With all these insights, we remark that supervised machine learning techniques can provide high-level situational information useful for disaster response. However, there are challenges associated with supervised learning approaches, e.g. lack of labelled data to train robust models, class imbalance problem, and inherent task complexity in a disaster context.
5.1.4. Sentiment analysis
To perform the sentiment analysis, we use the Stanford sentiment analysis classifier (Socher et al. Citation2013) to extract the sentiment labels that are being expressed or semantically represented in the tweets. The Stanford sentiment analysis classifier consists of five categorical labels such as Very Negative, Negative, Neutral, Positive and Very Positive. For each tweet, the classifier assigns one of the five categories with their confidence. The classifier has been designed using Recursive Neural Tensor Network and exploiting sentiment treebank, which consists of fine-grained sentiment labels for 215,154 phrases in the parse trees of 11,855 sentences. The accuracy of the classifier for fine-grained sentiment labels is as presented in Socher et al. (Citation2013). For our task, we feed the preprocessed and filtered tweets to the classifier to get the classifier's prediction. We observe that in general only a few tweets in each collection are labelled as ‘Very positive’ or ‘Very negative’. Upon further investigation, we do not see any significant difference between ‘Very positive’ and ‘Positive’ tweets, or between ‘Very negative’ and ‘Negative’ tweets. Therefore, for the sake of clarity of the results, we combine ‘Positive’ and ‘Very positive’ classes into a single class as ‘Positive’, and ‘Negative’ and ‘Very negative’ classes into a single class as ‘Negative’.
In , we present the distribution of sentiment results in terms of three classes for each day for the three events. One can observe that the ‘Negative’ sentiment dominates for all the three events across all days. To understand what causes negative sentiments during these events, we followed the popular mixed-methods approach, specifically the sequential explanatory design as discussed in Creswell and Creswell (Citation2018), in which the quantitative results were used to perform qualitative analysis. For the qualitative analysis, we followed the multiple case study approach (Yin Citation2017).
Figure 7. Sentiment analysis results: distribution of daily sentiment for Hurricane Harvey (left), Hurricane Irma (centre), and Hurricane Maria (right).
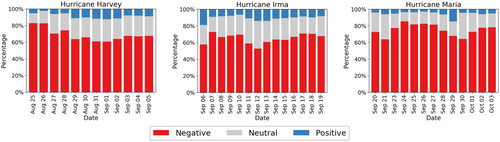
We observe that one of the factors that cause high negative sentiment in the early stage of a disaster is due to the use of aggressive and explicit language. For instance, the use of words like ‘F**k’, ‘s**t’, ‘b***h’ in the messages, cursing disaster, complaining, and expressing anger when someone's plan gets disturbed due to the disaster event were all factors considered determining negative sentiment. Moreover, we noticed that unresolved issues of affected people also trigger negative sentiment during such events. People show frustration when the government or concerned authorities do not address their concerns or respond slowly. Complaints and concerns about the power outage, lack of drinking water, food, or other necessary facilities were also identified during these events. Real-time monitoring of public sentiment from social media streams can be useful for the authorities to understand issues and concerns of affected people and help them plan and guide response efforts towards addressing those concerns.
5.1.5. Humanitarian category-specific NER
Named-entity recognition has been proposed as part of a visual analytic tool in Aupetit and Imran (Citation2017) to extract top-k entities from tweets. In this study, we also used the Stanford NER toolkit (Finkel, Trond, and Manning Citation2005) to analyse the three hurricanes in terms of top ‘persons’, ‘ organisations’ and ‘locations’ mentioned in collected tweets. The reported F-measure of this NER system is 86.72 to 92.28 for different datasets.
However, to get more insights about events and entities, we investigated entities based on humanitarian categories. Particularly, we focused on ‘donation and volunteering’ category to understand which entity mentions are appearing most. The reason to choose this category is that information belonging to this category are very vital during disaster situations. For example, humanitarian organisations might need to know which organisations or persons are willing to donate or talk about donation, and who could be good social media influencers to seek a donation. In general, people post tweets requesting for help, aid, donation, and need. Our deeper analysis of entity types ‘ organisations’ and ‘persons’ show what people talk about different organisations and persons during disasters.
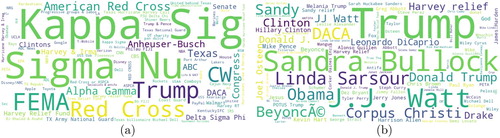
In , we present the most frequent ‘ organisation’ and ‘person’ entity mentions associated with ‘donation and volunteering’ from Hurricane Harvey data. The top organisations that donated or contributed to help Harvey-affected people are ‘Kappa Sig’, ‘Sigma Nu’, ‘FEMA’, and ‘Red Cross’ as highlighted in (a). In (b), we present the most frequent ‘person’ entity mentions. Trump is mentioned most not because he donated but also for the criticism he received, e.g. an excerpt of a tweet ‘Mexico offered to help with #Harvey rescue. Trump won't even acknowledge them’. ‘Sandra Bullock’ appeared as the second most frequent entity due to her contribution of $1 million dollars for the relief efforts.
Figure 8. Most frequent entity mentions in the ‘donation and volunteering’ category for Hurricane Harvey. (a) Organisation and (b) person.
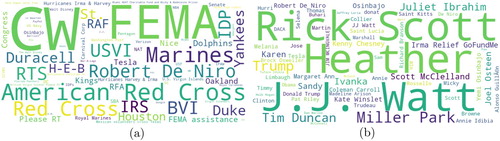
presents the most frequent ‘ organisation’ and ‘person’ entity mentions for Hurricane Irma data. The entity mentions ‘Heather’ appeared many times as ‘Heather Crowson’ mentioned in tweets who lost his house. Another entity mention ‘Rick Scott’, who is the Governor of Florida, appeared many times. The third most mentioned entity is ‘J.J. Watt’, who started a relief fund. People tweeted about it to raise fund and for seeking donations. For the ‘ organisation’ entity type, we see that ‘FEMA’, ‘CW’, and ‘American Red Cross’ are the most frequent. Federal Emergency Management Agency (FEMA) is an agency of the United States whose primary purpose is to coordinate the response to a disaster that has occurred in the United States. CW is a television network, who started raising fund for affected people during Hurricane Irma.
Figure 9. Most frequent entity mentions in the ‘donation and volunteering’ category for Hurricane Irma. (a) Organisation and (b) person.
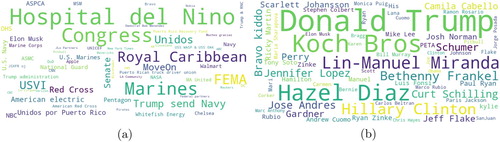
In (a), we present top entities of type ‘ organisation’ for Hurricane Maria. Here, entity mentions ‘Congress’ appeared the most not because they supported or donated Puerto Rico, but rather, to seek help from. Whereas ‘Hospital del Niño’, ‘FEMA’, ‘Unidos’, and ‘Marines’ appeared because of their greater support for affected people during Hurricane Maria. In (b), we report entity mentions with ‘person’ type. ‘Donald Trump’, and ‘Koch Bros.’ are mentioned the most as people were asking them to support Maria-affected people. The ‘Hazel Diaz’ is the third most frequently mentioned entity, who was seeking to request to help Maria-affected people. NER system recognised ‘Jones Act’ as a ‘person’ entity type although it is not actually a ‘person’ entity type. However, people were talking heavily about waiving this act, which can facilitate humanitarian aid. Many other celebrity names are mentioned because of their contributions for donating or seeking support for Maria-affected people.
Figure 10. Most frequent entity mentions in the ‘donation and volunteering’ category for Hurricane Maria. (a) Organisation and (b) person.
5.1.6. Topic modelling
To understand topics of discussion on Twitter during three disasters, we used LDA (Blei, Ng, and Jordan Citation2003), which is a well-known topic modelling technique, to generate topics from large amounts of textual data. Topic modelling helps understand and summarise large collections of textual information. With topic modelling, we aim to discover hidden topical patterns that are present across different days of a disaster event. Moreover, with human intervention, we aim to analyse these topics and annotate them to summarise a discussion point. We apply LDA to generate (K=10) topics from preprocessed tweets using each day's data from all three events. It is observed that larger K values do not yield significantly useful topics, and smaller values tend to yield very general topics (Imran and Castillo Citation2015). Due to space limitations, we do not present all the results of 10 topics for each day. Instead, we show the top 30 most relevant words (i.e. words with a high probability of being associated to a topic) for the most prevalent topic among 10 topics obtained from randomly selected four days of an event.
depicts the results obtained from Hurricane Harvey data. shows the results obtained from Hurricane Irma data, and shows the topics obtained from Hurricane Maria data. Different than traditional clustering techniques in which one data point (e.g. tweet text in our case) can only belong to one cluster/topic, in topic modelling, it can belong to different topics. For example, a tweet can talk about different aid needs like food, water, shelter. For this reason, in our results, one might notice the same words appearing in multiple topics. The red bars indicate word/term frequency for a given topic. The right part of the bars (blue - light color) show the term frequency for a given day (i.e. how many times a word appear in a given day). All words shown in a figure belong to one topic for a given day. To analyse the results obtained from the experiments and to investigate if there are interesting topics useful to gain situational awareness, we again followed the mixed-methods qualitative analysis approach (Creswell and Creswell Citation2018). Moreover, to perform the qualitative analysis, we followed the multiple case study approach (Yin Citation2017).
Figure 11. LDA-generated topics from some selected days of Hurricane Harvey. We show the top 30 most relevant words for the most prevalent topic among 10 topics on a given day.
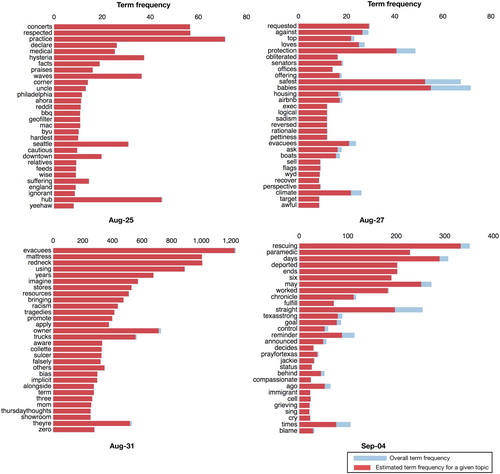
Figure 12. LDA-generated topics from some selected days of Hurricane Irma. We show the top 30 most relevant words for the most prevalent topic among 10 topics on a given day.
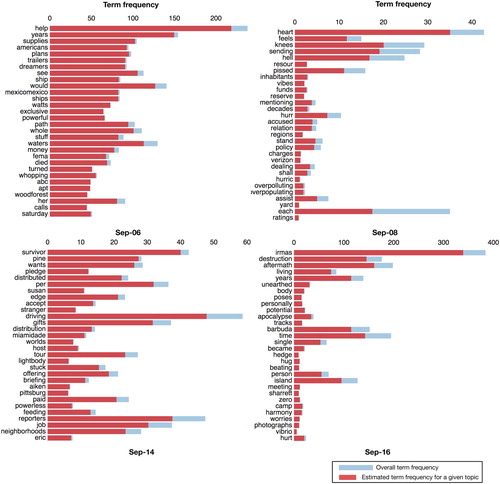
Figure 13. LDA-generated topics from some selected days of Hurricane Maria. We show the top 30 most relevant words for the most prevalent topic among 10 topics on a given day.
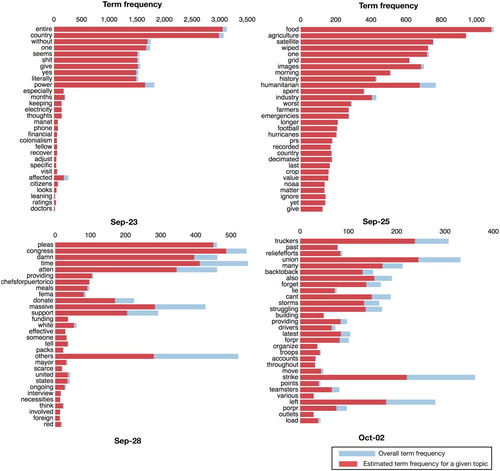
We observed that the most prevalent topic, which emerged on 31 August 2017 during Hurricane Harvey, contains ‘evacuees’, ‘mattress’, and ‘redneck’ as the top three most relevant words. The reason behind this topic was about a mattress chain owner who offered his stores to accommodate Harvey evacuees and his trucks for rescue operations. Similarly, on September 4 during Hurricane Harvey, one of discussion points was about ‘rescuing’, ‘paramedic’, and ‘worked’, as shown in . Upon further investigation, we found that this topic emerged due to a large number of tweets posted about a paramedic who reportedly worked six straight days to rescue Harvey victims, and a discussion developed around the topic that he may be deported if Trump ends DACA.Footnote11
One of the dominant topics that emerged on September 6 during Hurricane Irma contains words: ‘help’, ‘years’, and ‘supplies’. This was due to a large discussion around the tweet ‘Trump plans to ship 800,000 Dreamers back to Mexico … Mexico ships 25 trailers of supplies to help Americans … ’. Among the topics obtained from Hurricane Maria data, there is a topic about people's concern regarding ‘There will be no food in Puerto Rico. There is no more agriculture in Puerto Rico for years’. However, on October 2, an important topic emerged about some strike of truck drivers in Puerto Rico, delaying delivery of donation goods. Overall, we observe that LDA-generated topics reveal critical public issues and concerns during disasters. For response organisations, anticipating such issues is hard. However, a system that identifies prominent and emerging topics over time (e.g. per day or per 6-h period) to inform emergency managers about important issues that public is facing would be immensely helpful.
5.2. Imagery content analysis
For a detailed analysis of imagery content, we employed our image processing pipeline presented in Alam, Ofli, and Imran (Citation2018b), which comprises models for relevancy and duplicate image filtering as described in Nguyen et al. (Citation2017b) as well as a model for damage severity assessment as studied in Nguyen et al. (Citation2017c). For the sake of completeness, we next provide brief descriptions of the referenced models and summarise their performance scores.
5.2.1. Image filtering
The relevancy filtering model filters images showing cartoons, banners, advertisements, celebrities, etc. which are deemed as irrelevant content by many humanitarian organisations during disasters. We trained this model as a binary (i.e. ‘relevant’/‘irrelevant’) classification task using a transfer learning approach where we fine-tuned a pre-trained deep image recognition model for relevancy filtering task at hand. On a held-out test set, resulting model achieved precision and
recall (Nguyen et al. Citation2017b).
The de-duplication filtering module aims to identify exact- or near-duplicate images with little modifications such as cropping/resizing, padding background, changing intensity, embedding text, etc. We implemented this model using a perceptual hash technique to determine whether a given image is an exact- or near-duplicate of previously seen images. The similarity threshold was determined as the optimal operation point of ROC curve, which yielded precision and recall (Alam, Ofli, and Imran Citation2018b).
Using our image filtering models, we analyse proportions of relevant and unique images in social media imagery data collected during Hurricanes Harvey, Irma and Maria. The results of our relevancy and uniqueness analyses are in conformity with past observations of Nguyen et al. (Citation2017b) as illustrated in . Specifically, around of images are deemed ‘relevant’ to actual disaster event in Hurricanes Harvey, Irma and Maria, i.e.
,
and
, respectively. Furthermore, Hurricane Irma data contain
unique images, whereas Hurricane Maria data contain
and Hurricane Harvey data contain
unique images on average. Based on these observations, we can state that there is relatively less relevant content in the first few days of a disaster event than the following days of the same event (except for Hurricane Maria). One possible hypothesis to explain this is that social media users can start speculating about the event before it takes place or behave opportunistically to populate their own irrelevant content using the trending topic. However, the ratio of relevant content seems to increase as more users start witnessing the devastation caused by the disaster. In contrast to this increasing trend in the relevant content ratio, the unique content ratio seems to drop towards the final days of a disaster event. This is most likely due to the typical behaviour of social media users where they tend to redistribute (i.e. re-tweet) the existing content in their own networks. Regarding the damage content ratio within the unique content, we observe a different pattern which shows an increasing trend at the beginning of the event and then a decreasing trend towards the end of the event. The reason for this type of behaviour needs to be investigated further.
Figure 14. Ratio of daily images retained after relevancy filtering (‘Relevant’), de-duplication (‘Unique’), and damage assessment (‘Damage’) for Hurricane Harvey (left), Hurricane Irma (centre), and Hurricane Maria (right).
5.2.2. Damage assessment
The damage assessment model categorises severity of damage observed in an image into three categories, i.e. ‘severe’, ‘mild’, and ‘none’. We trained this three-class classification model using ground truth disaster images annotated by humans following the same transfer learning strategy that we used for our relevancy filtering model. The overall accuracy of resulting damage assessment models varied from to
on held-out test sets depending on the disaster type (Nguyen et al. Citation2017c).
In , the rightmost bars for each particular day indicates the percentage of images with some damage content (i.e. ‘mild’ or ‘severe’). On average, of Hurricane Harvey images show damage content whereas
of Hurricane Irma and
of Hurricane Maria images show damage content. Moreover, this ratio can be twice as high in the later days of all disasters. Overall, an interesting observation is that even though the total volume as well as the daily volume of image tweets is relatively smaller for Hurricane Maria, proportions of unique or damage images are higher than those for Hurricanes Harvey and Irma. Even though daily changes in the prevalence of relevant and damage images during Hurricane Maria seem to be strongly correlated (r=0.71, p<.01 ), we do not observe a statistically significant correlation between relevant and damage image tweet distributions for Hurricane Irma (r=0.41, p=.14) and Hurricane Harvey (r=0.04, p=.90 ). On the other hand, daily changes in prevalence of unique and damage images during Hurricane Irma seem to be very strongly correlated (r=0.85, p<.001) whereas they seem to be only strongly correlated (r=0.62, p<.05) during Hurricane Harvey. Even though we observe a moderate correlation between unique and damage image tweet distributions for Hurricane Maria, this correlation is not statistically significant (r=0.44, p=.13 ).
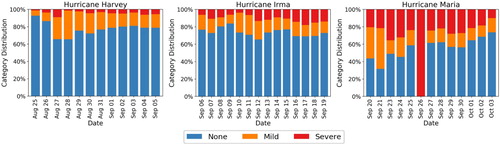
Next, we analyse the severity of damage (i.e. ‘severe’, ‘mild’, and ‘none’) observed in the set of images that were deemed relevant and unique. For this purpose, we use the damage assessment classifier discussed earlier (Nguyen et al. Citation2017c). In , we take a closer look at damage assessment analysis of images after relevancy and uniqueness filtering for all events. On any given day, only 20–30% of Hurricane Irma images that are relevant and unique depict some damage content (i.e. ‘mild’ or ‘severe’), whereas this ratio varies between 30–60% for Hurricane Maria. Furthermore, among those Hurricane Irma images that depict some damage content, we see more examples of ‘mild’ damage than ‘severe’ damage. On the contrary, images with damage content in Hurricane Maria data show more ‘severe’ damage than ‘mild’ damage. Among three hurricanes, Hurricane Harvey data seems to contain the least proportion of ‘severe’ damage content. These observations are in conformity with the strength of the respective hurricanes (i.e. Hurricane Harvey was classified as Category 4, whereas Hurricanes Irma and Maria were classified as Category 5). Moreover, Hurricanes Irma and Maria made landfalls in regions that are relatively less developed in terms of infrastructure. Therefore, the devastation caused by these hurricanes were more severe.
Figure 15. Distribution of ‘severe’, ‘mild’, and ‘none’ damage images after relevancy and uniqueness filtering for Hurricane Harvey (left), Hurricane Irma (centre), and Hurricane Maria (right).
5.3. Tweets with geolocation
As presented in , the classified data obtained from different supervised models can be visualised on a map, we use geolocation information of tweets to visualise them on a map. depicts three maps of geotagged tweets for Hurricanes Harvey, Maria, and Irma.
Figure 16. Visualisation of the analytical results on the map. (a) Geotagged tweets with sentiment categories for Hurricane Harvey. (b) Geotagged tweets with humanitarian categories for Hurricane Irma and (c) Geotagged tweets with damage severity categories for Hurricane Maria.
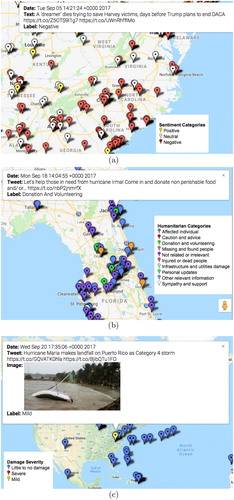
In (a), we show the geographic distribution of Hurricane Harvey tweets classified by our sentiment classifier discussed in Section 5.1.4. The highlighted tweet in the figure is posted by a local newspaper, The News Leader,Footnote12 which reports that a person dies while rescuing Harvey victims. This is obviously a piece of sad news and the classifier tagged it with a negative sentiment. Moreover, the map clearly shows areas where the negative sentiment dominates, which could potentially be an indicator for crisis managers to focus and understand issues of the general public causing the negative sentiment.
In (b), we present geotagged tweets from Hurricane Irma that are automatically classified by our humanitarian classifier discussed in Section 5.1.3. The highlighted tweet in the figure is classified as ‘donation and volunteering’. From the textual content of the tweet, it is clearly visible that it seeks for donation and refers to an Instagram post with a shortened URL. In this limited view of the map, we observe most of the tweets as ‘irrelevant’, however, tweets reporting injured or dead people (three orange markers) can also be noticed.
Finally, in (c), we present geotagged tweets from Hurricane Maria where the imagery content of the tweets is automatically classified using our damage assessment classifier discussed in Section 5.2.2. The image associated with the highlighted tweet in the figure shows the condition of the weather, which is tagged as severity level ‘mild’ by the classifier.
One may notice that the number of geotagged tweets are very low on the map as compared to the number of tweets originally collected. This is because we only present tweets that already contain geolocation information as part of their crawled raw data (i.e. JSON). The ratio of tweets with geolocation information varies depending on the collection but is typically around 1–2% of all the tweets collected during an event. In the scope of current study, we did not apply any geo-inference algorithm on textual and/or imagery content, which would be a task for our future work.
6. Discussion and future directions
In this section, we summarise the contributions of this work and discuss our answers to the research questions posed in Section 2. We also comment on the limitations of the analysed computational techniques and propose future research directions.
6.1. Discussion
Although several research studies demonstrate the usefulness of social media communications (i.e. textual messages and images) for disaster and emergency response, there are still many challenges that restrain humanitarian organisations from including social media information in their formal response processes. These challenges include information overload, information credibility, effective information processing, dealing with noisy content, and mundane discussions, among others. The importance of these aspects has also been reported in other studies (Ludwig, Reuter, and Pipek Citation2015; Reuter et al. Citation2015; Onorati, Díaz, and Carrion Citation2018). Our current work is a step forward to bridge this gap by providing a methodological approach that comprises several computational techniques to process multimodal social media data to solve many of the aforementioned challenges. For this purpose, we posed and investigated three main research questions in this study.
RQ 1: How do different content types (i.e. textual and imagery content) convey complementary useful information to improve situational awareness?
The findings from our multidimensional analyses in Section 5 revealed that both textual and imagery content types contain critical and oftentimes complementary information, which is useful for humanitarian organisations to understand a complete picture of an event. For example, the devastation of a disaster event can be observed rather easily from images showing destroyed buildings and bridges whereas information about injured, dead, or trapped people can be extracted more accurately from text messages. Similarly, for assessing individuals' sentiment, one could rely on text messages rather than images. On the other hand, images that show people helping or rescuing others, or involved in volunteering efforts prove more useful to understand the status of the affected individuals or the quality of the ongoing rescue operations. In general, understanding context and handling missing information are the most important issues which can greatly benefit from using complementary information provided in text messages and images.
To elaborate further on the complementary aspects of textual and imagery content, let us take a closer look at which shows several example tweets with images classified into different damage categories. In some cases such as (a–c) and (g–i), both tweet text and image content provide critical information related to infrastructure and utilities damage at different severity levels. However, unlike their image counterparts, tweet texts in (d–f) do not provide any significant information about the severity or extent of damage incurred by disaster events other than just stating that the disasters caused some damage. Similarly for tweets in (j–l), images provide some crucial damage information related to power lines, roads, etc., whereas the corresponding texts report a dead person, questions why hurricanes are named, or mentions the path of the hurricane. More importantly, even though the tweets in (m–r) do not show any damage content, they provide critical information for other humanitarian categories. For instance, (o) provides valuable insight for the quality of shelter. Similarly, (q) illustrates an example of evacuation and displaced people. In summary, these examples support our findings to answer our first research question.
Figure 17. Sample images with different damage levels from different disaster events. Tweet text corresponding to these images are as follows: (a) RT @MikeTheiss: Extreme Damage in Rockport, Texas #HurricaneHarvey. (b) Hurricane Irma's trail of havoc in Sint-Maarten https://t.co/kBiADDJC8E. (c) Hurricane Maria destroys hundreds of homes, knocks out power across Puerto Rico … . (d) Texas county's long recovery from Hurricane Harvey begins. (e) Haiti still has not recovered from Hurricane Matthew. Now here comes Irma. (f) Lehigh Valley residents wait for news as Hurricane Maria sweeps through Caribbean. (g) RT @stephentpaulsen: My street in SE #Houston is now a river. That light is from lightning; it is 10pm #Harvey. (h) AJEnglish: Hurricane Irma causes devastation across the Caribbean. (i) Hurricane Maria blasts Puerto Rico with high winds and flooding. (j) RT euronews ‘At least one person killed as Hurricane Harvey moves inland’. (k) RT @verge: Why do hurricanes have names? (l) RT @fox6now: Timeline of Hurricane Maria's path of destruction over Puerto Rico (m) RT @CBSNews: Texas Gov. Greg Abbott: Search and rescue is the key focus in Harvey response. (n) RT @Reuters: Hurricane Irma threatens luxury Trump properties. (o) Hurricane Maria Makes Landfall In Puerto Rico. (p) RT @nbcsandiego: Dramatic photos of Hurricane Harvey. (q) RT @KLOVEnews: Florida braces for Hurricane Irma, many evacuate the Keys and (r) Hurricane Maria Unleashes Devastating Cat 4 Power On Puerto Rico, Caribbean.
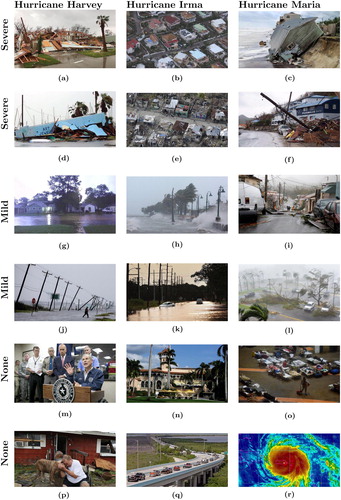
In order to maximise the information gain from social media, there have been recent attempts to combine imagery content associated with textual content (Liang, Caverlee, and Mander Citation2013b; Dewan et al. Citation2017; Mouzannar, Rizk, and Awad Citation2018). For instance, Mouzannar, Rizk, and Awad (Citation2018) proposed a multimodal deep learning approach that combines text and images for identifying damage in social media posts. The study by Liang, Caverlee, and Mander (Citation2013b) explored both text and image to asses the earthquake damage. Their findings suggest that tweets containing images provide valuable location information. Dewan et al. (Citation2017) reported that for many scenarios images can provide richer information, which is not visible in the text. Our study is in line with the findings of these studies. In addition, we proposed a methodology in which both text and image provide complementary information about the situation.
RQ 2: In which ways can computational techniques, such as topic modelling, clustering, sentiment analysis, named-entity recognition, and classification, be used to process textual as well as imagery data in social media specifically to improve situational awareness?
To answer this question, we explored several sate-of-the-art computational techniques to process Twitter data (i.e. both text and images) collected during three major disaster events. The motivation behind using different techniques is that each technique has its own advantages and limitations, but when we combine findings from different techniques, we can provide a richer set of information useful for crisis managers.
For the textual content analysis of social media, we first analysed how unsupervised clustering techniques can help expert annotators to digest large amounts of unlabelled data to identify potential categories (i.e. class labels) of interest to humanitarian organisations. Since clustering algorithms generate coherent groupings of data based on their content, expert annotators need to manually inspect only a few tweets from each cluster to decide what each grouping of tweets represents. Despite the need for some manual analysis, this process can help experts identify disaster-specific humanitarian categories with minimal effort. For clustering disaster-specific social media data, Yin et al. (Citation2015) proposed an algorithm to cluster event-specific topics. In another study, Pohl, Bouchachia, and Hellwagner (Citation2015) used hierarchical clustering approach for sub-event detection. Our study differs from these works because we focus on time-critical analysis of Twitter streams, which requires a computationally-efficient and humanly-possible approach to process data.
Besides unsupervised clustering, we also explored topic modelling approach as a means to extract topics automatically from large amounts of unlabelled textual data in order to understand and summarise topical discussions on social media about the ongoing event as well as to discover new topics about emerging sub-events. Similar to the clustering approach, topic modelling also needs some human supervision to make sense of the automatically discovered topics. However, topic modelling requires relatively less effort than clustering as it also provides a list of the most relevant words for each topic, which human experts can benefit while understanding what each topic represents. Recent notable work for topic modelling includes the work by Resch, Usländer, and Havas (Citation2018), in which they used cascaded LDA for topic modelling and found 25 to be the optimal number of topics in their study, which is higher than ours. Such differences are possible due to different data distributions and experimental settings. However, we intend to serve the system in a real-time setting to facilitate crisis managers. During time-critical situations evaluating a high number of topics is a laborious task for crisis managers, therefore, we keep the number of auto-generated topics low.
Once the humanitarian information types (i.e. categories) are known, then supervised classification techniques become beneficial in automatically categorising the incoming data (i.e. both text and images) into different information buckets so that emergency managers can gain high-level situational awareness about the ongoing disaster event. For example, a large amount of tweets categorised as ‘infrastructure and utility damage’ with their projections on a map can help crisis managers understand which areas in a disaster zone are affected the most. Though a major bottleneck for supervised classification algorithms is that they require labelled, ideally also balanced, data across different categories to train robust classification models for the task at hand. For the humanitarian classification task, there have been many studies that focus on taxonomy definition, data collection, and classification of data using different learning algorithms (Ragini and Anand Citation2016; Nguyen et al. Citation2017a; Khare et al. Citation2018). Building on the past work, we demonstrated the use of a defined taxonomy for classification and also show how new topics and classes can be learned and incorporated into the taxonomy during an going situation.
Our analysis of using the named-entity recognition technique on social media data suggested that identification of highly-mentioned named entities can help discover important stories either to filter them out in order to focus on messages related to actual local emergency needs or to consider some messages for further detailed analysis. Furthermore, for certain humanitarian categories, crisis managers might be interested to know ‘who’ is mentioned the most and about ‘what’, e.g. who could be an influencer for seeking donations. In addition, we note that it is also possible to identify the amount of donation from different organisations/persons by a fine-grained entity recogniser with entity type ‘money’. A similar study has been conducted for location entity recognition in Lingad, Karimi, and Yin (Citation2013), where the authors compared different publicly available entity recognition systems. They report that extracting location information from microblogs is important for increasing situation awareness. In addition, their findings suggest that Stanford NER performs better than other related tools. Compared to this, our study reports different entity types and their associations with different tweet types (e.g. donation and volunteering).
We showed that sentiment analysis can help authorities comprehend people's feelings and concerns. For example, a representation of negative sentiment can entail the causes by actual issues faced by affected people. Humanitarian organisations and other government agencies can use the sentiment analysis results to plan and guide their response efforts towards addressing those affected individuals' most pressing concerns. Our findings from sentiment analysis are inline with the findings discussed in Beigi et al. (Citation2016). Authors provided a detailed literature review, where they highlight the importance of sentiment analysis with visual analytics for disaster relief scenarios.
For the image content analysis, we presented the importance of image filtering and how the filtered set of images can be used for damage assessment. Compared to the studies of textual content, the studies of image analysis for disaster situations are relatively few (Alam, Imran, and Ofli Citation2017; Dewan et al. Citation2017; Nguyen et al. Citation2017a).
In summary, all of the above insights reveal that the computational techniques explored in this paper can be applied on social media data to gain situational awareness, which answers our second research question.
RQ 3: How can we devise a methodology that capitalises on several computational techniques effectively in a unified framework to help humanitarian organisations in their relief efforts (mainly related to situational awareness)?
We have already described in our answer to RQ 2 how different computational techniques can be applied individually to help experts in the crisis response and management domain and highlighted advantages as well as limitations of each one of them. However, we have not elaborated on how (if) we can combine the benefits of all these techniques into a unified framework (i.e. an end-to-end methodology), which is specifically the goal of our third question.
Our proposed methodology in this study is based on simultaneous analysis of multimodal content in social media. On both text and image analysis tracks, we propose starting with a relevancy classifier to eliminate irrelevant content from the downstream data processing pipeline. Then, on the text analysis track, we envision running a sentiment classifier immediately on all the text messages retained as relevant so that crisis managers and other authorities can monitor public's feelings and concerns. In the meantime, we suggest a hierarchical analysis approach for a deeper understanding of the textual content. This hierarchical analysis begins with unsupervised clustering of unlabelled text data so that human experts can identify categories (i.e. class labels) potentially of interest to the ongoing disaster event (if they do not already have a specific list of humanitarian categories at hand). Then, once the humanitarian categories are specified, we envision running a supervised classifier on all the incoming relevant tweets to categorise them into different information buckets on the fly. At this stage, the extracted categorical information can already be consumed by emergency managers to gain situational awareness. However, going one more level deeper in the hierarchical analysis, we envision employing category-specific NER analysis in certain humanitarian categories to provide emergency managers with fine-grained insights about ‘who’ is doing ‘what’ and ‘where’. Similarly, we anticipate extracting further useful information from some of the humanitarian categories such as ‘other related information’, which captures those tweet messages that are relevant to the event but do not fall into one of the other more specific humanitarian categories. For instance, from our analysis, we actually found that a significant amount of tweets fall under the ‘other related information’ category. To make sense of the text messages in this category, we propose using topic modelling to discover other potentially important bits of information and emerging topics (i.e. sub-events). On the image analysis track, to complement the information extracted from textual content as suggested by our experimental findings, we propose applying a damage assessment classifier on the set of images that are deemed as relevant and unique. Finally, we visualise all of this information on a map if the data is geotagged or present the results as a ranked-list to generate visual and descriptive summaries of disaster events. Consequently, our proposed methodological approach combines different computational techniques in such a way that maximises their effectiveness for situational awareness tasks, and hence, provides an answer to our third research question.
6.2. Limitations and future directions
Our current work proposes a methodological approach which uses several computational techniques to process social media data. However, we remark that these computational techniques have certain limitations. For instance, unsupervised learning techniques such as clustering require some manual effort to make sense of the resulting clusters and to assign appropriate labels to them. More appropriate approaches, for instance from mixed-method research, can be adapted to perform a qualitative analysis of the clusters more efficiently. On the other hand, for supervised learning techniques, the major limitation is the lack of domain-specific labelled data to train domain-specific models. Therefore, more social media data need to be labelled to build robust models for handling social media noisy content. In addition to these limitations, this work can be improved along several directions as we discuss next.
We note that assessing the overall severity of damage from images as a classification task is certainly helpful but not sufficient. Humanitarian organisations need more concise situational awareness information such as the type of built structures (e.g. houses, buildings, roads, bridges, etc.) and damage severity assessment for each one of these structures. This task can be addressed by object detection and localisation techniques proposed in computer vision domain, however, they need to be adapted to deal with typical scenes in disaster context, which is one of our future works.
An important problem, and a dire demand from crisis managers, is the projection of the extracted information on a map. Currently, approximately around 1% of the tweets contain geolocation information, which makes the map generation task infeasible. However, this limitation opens a research avenue for geolocation inference either from textual or imagery content, or by exploiting tweet's meta-data information.
For the named-entity recognition task, we used the Stanford CoreNLP tool (version 3.9.1), which is the latest version at this point. However, we realised that it is less suitable for dealing with noisy social media text, and requires human intervention as a post-processing task. Therefore, there is a need for a more suitable NER model to deal specifically with noisy social media data.
One of the important problems in social media is trustworthiness – whether information shared on social media is reliable or coming from an authentic person. Towards this direction, several studies have attempted to detect trustworthiness from disaster-related tweets or credible twitter users (Mehta, Bruns, and Newton Citation2017; Halse et al. Citation2018; Pandey et al. Citation2018). We acknowledge that finding such information is important due to the fact that crisis responders need to rely on that information in order to send aid workers and supplies to a disaster location. However, we have not considered this aspect in the scope of the current study, which might be a future avenue for our research.
Among other issues, when it comes to operational crisis management, it is very important to evaluate the scalability of most of the techniques to be able to process real-time data streams. Furthermore, systems that include humans-in-the-loop for machine training need to deal with humans' limited processing capabilities to maintain high throughput. Elasticsearch can be exploited in order to deal with such problems as reported in Avvenuti et al. (Citation2018).
The proposed methodology for multimodal social media data analysis uncovers many interesting phenomena that occur during disaster events as already presented in experimental results and discussion sections. However, we did not attempt to make any causal inferences to explain these phenomena as that would require more sophisticated data collection and analysis techniques beyond the scope of the current study. Specifically, such an effort requires collection and analysis of ground truth data in the real-world setting (e.g. surveys and reports prepared by local administrations as well as humanitarian organisations), which we did not have at the time of the study. In the future, we plan to undertake a more focused study that incorporates ground truth real-world data into experimental analyses so that we can understand how the results obtained from the proposed methodology help explain different phenomena that occur during a disaster event and enable rapid disaster response.
7. Conclusion
Several computational challenges related to quantitative and qualitative research need to be addressed to enable humanitarian organisations start considering social media data for their response efforts. Among other ways in which social media information can contribute to inform humanitarian aid, ‘situational awareness’ is a core task to understand a bigger picture of an event. This work tried to answer three research questions and proposed a methodological approach which uses several computational techniques to process social media textual and imagery data to generate visual and descriptive summaries. All these proposed techniques have been extensively analysed using large-scale Twitter data from three major disasters. The mixed-method qualitative research approach was used to perform the qualitative analysis of the results obtained from the experiments. The analysis revealed several insights useful for both technical experts to improve the efficiency of computational models or build new ones as well as for humanitarian organisations to understand the complementary information that comes with the multimodal data in social media during disaster events. The data used in the experiments are made available to the research community to allow reproduction of our results and to improve of the proposed methodology. Moreover, we remark that the limitations identified in this work and the proposed future directions will help the research community establish and work on potential research areas to better help humanitarian organisations.
Acknowledgments
The authors would like to extend our sincere thanks to Hemant Purohit from the George Mason University and Kiran Zahra from the University of Zurich for helping us with the data collection task. The authors also would like to thank our anonymous reviewers and associate editors for their detailed and constructive comments.
Disclosure statement
No potential conflict of interest was reported by the authors.
ORCID
Firoj Alam http://orcid.org/0000-0001-7172-1997
Ferda Ofli http://orcid.org/0000-0003-3918-3230
Muhammad Imran http://orcid.org/0000-0001-7882-5502
Notes
5 On August 28, due to a network issue, only 9825 tweets were collected.
8 On September 26, due to a network issue, only 574 tweets were collected.
9 Silhouette value is a measure of how cohesive an object is to its own cluster compared to other clusters, i.e. separation.
11 According to Wikipedia, Deferred Action for Childhood Arrivals (DACA) is an American immigration policy that allows some individuals who were brought to the US illegally as children to receive a renewable two-year period of deferred action from deportation and become eligible for a work permit in the US.
References
- Alam, Firoj, Muhammad Imran, and Ferda Ofli. 2017. “Image4Act: Online Social Media Image Processing for Disaster Response.” In International Conference on Advances in Social Networks Analysis and Mining (ASONAM), California, USA, August 1–4.
- Alam, Firoj, Shafiq Joty, and Muhammad Imran. 2018a. “Domain Adaptation with Adversarial Training and Graph Embeddings.” In 56th Annual Meeting of the Association for Computational Linguistics (ACL), Melbourne, Australia, ACL.
- Alam, Firoj, Shafiq Joty, and Muhammad Imran. 2018b. “Graph Based Semi-supervised Learning with Convolution Neural Networks to Classify Crisis Related Tweets.” In Proceedings of International AAAI Conference on Web and Social Media (ICWSM), California, USA.
- Alam, Firoj, Bernardo Magnini, and Roberto Zanoli. 2015. “Comparing Named Entity Recognition on Transcriptions and Written Texts.” In Harmonization and Development of Resources and Tools for Italian Natural Language Processing within the PARLI Project, 71–89. Switzerland: Springer.
- Alam, Firoj, Ferda Ofli, and Muhammad Imran. 2018a. “CrisisMMD: Multimodal Twitter Datasets from Natural Disasters.” In Proc. of International AAAI Conference on Web and Social Media (ICWSM), Stanford, California, USA.
- Alam, Firoj, Ferda Ofli, and Muhammad Imran. 2018b. “Processing Social Media Images by Combining Human and Machine Computing During Crises.” International Journal of Human Computer Interaction 34 (4): 311–327. doi: 10.1080/10447318.2018.1427831
- Aupetit, Michael, and Muhammad Imran. 2017. “Interactive Monitoring of Critical Situational Information on Social Media.” In 14th International Conference on Information Systems for Crisis Response and Management (ISCRAM), Albi, France, 673–683.
- Avvenuti, Marco, Stefano Cresci, Fabio Del Vigna, Tiziano Fagni, and Maurizio Tesconi. 2018. “CrisMap: A Big Data Crisis Mapping System Based on Damage Detection and Geoparsing.” Information Systems Frontiers 20 (5): 993–1011. doi: 10.1007/s10796-018-9833-z
- Avvenuti, Marco, Stefano Cresci, Fabio Del Vigna, and Maurizio Tesconi. 2017. “On the Need of Opening Up Crowdsourced Emergency Management Systems.” AI & SOCIETY 33 (1): 55–60. doi: 10.1007/s00146-017-0709-4
- Baldwin, Timothy, Marie-Catherine de Marneffe, Bo Han, Young-Bum Kim, Alan Ritter, and Wei Xu. 2015. “Shared Tasks of the 2015 Workshop on Noisy User-generated Text: Twitter Lexical Normalization and Named Entity Recognition.” In Proceedings of the Workshop on Noisy User-generated Text, Beijing, China, 126–135.
- Beigi, Ghazaleh, Xia Hu, Ross Maciejewski, and Huan Liu. 2016. “An Overview of Sentiment Analysis in Social Media and Its Applications in Disaster Relief.” In textitSentiment analysis and ontology engineering, 313–340. Switzerland: Springer.
- Bica, Melissa, Leysia Palen, and Chris Bopp. 2017. “Visual Representations of Disaster.” In CSCW, Portland, OR, USA, 1262–1276.
- Blei, David M., Andrew Y. Ng, and Michael I. Jordan. 2003. “Latent Dirichlet Allocation.” Journal of Machine Learning Research 3 (Jan): 993–1022.
- Cambria, Erik, Soujanya Poria, Rajiv Bajpai, and Björn Schuller. 2016. “SenticNet 4: A Semantic Resource for Sentiment Analysis Based on Conceptual Primitives.” In the 26th International Conference on Computational Linguistics (COLING), Osaka, Japan.
- Caragea, Cornelia, Anna Cinzia Squicciarini, Sam Stehle, Kishore Neppalli, and Andrea H Tapia. 2014. “Mapping moods: Geo-mapped sentiment analysis during hurricane sandy.” In 11th International Conference on Information Systems for Crisis Response and Management (ISCRAM), Pennsylvania, USA, 642–651.
- Castillo, Carlos. 2016. Big Crisis Data. Cambridge: Cambridge University Press.
- Celli, Fabio, Arindam Ghosh, Firoj Alam, and Giuseppe Riccardi. 2016. “In the Mood for Sharing Contents: Emotions, Personality and Interaction Styles in the Diffusion of News.” Information Processing & Management 52 (1): 93–98. doi: 10.1016/j.ipm.2015.08.002
- Chae, Junghoon, Dennis Thom, Yun Jang, SungYe Kim, Ertl Thomas, and S. David Ebert. 2014. “Public Behavior Response Analysis in Disaster Events Utilizing Visual Analytics of Microblog Data.” Computers & Graphics 38: 51–60. http://www.sciencedirect.com/science/article/pii/S0097849313001490. doi: 10.1016/j.cag.2013.10.008
- Chen, Tao, Dongyuan Lu, Min-Yen Kan, and Peng Cui. 2013. “Understanding and Classifying Image Tweets.” In ACM International Conference on Multimedia, Barcelona, Spain, 781–784.
- Creswell, John W., and J. David Creswell. 2018. Research Design: Qualitative, Quantitative, and Mixed Methods Approaches. London: Sage Publications.
- Daly, Shannon, and J. Thom. 2016. “Mining and Classifying Image Posts on Social Media to Analyse Fires.” In 13th International Conference on Information Systems for Crisis Response and Management (ISCRAM), Rio de Janeiro, Brasil, 1–14.
- Dewan, Prateek, Anshuman Suri, Varun Bharadhwaj, Aditi Mithal, and Ponnurangam Kumaraguru. 2017. “Towards Understanding Crisis Events On Online Social Networks Through Pictures.” In Proceedings of the 2017 IEEE/ACM International Conference on Advances in Social Networks Analysis and Mining 2017, ASONAM '17, New York, NY, 439–446. ACM. http://doi.acm.org/10.1145/3110025.3110062.
- Dunteman, George H. 1989. Principal Components Analysis. London: Sage.
- Fahad, Adil, Najlaa Alshatri, Zahir Tari, Abdullah Alamri, Ibrahim Khalil, Albert Y. Zomaya, Sebti Foufou, and Abdelaziz Bouras. 2014. “A Survey of Clustering Algorithms for Big Data: Taxonomy and Empirical Analysis.” IEEE Transactions on Emerging Topics in Computing 2 (3): 267–279. doi: 10.1109/TETC.2014.2330519
- Finkel, Jenny Rose, Grenager Trond, and D. Christopher Manning. 2005. “Incorporating Non-local Information into Information Extraction Systems by Gibbs Sampling.” In ACL. The Association for Computer Linguistics, Michigan, USA.
- Gralla, Erica, Jarrod Goentzel, and Bartel Van de Walle. 2013. “Field-Based Decision Makers Information Needs.” Digital Humanitarian Network, Geneva.
- Gründer-Fahrer, Sabine, Antje Schlaf, Gregor Wiedemann, and Gerhard Heyer. 2018. “Topics and Topical Phases in German Social Media Communication During a Disaster.” Natural Language Engineering 24 (2): 221–264. doi: 10.1017/S1351324918000025
- Hagen, Loni, Thomas Keller, Stephen Neely, Nic DePaula, and Claudia Robert-Cooperman. 2017. “Crisis Communications in the Age of Social Media: A Network Analysis of Zika-Related Tweets.” Social Science Computer Review. doi:10.1177/0894439317721985.
- Halse, Shane E., Andria Tapia, Anna Squicciarini, and Cornelia Caragea. 2018. “An Emotional Step Toward Automated Trust Detection in Crisis Social Media.” Information, Communication & Society 21 (2): 288–305. doi:10.1080/1369118X.2016.1272618.
- Hartigan, John A., and Manchek A. Wong. 1979. “Algorithm AS 136: A K-means Clustering Algorithm.” Journal of the Royal Statistical Society. Series C (Applied Statistics) 28 (1): 100–108.
- He, Hangfeng, and Xu Sun. 2017. “A Unified Model for Cross-Domain and Semi-Supervised Named Entity Recognition in Chinese Social Media.” In AAAI, San Francisco, CA, USA, 3216–3222.
- Hiltz, Starr Roxanne, Jane Kushma, and Linda Plotnick. 2014. “Use of Social Media by U.S. Public Sector Emergency Managers: Barriers and Wish Lists.” In 11th International Conference on Information Systems for Crisis Response and Management (ISCRAM), May, Pennsylvania, USA, 602–611.
- Hiltz, Roxanne Starr, and Linda Plotnick. 2013. “Dealing with Information Overload when using Social Media for Emergency Management: Emerging Solutions.” In 10th International Conference on Information Systems for Crisis Response and Management (ISCRAM), Baden-Baden, Germany, 823–827.
- Hong, Liangjie, and Brian D. Davison. 2010. “Empirical Study of Topic Modeling in Twitter.” In Proceedings of the First Workshop on Social Media Analytics, Washington, DC, USA, 80–88. ACM.
- Hughes, Lee Amanda, and Leysia Palen. 2009. “Twitter Adoption and Use in Mass Convergence and Emergency Events.” International Journal of Emergency Management 6 (3–4): 248–260. doi: 10.1504/IJEM.2009.031564
- Imran, Muhammad, and Carlos Castillo. 2015. “Towards a Data-driven Approach to Identify Crisis-related Topics in Social Media Streams.” In Proceedings of the 24th International Conference on World Wide Web, Florence, Italy, 1205–1210. ACM.
- Imran, Muhammad, Carlos Castillo, Fernando Diaz, and Sarah Vieweg. 2015. “Processing Social Media Messages in Mass Emergency: A Survey.” ACM Computing Surveys 47 (4): 67. doi: 10.1145/2771588
- Imran, Muhammad, Carlos Castillo, Ji Lucas, Patrick Meier, and Sarah Vieweg. 2014. “AIDR: Artificial Intelligence for Disaster Response.” In ACM International Conference on World Wide Web, Seoul, Korea, 159–162.
- Imran, Muhammad, Prasenjit Mitra, and Carlos Castillo. 2016. “Twitter as a Lifeline: Human-annotated Twitter Corpora for NLP of Crisis-related Messages.” In Proceedings of the Tenth International Conference on Language Resources and Evaluation (LREC 2016), Paris, May. European Language Resources Association (ELRA).
- Imran, Muhammad, Prasenjit Mitra, and Jaideep Srivastava. 2016. “Cross-language Domain Adaptation for Classifying Crisis-related Short Messages.” In 13th International Conference on Information Systems for Crisis Response and Management (ISCRAM), Portorož, Slovenia.
- Khare, Prashant, Grégoire Burel, Diana Khare, and Harith Maynard. 2018. “Cross-Lingual Classification of Crisis Data.” In The Semantic Web – ISWC 2018, edited by Denny Vrandečić, Kalina Bontcheva, Mari Carmen Suárez-Figueroa, Valentina Presutti, Irene Celino, Marta Sabou, Lucie-Aimée Kaffee, and Elena Simperl, 617–633. Cham: Springer International Publishing.
- Kim, Jooho, and Makarand Hastak. 2018. “Social Network Analysis: Characteristics of Online Social Networks After a Disaster.” International Journal of Information Management 38 (1): 86–96. doi: 10.1016/j.ijinfomgt.2017.08.003
- Kryvasheyeu, Yury, Haohui Chen, Nick Obradovich, Esteban Moro, Pascal Van Hentenryck, James Fowler, and Manuel Cebrian. 2016. “Rapid Assessment of Disaster Damage Using Social Media Activity.” Science Advances 2 (3): e1500779. doi: 10.1126/sciadv.1500779
- Lagerstrom, Ryan, Yulia Arzhaeva, Piotr Szul, Oliver Obst, Robert Power, Bella Robinson, and Tomasz Bednarz. 2016. “Image Classification to Support Emergency Situation Awareness.” Frontiers in Robotics and AI 3: 54. doi: 10.3389/frobt.2016.00054
- Landwehr, Peter M, Wei Wei, Michael Kowalchuck, and Kathleen M. Carley. 2016. “Using Tweets to Support Disaster Planning, Warning and Response.” Safety Science 90: 33–47. doi: 10.1016/j.ssci.2016.04.012
- Liang, Yuan, James Caverlee, and John Mander. 2013a. “Text vs. Images: On the Viability of Social Media to Assess Earthquake Damage.” In International Conference on World Wide Web (WWW), May, Rio de Janeiro, Brazil, 1003–1006.
- Liang, Yuan, James Caverlee, and John Mander. 2013b. “Text vs. Images: On the Viability of Social Media to Assess Earthquake Damage.” In Proceedings of the 22Nd International Conference on World Wide Web, WWW '13 Companion, New York, NY, 1003–1006. ACM. http://doi.acm.org/10.1145/2487788.2488102.
- Limsopatham, Nut, and Nigel Collier. 2016. “Bidirectional LSTM for Named Entity Recognition in Twitter Messages.” In Proceedings of the 2nd Workshop on Noisy User-generated Text (WNUT), 145–152. The COLING 2016 Organizing Committee. http://aclweb.org/anthology/W16-3920.
- Lingad, John, Sarvnaz Karimi, and Jie Yin. 2013. “Location Extraction from Disaster-related Microblogs.” In Proceedings of the 22nd International Conference on World Wide Web, 1017–1020. ACM.
- Ludwig, Thomas, Christian Reuter, and Volkmar Pipek. 2015. “Social Haystack: Dynamic Quality Assessment of Citizen-generated Content During Emergencies.” ACM Transactions on Computer-Human Interaction (TOCHI) 22 (4): 17. doi: 10.1145/2749461
- Ludwig, Thomas, Christian Reuter, Tim Siebigteroth, and Volkmar Pipek. 2015. “CrowdMonitor: Mobile Crowd Sensing for Assessing Physical and Digital Activities of Citizens During Emergencies.” In Proceedings of the 33rd Annual ACM Conference on Human Factors in Computing Systems, 4083–4092. ACM.
- Manning, Christopher, Mihai Surdeanu, John Bauer, Jenny Finkel, Steven Bethard, and David McClosky. 2014a. “The Stanford CoreNLP Natural Language Processing Toolkit.” In Proceedings of 52nd Annual Meeting of the Association for Computational Linguistics: System Demonstrations, Baltimore, Maryland, 55–60.
- Manning, Christopher D., Mihai Surdeanu, John Bauer, Jenny Finkel, Steven J. Bethard, and David McClosky. 2014b. “The Stanford CoreNLP Natural Language Processing Toolkit.” In Association for Computational Linguistics (ACL) System Demonstrations, 55–60. http://www.aclweb.org/anthology/P/P14/P14-5010.
- Mehta, Amisha M., Axel Bruns, and Judith Newton. 2017. “Trust, But Verify: Social Media Models for Disaster Management.” Disasters 41 (3): 549–565. https://onlinelibrary.wiley.com/doi/abs/10.1111/disa.12218.
- Mendoza, Marcelo, Barbara Poblete, and Carlos Castillo. 2010. “Twitter Under Crisis: Can We Trust What We RT?” In Proceedings of the First Workshop on Social Media Analytics, SOMA '10, New York, NY, 71–79. ACM. http://doi.acm.org/10.1145/1964858.1964869.
- Mikolov, Tomas, Kai Chen, Greg Corrado, and Jeffrey Dean. 2013. “Efficient estimation of word representations in vector space.” arXiv preprint arXiv:1301.3781.
- Mouzannar, H., Y. Rizk, and M. Awad. 2018. “Damage Identification in Social Media Posts using Multimodal Deep Learning.” In 15th International Conference on Information Systems for Crisis Response and Management (ISCRAM), Rochester, NY, May, 529–543. ISCRAM.
- Nagy, Ahmed, and Jeannie Stamberger. 2012. “Crowd Sentiment Detection During Disasters and Crises.” In 9th International Conference on Information Systems for Crisis Response and Management (ISCRAM), Vancouver, Canada, 1–9.
- Nazer, Tahora H., Guoliang Xue, Yusheng Ji, and Huan Liu. 2017. “Intelligent Disaster Response Via Social Media Analysis A Survey.” ACM SIGKDD Explorations Newsletter 19 (1): 46–59. doi: 10.1145/3137597.3137602
- Nguyen, Dat Tien, Firoj Alam, Ferda Ofli, and Muhammad Imran. 2017b. “Automatic Image Filtering on Social Networks Using Deep Learning and Perceptual Hashing During Crises.” In 14th International Conference on Information Systems for Crisis Response and Management (ISCRAM), May, Albi, France, 499–511.
- Nguyen, Dat Tien, Kamela Ali Al Mannai, Shafiq Joty, Hassan Sajjad, Muhammad Imran, and Prasenjit Mitra. 2017a. “Robust Classification of Crisis-related Data on Social Networks using Convolutional Neural Networks.” In Eleventh International AAAI Conference on Web and Social Media (ICWSM), Montreal, Canada, 632–635.
- Nguyen, Dat Tien, Ferda Ofli, Muhammad Imran, and Prasenjit Mitra. 2017c. “Damage Assessment from Social Media Imagery Data During Disasters.” In International Conference on Advances in Social Networks Analysis and Mining (ASONAM), Sydney, Australia, August 1–8.
- Onorati, Teresa, Paloma Díaz, and Belen Carrion. 2018. “From Social Networks to Emergency Operation Centers: A Semantic Visualization Approach.” Future Generation Computer Systems 95: 829–840. doi: 10.1016/j.future.2018.01.052
- Paltoglou, Georgios, and Mike Thelwall. 2010. “A Study of Information Retrieval Weighting Schemes for Sentiment Analysis.” In Proceedings of the 48th ACL, Uppsala, Sweden, 1386–1395. ACL.
- Pandey, Rahul, Hemant Purohit, Jennifer Chan, and Aditya Johri. 2018. “AI for Trustworthiness! Credible User Identification on Social Web for Disaster Response Agencies.” CoRR abs/1810.01013. http://arxiv.org/abs/1810.01013.
- Pang, Bo, and Lillian Lee. 2008. “Opinion Mining and Sentiment Analysis.” Foundations and Trends Ⓡ in Information Retrieval 2 (1–2): 1–135.
- Pang, Bo, Lillian Lee, and Shivakumar Vaithyanathan. 2002. “Thumbs up?: Sentiment Classification using Machine Learning Techniques.” In Proceedings of the ACL-02 Conference on Empirical Methods in Natural Language Processing-Volume 10, 79–86. Association for Computational Linguistics, Philadelphia, USA.
- Peters, Robin, and Joao Porto de Albuquerque. 2015. “Investigating Images as Indicators for Relevant Social Media Messages in Disaster Management.” In 12th International Conference on Information Systems for Crisis Response and Management (ISCRAM), Krystiansand, Norway.
- Pohl, Daniela, Abdelhamid Bouchachia, and Hermann Hellwagner. 2015. “Social Media for Crisis Management: Clustering Approaches for Sub-event Detection.” Multimedia Tools and Applications 74 (11): 3901–3932. doi: 10.1007/s11042-013-1804-2
- Purohit, Hemant, Andrew Hampton, Shreyansh Bhatt, Valerie L. Shalin, Amit P. Sheth, and John M. Flach. 2014. “Identifying Seekers and Suppliers in Social Media Communities to Support Crisis Coordination.” Computer Supported Cooperative Work (CSCW) 23 (4–6): 513–545. doi: 10.1007/s10606-014-9209-y
- Ragini, J. R., and P. M. R. Anand. 2016. “An Empirical Analysis and Classification of Crisis Related Tweets.” In 2016 IEEE International Conference on Computational Intelligence and Computing Research (ICCIC), Chennai, India, December 1–4
- Resch, Bernd, Florian Usländer, and Clemens Havas. 2018. “Combining Machine-learning Topic Models and Spatiotemporal Analysis of Social Media Data for Disaster Footprint and Damage Assessment.” Cartography and Geographic Information Science 45 (4): 362–376. doi: 10.1080/15230406.2017.1356242
- Reuter, Christian, and Marc-André Kaufhold. 2018. “Fifteen Years of Social Media in Emergencies: A Retrospective Review and Future Directions for Crisis Informatics.” Journal of Contingencies and Crisis Management 26 (1): 41–57. doi: 10.1111/1468-5973.12196
- Reuter, Christian, Thomas Ludwig, Marc-André Kaufhold, and Volkmar Pipek. 2015. “XHELP: Design of a Cross-platform Social-media Application to Support Volunteer Moderators in Disasters.” In ACM Conference on Human Factors in Computing Systems, Seoul, Republic of Korea, 4093–4102.
- Reuter, Christian, Thomas Ludwig, Marc-André Kaufhold, and Thomas Spielhofer. 2016. “Emergency Services Attitudes Towards Social Media: A Quantitative and Qualitative Survey Across Europe.” International Journal of Human-Computer Studies 95: 96–111. doi: 10.1016/j.ijhcs.2016.03.005
- Rosenthal, Sara, Noura Farra, and Preslav Nakov. 2017. “SemEval-2017 Task 4: Sentiment Analysis in Twitter.” In Proceedings of the 11th International Workshop on Semantic Evaluation (SemEval-2017), Vancouver, Canada, 502–518.
- Rousseeuw, Peter J. 1987. “Silhouettes: A Graphical Aid to the Interpretation and Validation of Cluster Analysis.” Journal of Computational and Applied Mathematics 20: 53–65. doi: 10.1016/0377-0427(87)90125-7
- Rudra, Koustav, Siddhartha Banerjee, Niloy Ganguly, Pawan Goyal, Muhammad Imran, and Prasenjit Mitra. 2016. “Summarizing Situational Tweets in Crisis Scenario.” In ACM Conference on Hypertext and Social Media, 137–147.
- Sievert, Carson, and Kenneth Shirley. 2014. “LDAvis: A Method for Visualizing and Interpreting Topics.” In Proceedings of the Workshop on Interactive Language Learning, Visualization, and Interfaces, Baltimore, Maryland, USA, 63–70.
- Socher, Richard, Alex Perelygin, Jean Wu, Jason Chuang, Christopher D. Manning, Andrew Ng, and Christopher Potts. 2013. “Recursive Deep Models for Semantic Compositionality Over a Sentiment Treebank.” In Proceedings of the 2013 Conference on Empirical Methods in Natural Language Processing, Seattle, Washington, USA, 1631–1642.
- Soden, Robert, and Leysia Palen. 2018. “Informating Crisis: Expanding Critical Perspectives in Crisis Informatics.” Proceedings of the ACM on Human-Computer Interaction 2 (CSCW): 162.
- Starbird, Kate, Leysia Palen, Amanda L. Hughes, and Sarah Vieweg. 2010. “Chatter on the Red: What Hazards Threat Reveals About the Social Life of Microblogged Information.” In ACM Conference on Computer Supported Cooperative Work, Savannah, Georgia, USA, 241–250.
- Stieglitz, Stefan, Deborah Bunker, Milad Mirbabaie, and Christian Ehnis. 2018a. “Sense-making in Social Media During Extreme Events.” Journal of Contingencies and Crisis Management 26 (1): 4–15. doi: 10.1111/1468-5973.12193
- Stieglitz, Stefan, Milad Mirbabaie, Jennifer Fromm, and Stefanie Melzer. 2018b. “The Adoption of Social Media Analytics for Crisis Management-Challenges and Opportunities.” In Proceedings of the 26th European Conference on Information Systems (ECIS), Portsmouth, UK.
- Stieglitz, Stefan, Milad Mirbabaie, and Maximilian Milde. 2018. “Social Positions and Collective Sense-Making in Crisis Communication.” International Journal of Human–Computer Interaction 34 (4): 328–355. doi: 10.1080/10447318.2018.1427830
- Stieglitz, Stefan, Milad Mirbabaie, Björn Ross, and Christoph Neuberger. 2018c. “Social Media Analytics–Challenges in Topic Discovery, Collection Data, and Preparation Data.” International Journal of Information Management 39: 156–168. doi: 10.1016/j.ijinfomgt.2017.12.002
- Terpstra, Teun, A. De Vries, R. Stronkman, and G. L. Paradies. 2012. Towards a Realtime Twitter Analysis During Crises for Operational Crisis Management. Burnaby: Simon Fraser UniversityBurnaby.
- Tsou, Ming-Hsiang, Chin-Te Jung, Christopher Allen, Jiue-An Yang, Su Yeon Han, Brian H. Spitzberg, and Jessica Dozier. 2017. “Building a Real-Time Geo-Targeted Event Observation (Geo) Viewer for Disaster Management and Situation Awareness.” In International Cartographic Conference, 85–98. Springer.
- Vieweg, Sarah. 2012. “Situational Awareness in Mass Emergency: A Behavioral and Linguistic Analysis of Microblogged Communications.” PhD diss., University of Colorado at Boulder.
- Vieweg, Sarah, Carlos Castillo, and Muhammad Imran. 2014. “Integrating Social Media Communications into the Rapid Assessment of Sudden Onset Disasters.” In International Conference on Social Informatics, 444–461. Cham: Springer.
- Vieweg, Sarah, Amanda L Hughes, Kate Starbird, and Leysia Palen. 2010. “Microblogging During Two Natural Hazards Events: What Twitter May Contribute to Situational Awareness.” In Proceedings of the SIGCHI Conference on Human Factors in Computing Systems, Atlanta, Georgia, USA, 1079–1088. ACM.
- Wobbrock, Jacob O., and Julie A. Kientz. 2016. “Research Contributions in Human-computer Interaction.” Interactions 23 (3): 38–44. http://doi.acm.org/10.1145/2907069.
- Xu, Dongkuan, and Yingjie Tian. 2015. “A Comprehensive Survey of Clustering Algorithms.” Annals of Data Science 2 (2): 165–193. doi: 10.1007/s40745-015-0040-1
- Yang, Shuang-Hong, Alek Kolcz, Andy Schlaikjer, and Pankaj Gupta. 2014. “Large-scale High-precision Topic Modeling on Twitter.” In Proceedings of the 20th ACM SIGKDD International Conference on Knowledge Discovery and Data Mining, New York, NY, USA, 1907–1916. ACM
- Yin, Robert K. 2017. Case Study Research and Applications: Design and Methods. London: Sage Publications.
- Yin, Jie, Sarvnaz Karimi, Andrew Lampert, Mark Cameron, Bella Robinson, and Robert Power. 2015. “Using Social Media to Enhance Emergency Situation Awareness.” In Twenty-Fourth International Joint Conference on Artificial Intelligence, Buenos Aires, Argentina.
- Zade, Himanshu, Kushal Shah, Vaibhavi Rangarajan, Priyanka Kshirsagar, Muhammad Imran, and Kate Starbird. 2018. “From Situational Awareness to Actionability: Towards Improving the Utility of Social Media Data for Crisis Response.” Proceedings of the ACM on Human-Computer Interaction 2 (CSCW): 195. doi: 10.1145/3274464