
 ?Mathematical formulae have been encoded as MathML and are displayed in this HTML version using MathJax in order to improve their display. Uncheck the box to turn MathJax off. This feature requires Javascript. Click on a formula to zoom.
ABSTRACT
To date, many efforts have been made to explore how to support driver's decision-making process with advisory information. Previous studies mainly focus on a single modality, e.g. the visual, auditory or haptic modality. In contrast, this study compares data from two simulator studies with 50 participants in total, where the visual vs. the auditory modality was used to present the same type of advisory traffic information under the same driving scenarios. Hereby we compare the effect of these two modalities on drivers' responses and driving performance. Our findings indicate that modality influences the drivers' behaviour patterns significantly. Visual information helps drivers to drive more accurately and efficiently, whereas auditory information supports quicker responses. This suggests that there are potential benefits in applying both modalities in tandem, as they complement each other. Correspondingly, we present several design recommendations on Advisory Traffic Information Systems.
1. Introduction
With the development of automated driving technology and in particular Advanced Driver Assistance Systems (ADAS), human-machine interaction design for in-vehicle information system has evolved from what it is used to be in earlier decades (Bengler et al. Citation2014). From a design point of view, early ADAS mainly focused on warnings, aiming to present only the most critical information. That information usually communicated in a clear way to support rapid decision making on an operational level in an emergent situation.
As the field has matured, the main function of ADAS is gradually shifting from warning drivers towards supporting them with situational information instead, trying to avoid crises. In this paper, this particular form of ADAS is defined as Advisory Traffic Information Systems (ATIS). Such systems support decision making at an earlier stage, i.e. on the tactical level, as compared to the one on the operational level (immediate crisis-response). An ATIS thus provides feed-forward information, therefore gives drivers enough time to make an informed decision before making any manoeuvres. One of current industrial examples is Tesla Autopilot's user interface in the instrument cluster. It continuously provides information on surrounding road users' location in relation to the driver's car to help human drivers to have a mental model of what the car sees. This is a typical example to provide situational information to support the driver’s decision making in the situations of taking over.
Any ATIS must be highly usable to get users to accept it, where the key factor is to guarantee drivers' capability to successfully process and comprehend the information provided by ATIS and react upon it in time. Hence, it is important to understand drivers' needs and limitations in accordance with different driving scenarios, and then design the displays which present ATIS information safely and efficiently.
However, it is not given how ATISinformation should best be conveyed. In the driving context, displaying information visually hasboth advantages and disadvantages (Wickens and Liu Citation1988; Wickens et al. Citation2011). As driving is inherently an activity based on observing the environment, any additional visual warnings or information share the same cognitive resource as the driving task, which increases the risk of attention overload, especially in critical situations (Wickens et al. Citation2015). Using alternative modalities (e.g. auditory or haptic) to support drivers' attention and present driving-related information during a normal drive is a potential solution, and as will be shown in Related work, researchers are definitely looking into this. Many studies have been carried out to explore how to design various informative systems using for instance sounds, lights or visual displays as carriers of the information. This paper is novel in the sense that it presents a study where an audio-based system has been compared with a screen-based system under the same simulated traffic conditions, in this aiming to understand how drivers utilise different modalities for driving safety.
1.1. Related work
As for the visual modality, most previous studies focus on how that can be utilised in combination with advisory information since the general principles for designing visual information are well-known (see e.g. Tufte Citation1991; Ware Citation2012; Spence Citation2014).
Lindgren et al. compared the integrated advisory warning information display with a display providing only critical warnings (Lindgren et al. Citation2009). The results show that drivers keep a longer and thus safer distance to cars in front of them when given advisory information rather than critical warnings only. In another study by Stanton et al., standard brake light displays are compared with a graded deceleration display expressing how hard the driver in front is braking (Stanton et al. Citation2011). The results show that the graded system produces more accurate responses during deceleration from the driver behind than the standard brake light display does. Addressing warning timing issues, Naujoks and Neukum have carried out a series of studies that explored the effectiveness of advisory information in different timing scales and information specificity (Naujoks and Neukum Citation2014; Seeliger et al. Citation2014). The general findings suggest that early visual warning information has more positive effects on driving performance than late visual warnings when surprising situations occur. A more recent study by Winkler et al presents a driving simulator study of how drivers react upon a two warning stages system (warning and acute warning) in a head-up display (Winkler, Kazazi, and Vollrath Citation2016). The system has been tested in a collision avoidance scenario in typical urban areas. The results show that the drivers understand and react appropriately to the warning, as they hit the brake pedal less often but in most cases sufficiently, in order to de-escalate the situation and prevent an acute warning.
Regarding auditory information, recent research shows that this type of information can improve the safety of driving, shorten response times, and enhance manoeuvre accuracy. Studies indicate that auditory looming can capture human attention by providing very powerful signals to the human perceptual system. The sounds increase in intensity with the decrease of the distance between the driver's vehicle and the lead vehicle (Leo et al. Citation2011). A comparative study has been conducted by Gray, where participants experience four non-looming auditory warnings as well as three looming auditory warnings. The results show that looming auditory warnings is an optimal choice in both response speed and accuracy (Gray Citation2011). Most previous studies focus on rear-end collision scenarios, while the use of looming auditory cues under non-critical traffic scenarios is not clear.
Fagerlönn and Alm have examined the role of auditory signs as a means to support truck drivers' situation awareness. In that study, the participants were asked to memorise auditory signs and their corresponding road users. Then, giving the sounds as cues, their ability to remember the auditory signs was tested. Results show that it took a long time to learn abstract sounds (earcons) in comparison with representative sounds (auditory icons) (Alm and Fagerlönn Citation2009). However, in that study, participants were asked to recall the road users and situation, which is very different from a real traffic scenario.
Baillie et al. have conducted a driving simulation study where five auditory feedback methods are compared under autonomous and manual driving scenarios (Beattie et al. Citation2014). The results show that the spacial auditory presentation method is superior to other presentation methods. Moreover, drivers feel significantly safer in the presence of sound than in the absence of the sound (Beattie et al. Citation2014).
A number of interesting studies from Beattie et al. show that earcon is an effective alternative to present information related to the primary driving task compared to auditory icons and speech in automated vehicles. In their study, the driver's subjective evaluation highlights a natural mapping that should be applied between sound parameters and primary driving events. For instance, artificial acceleration, braking, and gear changing sounds should be modulated primarily by pitch and timbre to ensure the familiarity with existing vehicle sounds is preserved (Beattie, Baillie, and Halvey Citation2015). In a later study from Beattie et al., they tested a concept of using three-dimensional spatial earcons to present automated vehicle tasks to enhance driver awareness of the actions of the automated vehicle. They demonstrate that spatial earcons provide similar levels of usability compared to existing vehicle sounds. However, the driver's subjective responses highlight that participants have some reservations about using spatial earcons over existing vehicle sounds in their own vehicle today. For instance, one of their participants mentioned feeling more comfortable with the vehicle's own mechanical sounds instead (Beattie, Baillie, and Halvey Citation2017).
Liu and Jhuang (Citation2012) have carried out a driving simulation study to evaluate the effects of five in-vehicle warning information displays. Unlike the aforementioned studies, their study did contain different modalities like ours. They tested five displays – one visual display, two auditory displays with static and spacialised sound respectively, and two audiovisual (hybrid) displays with static and specialised sound respectively. The results show that best performance results are obtained for the audiovisual display using spatial sounds. However, unlike the present study – the task studied is a lane keeping task, and without involving any interactions with other road users or critical events.
Another highly relevant study conducted by J J Scott and Robert Gray has compared driver's response time and performance against tactile rear-end collision warning with auditory and visual rear-end collision warnings (Scott and Gray Citation2008). The results illustrate that driver's response time and performance is better with an early warning (Time to Collision = 5 seconds) than a late warning (TTC = 3 seconds). In addition, the findings show that tactile warnings are better in helping drivers to prepare for, and conduct, braking responses, in comparison with how visual or auditory warning does. However, in this only rear-end collision scenarios and warning information are taken into account.
To sum up, the previous research indicates that the concept of providing early information or advisory information, as opposed to warnings only, is a promising approach to increase driving safety and comfort, and that looming spatial sounds seem to be the most effective. The key issue in most previous studies has been to evaluate drivers' response to displays, as opposed to studying how the information is used as a basis for decision making when interacting with various road users. Tested traffic scenarios in previous studies only involve single road user, lane keeping tasks, and rear-end collision situations, i.e. they are quite far from reconstructing a more realistic driving situation. Therefore, the understanding of how different modalities influence drivers' decision-making and performance when interacting with various road users remains to be explored further – as in this study.
1.2. Background: our previous work
The present study is a part of a larger research project which aims to explore the design of advisory traffic information systems in cars. In all, the project has encompassed six years and nine different studies, of which this is the last.
The findings in this paper proceed in several steps. First came a study to understand and identify typical driving scenarios where ATISs would be useful. Over 100 hours of naturalistic driving videos were observed, and some traffic scenario videos were identified as being representative of different types of situations. Those identified traffic scenarios were further applied as design materials concerning storyboards, design scenarios, and test scenarios, throughout the research process.
After identifying typical traffic scenarios, we conducted studies on design requirements elicitation (Chen et al. Citation2014; Wang, Lyckvi, and Chen Citation2016b). The results showed that users were positive to the concept of advisory information systems in general, and gave a quite detailed insight in which situations they felt that they needed advisory information. The outcome was a list of design recommendations in regards to information prioritisation, road user categorisation, which areas around the car were the most relevant etc.
Based on the above results, one visual and one auditory ATIS prototype were developed. To assess these designs regarding how well they assist the drivers, both prototypes have been evaluated in a driving simulator in separate studies (Wang, Lyckvi, and Chen Citation2016a; Wang et al. Citation2017). Lastly, these two ATISs – the visual and the auditory one – are now being compared in this paper.
1.3. Research aim
In this study, we attempt to answer the following research question:
How do different modalities of an Advisory Traffic Information System influence driver reaction patterns in terms of driving performance measures under typical driving scenarios?
2. Method
To address the proposed research question, the present study adopted a full factorial experiment design with non-repeated-measure for each combination of modality, treatment, and traffic incident scenario. Specifically, the experiment settings had modality (visual / auditory), treatment conditions (baseline driving without ATIS / with ATIS), and traffic incident scenarios as independent variables. It was first carried out with a visual ATIS and thereafter with an auditory ATIS, using the same technical settings and driving scenarios. The order of different conditions was counterbalanced between participants. The dependent variables are a series of statistics that quantify the driving safety from driving performance perspective.
2.1. The study in summary
In this study, we developed two prototypes of an advisory information system. Both aimed to provide relevant advisory information regarding road users in the vicinity of the own vehicle.
One of the systems was entirely sound-based, featuring 3D-sounds indicating direction, movement and a change in pitch and rhythm to indicate closeness. The second one was entirely visual, residing on a 7-inch screen mounted on the equivalent to the centre stack.
The study was based on a simulator study, run in two separate stints; once for the visual ATIS, once for the sound-based ATIS. To prevent learning effects, we did not let the same participants test both ATIS.
Participants came in one by one, making two drives, one without any informative system, one with the ATIS, in a randomized order. The drives featured several different scenarios (to avoid learning effects) of which three were used in this study, again in randomised order. During the drives, driving performance data was collected. Finally, the participants' opinions on the system were collected in a post-interview.
2.2. Participants
In all, there were 52 participants taking part, 22 for the visual ATIS and 30 for the auditory ATIS, as displayed in . Due to some technical issues as well as simulator sickness, data from two participants were not included in the data analysis. The actual number of studied participants is 50 in total.
Table 1. Participants in the study by modality, age, gender, and driving experience.
The participants were recruited in the same way for both experiments. The recruitment ads were posted in two very similar areas – science parks in urban areas. The criteria of participants selections were white-collar professions with education background above bachelor level. This choice was deliberate since we wanted drivers from the segment of people whose income allows for buying a new car equipped with ADAS features – they were, in short, the core group of premium car potential buyers. In addition, all the participants were required to have over 4 years and 1000 miles of driving experience. The reason behind was to ensure all the participants have certain driving experience and skills of risk anticipation. Studies from Kinnear et al. suggest that after having driven 1000 miles a person's skill of foreseeing potential hazards is on par with more experienced drivers (Kinnear et al. Citation2013). Despite the different numbers of two modalities' experiments, they are all within the group of potential users of the ATIS.
2.3. The two prototypes
As described in the Background, both of our ATISs had been designed as a result of previous studies (Chen et al. Citation2014). The aim of both were to provide relevant advisory information regarding road users in the vicinity of their own vehicle.
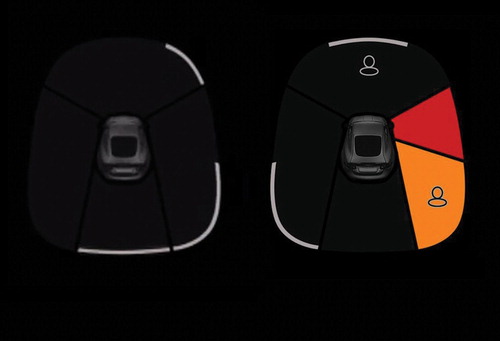
The Visual ATIS VATIS
– see – is dividing the area around the car into eight zones, using icons and colours to convey information. The colours (on a scale from white outline via orange field to red field) indicate the proximity of the other road user(s), red being the closest. In addition, pedestrians and cyclists are further indicated with an icon, since these two categories are especially vulnerable in traffic. The prototype was developed in Matlab and displayed on a 7-inch LED display.
Figure 1. ATIS interface. To the left, three road users are at a distance (represented by the white lines) behind, to the back right and front right of the car. To the right, there is a pedestrian at a distance in front of the car, and another quite close in the right back blind spot. Some sort of vehicle is very close to the car's right side.
The 3D Auditory ATIS (3DAATIS) utilises spatial sound to present in which direction the road users move and what risk level they are at. So, if a car comes up from rear and takes over, there is a sound – earcon ‘coming’ from the back and ‘moving’ closer, ‘passing’ on the left side as the approaching car is overtaking, here using a simulated Doppler effect. Changes in pitch and rhythm are used to communicate urgency. It is just one earcon being looped, and if no cars are close enough to trigger the informative level, it is quiet. The selected earcon was designed by a professional acousticist from a Swedish automotive OEM, several iterations and evaluations were carried out to secure the quality and driver's acceptance of the earcon. The details of the earcon and sound system design were described in one of earlier papers (Wang et al. Citation2017).
This prototype was developed using a combination of the data flow programming environment Pure Data and Matlab. The latter was used to receive simulator data and send direction, distance, and time-to-collision data to the Pure Data patch, which in turn generated the relevant sounds (i.e. warning or advisory) and projected them in a 5.1-channel surround sound system. Sound directionality was achieved through equal energy-panning between speaker pairs. The 3DAATIS information was presented at 65 dB with a traffic ambient noise at 45 dB in the background. Sound-absorbing curtains were installed on three sides of the test area to ensure a good surround sound effect.
2.4. Information levels and their activation
The activation of the different information levels is based on two different factors, depending on the position of the object indicated. If the object is in the same lane as the driver, the calculation is based on time to collision (TTC). If the object instead is in an adjacent lane, the calculation is based on distance to collision. This compromise was made due to the limitation of the simulator output. The thresholds had been tested in our previous studies; this was necessary since the perception of distance is different when driving in a real car vs. in the simulator, and thus we adapted the thresholds accordingly (Marshall and Wang Citation2012; Wang et al. Citation2017). The two systems responded as shown in .
Table 2. Thresholds of warnings in terms of time to collision (seconds) or safety margin (meters).
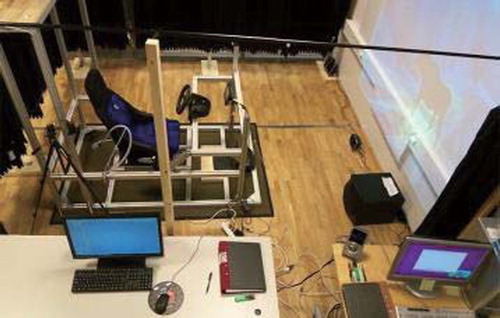
2.5. System setup
The two ATISs were tested in a PC running STISIM Drive® software, which was used as driving simulator (see ). A HD projector was used to project the simulated drive scenarios on the front wall. Two webcams were installed to record what the drivers saw on the road, as well as their reactions to the incidents, e.g. steering and braking. This video data was synchronised with drivers' simulation data to better identify the starting point of drivers' reactions to the incidents. A Logitech G25 Racing Wheel, which included gas and brake pedals and a gearbox was installed in front of an actual car seat, and this equipment was further used to measure drivers' responses.
Figure 2. Driving simulator setup (Wang, Lyckvi, and Chen Citation2016a).
2.6. The traffic incidents scenarios studied
In order to test incident scenarios that represent real traffic situations, we turned back to our initial study of naturalistic drive scenarios and chose three that represent common critical traffic situations. See . Together, the scenarios covered several important aspects as follows: featuring different types of road users; having one vs. several other road users being involved in the situation; and encompassing different critical levels of driving scenarios.
Figure 3. Traffic incidents scenarios.
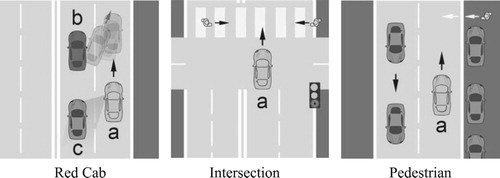
Besides the three test scenarios, another 5–6 traffic scenarios were added to the simulator driving environment to reduce the learning effects. In order to minimise the carry-over effects from first to the second scenario, there was an ‘empty’ period, the participants drove on a straight road without any traffic events for 2–3 minutes. The order of the scenarios and the physical environments, e.g. buildings, trees, and the brands of the event cars were randomised for each new test drive. Below we will describe the scenarios we studied. Note: The car (a) represents the driver's car in all scenarios.
2.6.1. Red cab
Here, two slow cars (b and c) drive in the left lane. Car b suddenly cuts into the driver's lane very fast directly in front of the driver's car (Car a). At this moment, the other car (c) is in the blind spot of Car a. In this scenario, the considered safe approach is to slow down in order to avoid an accident.
2.6.2. Intersection
Here, the driver (in Car a), has a green light. However, two pedestrians start crossing the street right in front of the driver anyway. One pedestrian is walking from right to left quite slowly, whereas the other is walking from left to right relatively fast. Of these two, the faster one starts walking first, and is partly hidden in the A pillar blind spot, whereas the slower one starts later. In this scenario, the considered safe behaviour is to brake and wait for the pedestrians to pass.
2.6.3. Pedestrian
Here, a single lane in a residential area, a pedestrian suddenly walks out between the cars on the right side of the road. The driver (in Car a) has a visual disadvantage in this scenario; visual contact (through the windscreen) with the pedestrian is made at a very short distance. Here, the safest possible way to avoid the accident is to brake in advance.
2.7. Overall procedure
First, the participant was introduced to the study and filled out a demographic questionnaire on driving experience etc. Thereafter, the participant was given instructions regarding the test drives. The researchers explained the purpose and the procedure of the experiment in general and instructed drivers to keep the speed limits, follow traffic regulations, and stay in the right lane if possible. For the auditory ATIS, a hearing capability questionnaire was handed out to the participants in order to ensure that all participants' had normal hearing abilities.
After getting some instructions on how to drive in the simulator, each subject could train as much as they wanted, and the test did not start until they fully understood the functions of the ATIS and could control the driver simulator. Each subject drove twice, once with the ATIS and once without, in random order. Similarly, the order of the events that occurred in each test drive, was randomised for each new drive.
After the test, a questionnaire and interview were held to collect participants' subjective feedback on the design. Afterwards, participants were rewarded with two movie tickets.
3. Data description
In this study, there are two independent variables; scenario (three levels) and modality (visual, auditory), yielding six conditions. For each condition, the driving status includes baseline driving without the system and design driving with the system. Driver reaction pattern to ATIS is characterised by a set of driving performance measures, using the within-subject difference between design driving and baseline driving.
3.1. Measures of driver reaction pattern to ATIS
As listed below, the applied measures include one categorical measure, collision indicator (0 or 1) and four continuous measures to quantify driving performance. Based on the individual time series of velocity (m/s) and lateral position (m), those four driving performance measures are calculated. The measures are defined as follows:
Collision indicator. Whether a participant manages a scenario without a collision. 0 = Yes, 1 = No.
Time to collision (TTC, s). The remaining time to a (potential) collision if the driver does not react (e.g. brake, release gas pedal or steer away). This measure represents driver's safety awareness regarding the situations.
The speed of the subject vehicle reflects drivers' speed control behaviours. This is expressed as average speed of the whole event (
, m/s).
Braking behaviour reflects how the drivers use the brake pedal to adjust speed. This is expressed as the proportion of accumulated brake-time to the whole event time (
Steering behaviour reflects how drivers operate steering wheel. It is expressed as the standard deviation of lateral position (SDLP, m) which quantifies the driver's lane keeping performance.
In summary, driver's longitudinal control performance is represented by Time to collision (TTC, s), average speed (, m/s), and the proportion of accumulated brake-time to the whole event time (
, %). While the lateral control performance is quantified by the standard deviation of lateral position (SDLP, m).
In order to explore the effect of design modality on driver reaction pattern and minimise the effect of individual difference, all the four continuous measures are processed as paired data. For participant i, a measure for baseline driving under a driving scenario s is (s is in [Red Cab, Intersection, Pedestrian]). Same measure of a specific ATIS under the same scenario is indicated by
where m denotes modality, which could be visual (V) or auditory (A). Since the only difference is modality guaranteed by the experiment design, the difference between d and
, represents driver reaction patterns which are used to further explore the modality effect of related ATIS.
For each measure, if the baseline driving or the ATIS driving data point is missing, that participant's samples would be removed from the analysis. Therefore, as a function of scenario and modality, the number of samples fed into the statistical analysis is 120 for TTC and 132 for , SDLP, and
.
3.2. Data analysis method
For the collision indicator (the categorical independent variable), a Chi-square test is applied to test whether an ATIS of a certain modality has a significant impact on the collisions related to the respective driving scenarios. In other words, the research question that the Chi-square test is supposed to answer: After using ATIS, is there a significant difference between the change of collision number of visual modality and the one of audio modality?
For the four continuous measures, a simple effect test is applied since there are significant interaction effects between modality and scenario. For the distribution of the value difference between baseline driving and ATIS driving of a modality within each scenario, a normal distribution test is first applied to see whether it would be suitable to use parametric analysis method. If one measure sample set follows a normal distribution, a Single T-test is then adopted to see whether it has a mean value of zero, i.e. whether the modality of the ATIS has a significant impact on the value change. Otherwise, Wilcoxon rank sum test is applied as a related non-parametric method.
4. Results
In this section, we first analyse the relationship between modalities and the corresponding changes in collision rate. Then we look into each driving scenario, to elaborate on how different driver reaction patterns manifest between ATIS of different modalities. At last, to gain some insights into the consistency of modality effects across three scenarios, driver reaction patterns to ATIS modalities are analysed as a function of scenario, using simple effect test within each modality.
4.1. The impacts of modality on driver reaction patterns per scenario
Due to the small sample size, we only found a significant reduced collision number in the Pedestrian scenario with the auditory ATIS (, df=1). The sample size is not big enough to answer the above question with large certainty especially given the collision event is not common in the experiment and the real world. But we do find a tendency here. The presence of an ATIS (regardless of modality) decreases the number of collisions (Visual,
; Auditory,
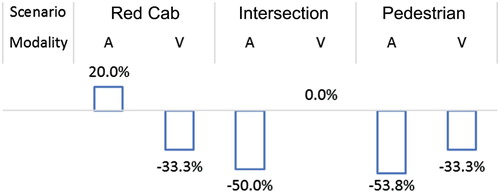
). What is more interesting is that depending on the scenario, the modality has different impacts on the collision rate (see ). In Red Cab-scenario, the visual ATIS was more likely to reduce the collision number whereas the auditory ATIS displayed a tendency to increase the collision rate. In contrast, the auditory ATIS displayed a stronger tendency to help the drivers avoid a collision in the two scenarios Intersection and Pedestrian.
Figure 4. The change of collision number percentage by applying ATIS of two modalities.
Regarding the driving performance across the three scenarios, and show the value change of the measures (ATIS of a modality driving minus baseline driving). provides an illustration of how drivers react to the modality use for ATIS compared to the baseline driving; it is a visualisation of the data presented in . Star marks represent the results from Single T-test/Wilcoxon rank sum test, indicating the significance level of the value change imposed by applying ATIS during driving compared to baseline driving, i.e. whether a certain driving performance measure changes significantly when affected by an ATIS of visual or auditory modality. The mean value above zero (dotted line) means that a measure increases when applying ATIS of a certain modality design. For different measures, the change direction imposed by ATIS are elaborated below considering scenarios and system settings.
Figure 5. The change of measures value by applying ATIS of different modalities. Error bar indicates one standard deviation (, to illustrate the significance value of measure change affected by ATIS).
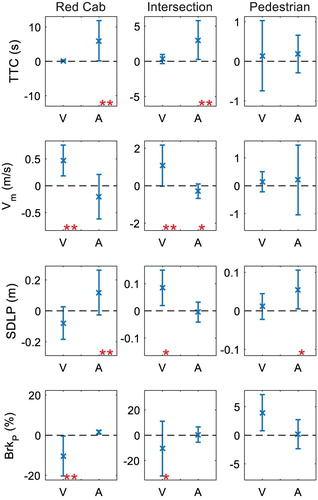
Table 3. Driver reaction patterns of different modalities (results from Single T-test/Wilcoxon rank sum test, ).
Red Cab. The visual ATIS decreases the percent of braking time () and consequently increases the average speed throughout the event (
). At the same time, there are no significant changes in how soon driver reacts (TTC) or lane keeping performance (SDLP). These imply that the visual ATIS helps drivers to drive in a more stable way.
Interestingly, the reactions to the auditory ATIS are to the opposite in Red Cab-scenario. Drivers react much faster (TTC), but at the same time their lateral control performance decreases (SDLP), i.e. they steer in a more abrupt manner. In short, the auditory ATIS serves better to engage participants in an immediate response in comparison with the visual ATIS.
Intersection. Like in Red Cab, the visual ATIS helps participants to significantly improve their driving efficiency in terms of increased average speed () and less braking (
). However, the lateral control decreases at the same time (SDLP), which is an unintended effect.
The auditory ATIS on the other hand, leads to a faster reaction (increased TTC) and increased lateral control performance (SDLP). It means that the auditory ATIS makes the whole driving event becomes safer and more conservative.
Pedestrian. In this scenario, we could not find any significant effects of the visual ATIS. As for the auditory ATIS, the lateral control increased significantly (SDLP). In this particular situation, that can be considered beneficial, as we have a pedestrian coming out from a hidden spot between two cars, and the most efficient way to avoid a collision is to steer away. It is probably due to this quick reaction that the auditory ATIS reduced the number of collisions in this particular scenario.
4.2. Consistency of modality effect on driver reaction patterns
The effect of the modality varied between the different scenarios as shown in . The visual modality consistently presents no significant impact on the time-to-collision (TTC) in all the scenarios. Further, the effect of visual modality on average speed () and braking (
) is scenario-dependent; in both Red Cab-scenario and the Intersection-scenario, the effect of visual modality is characterised by increased speed and consequently and decreased amount of braking. On the contrary, the auditory modality is highly scenario-dependent regarding its effect on the time-to-collision (TTC); we observe an increased TTC in Red Cab-scenario and Intersection-scenario, and no significant impact in Pedestrian-scenario. The effect of the auditory modality on the lateral control (SDLP) also depends on the scenario; both Red Cab and Pedestrian-scenarios have more abrupt lateral control performance (increased SDLP). As for the effect of auditory modality on average speed (
) and braking (
), it is scenario-independent displaying almost no significant change.
Table 4. Modality effect on the driver reaction patterns as a function of scenario (results from Simple effect test), ).
Despite the scenario dependence of the modality effects on the driver reaction patterns, we can see that if there exists a significant modality effect observed in a couple of scenarios, they are consistent with each other. From that point of view, the revealed modality effects on the driver reaction patterns have relatively high consistency.
5. Discussion and design implication
In the present study, we explore the different driver response patterns to visual vs. auditory information in ATIS under three typical driving scenarios. The driver response is measured from collision number, longitudinal control performance (TTC, ,
), and lateral control performance (SDLP). The time-to-collision (TTC) and the collision number represent the Safety aspect whereas average speed (
) and braking (
) together describe the longitudinal driving smoothness, i.e. driving Efficiency. The lateral control (i.e. lane control performance) is described by the SDLP value. The higher the SDLP becomes, the more abrupt the lateral control performance, i.e. the more risk departing from the current lane. summarises the results of modality effects based on which we discuss the modality effect in terms of safety and efficiency and compare them in the three scenarios. At last, we present some design recommendations corresponding to the discussions.
Table 5. A summary of modality effects on the driver reaction patterns across all scenarios (+ indicates positive significance, − indicates negative significance, o indicates no significance).
5.1. Modality vs. safety and efficiency
Even if the provided information reduced collision rates and promoted earlier reactions and accuracy for both modalities, their impact on driver reaction patterns differs significantly.
Regarding the visual ATIS, the results show that it helps drivers improve their performance by reducing the number of collisions and better longitudinal control performance. The fact that this ATIS presents information on three levels (information, advisory information and warning) provides drivers with better situation awareness, and as a result they anticipate the hazards further in advance.
Concerning the auditory ATIS, it proves more useful under simpler traffic scenarios like Pedestrian and Intersection; here the participants react significantly faster when an auditory ATIS is provided. Under such circumstances, drivers can quickly perceive and associate the localised sound cues with what they see; feedback is instant. Therefore, despite the fact that human's sound localisation resolution is quite low, participants' performance in these situations is still increased. However, under complex traffic scenarios like Red Cab, despite that the auditory ATIS stimulate faster response compared to the visual ATIS, the collision rate also increases. In Red Cab-scenario neither the system's limited resolution nor the human capability to discern the exact direction of the sound could help the drivers to tell the two vehicles' sounds apart; the angle between the two vehicles is small. Therefore, we take that in these situations, supporting sound cues with visual information to avoid confusion ought to be beneficial. This conclusion is in line with Liu and Jhuang's study (Liu and Jhuang Citation2012) finding that the combination of a visual display with spatialised sound enables faster reactions and better accuracy than single modality displays.
Another finding is related to the modalities' warning levels. In Pedestrian scenario (one of the typical typologies for pre-crash scenarios), a pedestrian walks out on the street from between two cars, meaning that visual contact through the windshield is established quite late. Since the participants drive with a speed of ca 50 km/h, this translates to 1–1.5 seconds to respond. Therefore, in this scenario, the information presented from both ATISs quickly escalate to the warning level. With such a short reaction time, none of the modalities could help the drivers to anticipate the hazard, as is shown by the lack of significant difference between baseline and ATIS driving results regarding the longitudinal driving performance. However, the auditory ATIS stimulates a direct emergent reaction, i.e. steering to avoid collision which is explained by the more abrupt steering behaviour but less collisions.
5.2. Consistency of modality effects across scenarios
In the real-world traffic, scenarios vary a lot in terms of the involved road users, road types, the dynamics between them, and the corresponding emergency levels. Of course, all these could not be recreated in one simulator drive, but the three scenarios used in this study have been carefully reconstructed from naturalistic driving data (Wang, Lyckvi, and Chen Citation2016b), and they are selected to cover typical critical situations involving various types of road users, number of road users, complexity and critical level. Thus we can draw some conclusion on types of scenarios in relation to modality.
As the shows, both modalities display consistently positive effects either on the driving efficiency or driving safety. In summary, the visual and auditory modalities improve different facets of the driver behaviour, and if a specific modality makes a difference, then that difference manifests consistently.
Considering that both ATISs are designed to promote safe driving, which for the given three scenarios implies good lane control and braking early and smoothly, it is positive to find that there are no significant effects on the lateral control for the visual modality, although the auditory modality displays some negative effects. However, the overall effects are relatively positive when taking the tendency of decreased collision rates into account.
5.3. Visual, auditory, or maybe both?
To summarise, visual informative ATIS improves driving efficiency, and tends to make drivers less prone to collide with other road users. It is ideal for giving information on what happens behind the car, and in complex situations it gives a good overview. But – it also adds more data to an already overloaded visual channel, and it works best when drivers have enough time to map the spatial information in the GUI to the physical environment around the car.
In contrast, sound is much more attention-grabbing which is useful if the other involved road users are hidden behind other vehicles or in blind spots. In an extremely complex situation, sounds can also be used to draw attention to the most immediate danger. On the other hand, we currently know little about designing the perfect informative sounds. They should not be masked by language or music, but then again not be too loud or annoying. Looking into the creation of complex soundscapes, ambiently communicating the surrounding traffic could very well be a (vast) research project which might come in handy as a complement to automated driving.
5.4. Design implication
Based on our findings, we draw the following design implications.
Auditory and visual modalities complement each other and may well be used together.
A visual interface can be used to communicate road user type. Moreover, it is superior to audio in pointing out the exact direction.
A sound as simple as one repeated sound, changing in pitch and rhythm is sufficient in attracting users' attention, therefore increasing the driving safety.
A sound-based interface works well in simpler traffic situations, especially when events are in front of the driver.
6. Limitations and future work
One limitation of this research is that the test only lasts for an hour. The driving performance could be different after a long period of use. This may work against the auditory ATIS since drivers in general are less accustomed to take in and interpret this kind of auditory information. However, we made careful experiment preparation to guarantee the participants' comprehension and familiarity towards two ATISs. Per the driver response patterns to those two ATISs, we do observe consistent difference between two modalities. From that perspective, the current study contributes to ATIS design with the insights of driving behaviour. However, further development and tests are required before the real-world applications. The second limitation lies in the different sample size of participants (20 in visual vs. 30 in auditory). Despite that, those participants have been taken from the same target group, and within the same age bracket and driving experience. The third limitation is that only three scenarios have been studied. More scenarios would of course have been beneficial. However, these scenarios are representative involving multiple road user categories; they have been carefully reconstructed from the naturalistic driving database.
In addition to addressing these limitations, there are many possible directions for future studies. One possible direction would be to conduct the study in a driving environment with higher fidelity and track the change of drivers' behaviour and system acceptance over a longer time. Driver's adaptation over a period of time is vital for technology acceptance and safety especially to test the auditory design to eliminate the acceptance time difference between those two modalities. Moreover, it would be interesting to look into how this type of visual ATIS and auditory spatial sound could support driver's situation awareness and response performance in the handover situation for the semi-automated vehicle. Lastly, it would be worth exploring and testing how Visual and 3D Auditory ATIS can work in tandem with each other for conveying information in complex situations, for instance, city situations with a mixof multiple vulnerable road users and vehicles, and the situations involving low-speed manoeuvres.
7. Conclusion
This study shows that the visual vs. the auditory modality have different effects on driver performance. A visual and an auditory ATIS were used to present the same type of advisory traffic information under the same circumstances. In both cases, drivers' performance is improved. However, the visual modality supported efficient driving whereas the auditory modality supported safe driving via faster reactions. Further, we found that if a specific modality affected a performance measurement significantly, then this difference manifested consistently across different scenarios. In summary: Modality matters, and visual and auditory modalities are complementary in an automotive context.
Acknowledgments
This project is a part of FFI ADAS presentation project. We would like to thank all our study participants, as well as Maria Kougioumoutzi, Calin Giubega, Peter Chen, and ChengHui Hong who designed the ATIS interfaces and conducted the study. Thanks also to Palle Dahlstedt who supported and supervised us for 3DAATIS development, Fredrik Hagman who designed the sound samples, as well as Samuel Palm who provided continuous support and design insights throughout the entire project.
Disclosure statement
No potential conflict of interest was reported by the authors.
Data availability
The data that support the findings of this study are available from Volvo Cars. Restrictions apply to the availability of these data, which were used under licence for this study. Data are available from MinJuan Wang with the permission of Volvo Cars.
Related Research Data
References
- Alm, Håkan, and Johan Fagerlönn. 2009. “Auditory Signs to Support Traffic Awareness.” World Congress and Exhibition on Intelligent Transport Systems and Services, Curran Associates, Inc., September 21–25. https://doi.org/10.1049/iet-its.2009.0144.
- Beattie, David, Lynne Baillie, and Martin Halvey. 2015. “A Comparison of Artificial Driving Sounds for Automated Vehicles.” Proceedings of the 2015 ACM International Joint Conference on Pervasive and Ubiquitous Computing, 451–462. ACM.
- Beattie, David, Lynne Baillie, and Martin Halvey. 2017. “Exploring How Drivers Perceive Spatial Earcons in Automated Vehicles.” Proceedings of the ACM on Interactive, Mobile, Wearable and Ubiquitous Technologies 1 (3): 36. doi: 10.1145/3130901
- Beattie, David, Lynne Baillie, Martin Halvey, and Rod McCall. 2014. “What's Around the Corner?: Enhancing Driver Awareness in Autonomous Vehicles via In-Vehicle Spatial Auditory Displays.” Proceedings of the 8th Nordic Conference on Human-Computer Interaction: Fun, Fast, Foundational, 189–198. ACM. https://doi.org/10.1145/2639189.2641206.
- Bengler, Klaus, Klaus Dietmayer, Berthold Farber, Markus Maurer, Christoph Stiller, and Hermann Winner. 2014. “Three Decades of Driver Assistance Systems: Review and Future Perspectives.” IEEE Intelligent Transportation Systems Magazine 6 (4): 6–22. https://doi.org/10.1109/MITS.2014.2336271.
- Chen, Fang, Călin Giubega, Peter Chen, and Minjuan Wang. 2014. “Designing an In-Vehicle Advisory System to Support Traffic Awareness.” 10th ITS European Congress, 1–12. Helsinki, Finland.
- Gray, Rob. 2011. “Looming Auditory Collision Warnings for Driving.” Human Factors: The Journal of the Human Factors and Ergonomics Society 53 (1): 63–74. https://doi.org/10.1177/0018720810397833.
- Kinnear, Neale, Steve W. Kelly, Stephen Stradling, and James Thomson. 2013. “Understanding How Drivers Learn to Anticipate Risk on the Road: A Laboratory Experiment of Affective Anticipation of Road Hazards.” Accident Analysis & Prevention 50: 1025–1033. doi: 10.1016/j.aap.2012.08.008
- Leo, Fabrizio, Vincenzo Romei, Elliot Freeman, Elisabetta Ladavas, and Jon Driver. 2011. “Looming Sounds Enhance Orientation Sensitivity for Visual Stimuli on the Same Side As Such Sounds.” Experimental Brain Research 213 (2–3): 193–201. https://doi.org/10.1007/s00221-011-2742-8.
- Lindgren, Anders, Alexander Angelelli, Paul Alvardo Mendoza, and Fang Chen. 2009. “Driver Behaviour when Using An Integrated Advisory Warning Display for Advanced Driver Assistance Systems.” IET Intelligent Transport Systems 3 (4): 390–399. https://doi.org/10.1049/iet-its.2009.0015.
- Liu, Yung-Ching, and Jing-Wun Jhuang. 2012. “Effects of in-vehicle Warning Information Displays with Or Without Spatial Compatibility on Driving Behaviors and Response Performance.” Applied Ergonomics 43 (4): 679–686. https://doi.org/10.1016/j.apergo.2011.10.005.
- Marshall, David, and Minjuan Wang. 2012. “Development of an In-Vehicle User Interface for Traffic Information Presentation.” Proceedings of the 44th Annual International Nordic Ergonomics and Human Factors Society Conference, Saltsjöbaden, Sweden.
- Naujoks, Frederik, and Alexandra Neukum. 2014. “Timing of In-Vehicle Advisory Warnings Based on Cooperative Perception.” Proceedings of the Human Factors and Ergonomics Society Europe Chapter Annual Meeting, 1–13. http://www.hfes-europe.org/books/proceedings2013/Naujoks.pdf.
- Scott, J. J., and Robert Gray. 2008. “A Comparison of Tactile, Visual, and Auditory Warnings for Rear-end Collision Prevention in Simulated Driving.” Human Factors: The Journal of the Human Factors and Ergonomics Society 50 (2): 264–275. doi: 10.1518/001872008X250674
- Seeliger, Florian, Galia Weidl, Dominik Petrich, Frederik Naujoks, Gabi Breuel, Alexandra Neukum, and Klaus Dietmayer. 2014. “Advisory Warnings Based on Cooperative Perception.” 2014 IEEE Intelligent Vehicles Symposium Proceedings, 246–252. IEEE. https://doi.org/10.1109/IVS.2014.6856479.
- Spence, Robert. 2014. “Introduction.” Information Visualization, 1–20. Springer. https://doi.org/10.1007/978-3-319-07341-5_1.
- Stanton, Nash, Roger Lew, Nolan Boyle, Rowdy J. Hope, Brian P. Dyre, and Ernesto A. Bustamante. 2011. “An Implementation of a Graded Deceleration Display in Brake Light Warning Systems.” Proceedings of the Human Factors and Ergonomics Society Annual Meeting, Vol. 55, 1573–1577. Los Angeles, CA: Sage Publications Sage CA. https://doi.org/10.1177/1071181311551328.
- Tufte, Edward R. 1991. “Envisioning Information.” Optometry & Vision Science 68 (4): 322–324. https://doi.org/10.1002/aic.690390220. doi: 10.1097/00006324-199104000-00013
- Wang, MinJuan, Sus Lundgren Lyckvi, and Fang Chen. 2016a. “Why and How Traffic Safety Cultures Matter when Designing Advisory Traffic Information Systems.” Proceedings of the 2016 CHI Conference on Human Factors in Computing Systems, 2808–2818. ACM. https://doi.org/10.1145/2858036.2858467.
- Wang, Minjuan, Sus Lundgren Lyckvi, and Fang Chen. 2016b. “Same, Same but Different: How Design Requirements for an Auditory Advisory Traffic Information System Differ Between Sweden and China.” Proceedings of the 8th International Conference on Automotive User Interfaces and Interactive Vehicular Applications, 75–82. ACM. https://doi.org/10.1145/3003715.3005450.
- Wang, MinJuan, Sus Lundgren Lyckvi, Chenhui Chen, Palle Dahlstedt, and Fang Chen. 2017. “Using Advisory 3D Sound Cues to Improve Drivers' Performance and Situation Awareness.” Proceedings of the 2017 CHI Conference on Human Factors in Computing Systems, 2814–2825. ACM. https://doi.org/10.1145/3025453.3025634.
- Ware, Colin. 2012. Information Visualization: Perception for Design. Waltham, MA, USA: Elsevier.
- Wickens, Christopher D, Justin G. Hollands, Simon Banbury, and Raja Parasuraman. 2015. Engineering Psychology & Human Performance. New York: Psychology Press.
- Wickens, Christopher D., and Yili Liu. 1988. “Codes and Modalities in Multiple Resources: A Success and a Qualification.” Human Factors: The Journal of the Human Factors and Ergonomics Society 30 (5): 599–616. https://doi.org/10.1109/MITS.2014.2336271. doi: 10.1177/001872088803000505
- Wickens, Christopher, Julie Prinet, Shaun Hutchins, Nadine Sarter, and Angelia Sebok. 2011. “Auditory-Visual Redundancy in Vehicle Control Interruptions: Two Meta-Analyses.” Proceedings of the Human Factors and Ergonomics Society Annual Meeting, Vol. 55, 1155–1159. Los Angeles, CA: Sage Publications Sage CA. https://doi.org/10.1177/1071181311551241.
- Winkler, Susann, Juela Kazazi, and Mark Vollrath. 2016. “Driving with a Multi Stage Warning System in the Head-Up Display–How do Drivers React Upon it?” Proceedings of the Human Factors and Ergonomics Society Europe, Prague, Czech Republic.