
 ?Mathematical formulae have been encoded as MathML and are displayed in this HTML version using MathJax in order to improve their display. Uncheck the box to turn MathJax off. This feature requires Javascript. Click on a formula to zoom.
Abstract
Supercritical CO2 power systems offer the potential of reduced system footprint and improved thermal efficiency, through the development and adoption of compact heat exchangers. Among these heat exchangers, the microtube, printed circuit, and plate heat exchangers are emerging as the most promising technologies for heat addition to the cycle, heat recuperation and heat rejection, respectively. To investigate the performance of supercritical CO2 recuperated Brayton cycle for heat to power conversion, simulation models of the heater, recuperator and cooler were developed using the distributed modeling approach and the ε-NTU method and then integrated with turbomachinery models to form the cycle model. The influences of flow rates of the heat carrier, cooling and working fluids on the heat exchanger performance and the integrated system were investigated. For the studied power system and under the off-design operating conditions, the net thermal efficiency of the cycle varies between 14.1% and 16.8%. Results show that increasing in the working fluid flow rate remains the net power output of the cycle but decreases the net cycle thermal efficiency, while increasing in the heat carrier fluid increases both, and the increase of cooling fluid increases the net power output but maintains the net thermal efficiency.
Introduction
Supercritical CO2 Brayton cycles are expected to play significant role in heat to power conversion. The key applications include waste heat recovery, concentrated solar power, fossil fuel and nuclear power generation [Citation1–3]. The supercritical CO2 power systems offer the potential of smaller size and improved electrical-power-conversion efficiency, compared to the conventional steam Rankine cycle. The Sandia National Laboratory and the Knolls Atomic Power Laboratory in the USA and the Institute of Applied Energy in Japan are amongst the first to build supercritical CO2 integrated systems alongside the development of important components such as turbomachinery and heat exchangers [Citation4, Citation5]. To maintain the cycle compactness and ensure safe operation, the employed turbomachinery and compact heat exchangers must be designed to operate at challenging thermomechanical, and thermohydraulic conditions, due to the high temperatures and pressures and their large differences between the high- and low-pressure sides of the system.
The heat exchangers in supercritical CO2 power systems are of three basic types: heater providing the heat source to the fluid, recuperator recovering the heat from the expander exhaust, and cooler rejecting heat to the environment. The heater is mostly operated under high temperatures and pressures dictated by the conditions of the heat source and the requirement to achieve high energy conversion efficiencies. Based on the maximum design temperature and pressure, the shell-and-tube, diffusion-bonded, plate-fin, microtube and printed circuit heat exchangers can be considered candidate architectures for the heater [Citation6, Citation7]. However, the large physical size required in the case of shell-and-tube heat exchangers, leads to high material and fabrication costs. The printed circuit heat exchanger (PCHE) is compact but leads to high pressure drop on the heat source side as well high rates of fouling that necessitates frequent cleaning of the heat exchanger. These factors reduce the attractiveness of the PCHE for applications where the exhaust gas is not very clean. The recuperator is mainly operated under high temperatures and pressures and should withstand the pressure difference between hot and cold streams. Until now, the Heatric PCHEs have been the most widely adopted supercritical CO2 recuperators [Citation8]. Four types of flow passage, including straight channels [Citation9–11], zigzag channels [Citation12–19], channels with S-shaped fins [Citation13], and channels with airfoil fins [Citation14], have been developed and their performance analyzed. Despite their good heat transfer performance, in general, PCHEs suffer from relatively high cost and pressure drop [Citation20, Citation21]. The gas cooler normally operates at low temperatures and pressures which reduces concerns of material selection and structural integrity. Gas coolers can reject heat to water or brine (liquid coupled) or directly to air (air coupled). Air coupled gas coolers, depending on the ambient temperature they can be of the dry or wet type where water is sprayed over the external surface of the heat exchanger to reduce the temperature of the supercritical CO2 fluid entering the compressor at just above the critical temperature 31.1 °C. Supercritical CO2 gas cooling technology developed for refrigeration and heat pump applications can also be employed in supercritical power generation applications but care should be taken in the selection of tube and fin material (if fins are employed), to ensure reliable and efficient operation and minimize the life cycle cost of the systems. For liquid coupled heat rejection, plate or shell-and-tube heat exchangers can be employed that can have lower cost than PCHEs.
For performance analysis of supercritical CO2 heat exchangers, three-dimensional computational fluid dynamics has been extensively used to investigate the heat transfer and pressure drop characteristics of supercritical CO2 in recuperators due to the complex flow passages and complicated channel geometry [Citation11, Citation14–19], and in low-temperature coolers where large variations in thermodynamic properties can significantly affect their thermohydraulic performance [Citation22–31]. Due to the significant computational power and time requirements, however, these three-dimensional numerical models are normally used to investigate the fluid flow, heat transfer and associated phenomena in small sections of a heat exchanger as they are not practical for the modeling of whole heat exchangers within the overall complex thermodynamic system [Citation32, Citation33]. For this reason, the one-dimensional segmental approach is preferred for the modeling of large heat exchangers in integrated systems over three-dimensional modeling. Guo and Huai [Citation9, Citation10] employed the segmental approach and the ε-NTU method to develop a one-dimensional model of a printed circuit recuperator with straight channels. Marchionni et al. [Citation33] developed a one-dimensional model of a printed circuit recuperator using the commercial simulation tool GT-SUITE™ to construct performance maps for a printed circuit recuperator with zigzag channels and investigate its performance under different operating conditions. Jiang et al. [Citation34] presented a one-dimensional model developed in Aspen Custom Modeler and used it to optimize the design of a microtube shell-and-tube recuperator considering manufacturing constraints.
Considering the key function and compatibility requirement of each type of supercritical CO2 heat exchanger, Chai and Tassou [Citation35] designed a supercritical CO2 recuperated Brayton cycle in which a four-module microtube heat exchanger, a PCHE with zigzag channels and a chevron-type plate heat exchanger were respectively employed as the heater, recuperator and cooler. The distributed approach combined with the ε-NTU method was developed for the modeling of these three heat exchangers. Their thermohydraulic performance was presented in terms of heat transfer and pressure drop. However, for the optimal design of the supercritical CO2 power systems, more accurate information on the performance of the supercritical CO2 heat exchangers and the integrated system are required as a function of operating conditions and geometric parameters. Particularly, the off-design conditions are always associated with startups, shutdowns, and load swings and may be imposed by limitations in power demand or thermal resource. These variations lead to temperature or pressure changes to employed heat exchangers and the turbomachinery. The off-design performance of the components is essential for detailed integrated system design, providing control system setpoints, evaluating the overall lifecycle performance and assessing the financial feasibility [Citation33, Citation36]. Consequently, more in-depth studies are required to better understand the off-design capabilities of the components and the whole system. This present work will focus on these three employed heat exchangers and the integrated system under off-design operating conditions and examine the influences of flow rates of the heat carrier, cooling and working fluids. In most of the previous system simulations where heat exchangers are part of the system, a constant effectiveness is normally used which is determined at design conditions and an external heat source or sink are typically set to operate with a fixed discharge temperature. However, where the system is required to operate over a wide range conditions and knowledge is required of the system behavior during operation for safety and control optimization purposes, the assumptions of the constant effectiveness and the fixed temperatures can lead to significant errors which can adversely impact the design accuracy, estimation of the appropriate size of the heat exchanger, and system cost [Citation36, Citation37]. The detailed system mathematical model presented in this study can accurately capture the effects of changing CO2 properties and determine the thermohydraulic characteristics of the heat exchangers, and accurately simulate the thermodynamics of supercritical CO2 heat to power conversion systems.
Configuration and geometry
This study considers the integrated modeling of a simple supercritical CO2 recuperated Brayton cycle. As shown in , the cycle contains five components: compressor, recuperator, heater, turbine and cooler. The supercritical CO2 enters sequentially the compressor to increase its pressure, the recuperator to recover heat from the turbine exhaust to increase the temperature of CO2 entering the heater, the heater to recover thermal energy from the heat source, the turbine to convert the high-temperature high-pressure energy into power and the cooler to reject heat to the environment and ensure that the temperature of the CO2 entering the compressor is just above the critical temperature to complete the thermodynamic cycle.
Figure 1. Investigated supercritical CO2 recuperated Brayton cycle and the employed heat exchangers.
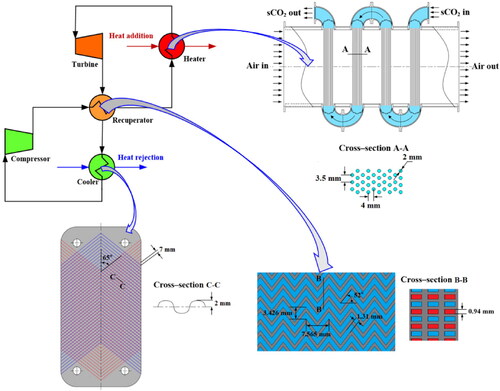
The heater contains four modules of staggered microtube bundles. The microtubes have outside diameter of 2 mm, tube wall thickness of 0.1 mm, and tube length of 0.5 m. The tube spacings are 3.5 mm in normal direction and 4 mm in parallel direction. Each module has 1,000 microtubes, which are uniformly distributed in 10 rows.
The recuperator contains 2,000 zigzag channels in total: 1,000 on cold side and 1,000 on the hot side. The channel geometry is the same for the cold and hot sides. The plate is 1.5 mm thick and 1.0 m long. The channel spacings are 3.426 mm in the normal direction to flow and 7.565 mm in parallel (longitudinal) direction to flow. The fin angle to the parallel direction is 52°, and the zigzag fin width, depth and gap are 0.8, 0.94 and 1.31 mm respectively. These geometry parameters are from Ngo et al. [Citation13].
The chevron-type plate cooler also contains a total of 2,000 channels (1,000 on the cold side and 1,000 on the hot side). The plate thickness is 0.4 mm, and the plate length is 1.0 m. The corrugation depth is 2 mm, the herringbone angle is 65°, and the corrugation pitch is 7 mm. The area enlargement factor of this chevron plate is 1.16, and the corrugation profile aspect ratio is 0.571. These configuration parameters are from Yang et al. [Citation38]. The material of the heater and recuperator is stainless steel, and that of the cooler copper.
Modeling methodology
Heat exchanger models
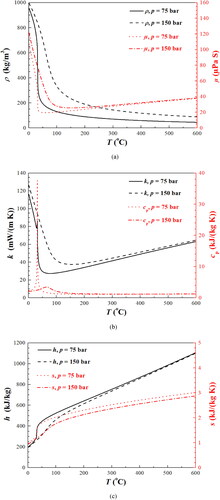
To accurately capture the performance of the heat exchangers and the integrated system, the distributed segmental approach is employed to discretize the different types of heat exchangers into numerous segments connected in series. The segment design for a single module of the heater with cross flow is presented in , and that for both the recuperator and cooler with counter flow is demonstrated in . The segments are equally spaced along the heat exchangers. The ε-NTU method is employed to model the heat transfer in each segment. The temperature and pressure of the heat carrier, cooling and working fluids are determined through an energy balance between the two flow streams. In order to correctly capture the effect of variable thermophysical properties of supercritical CO2, the temperature- and pressure- dependent properties are obtained from the NIST REFPROP v9.1 database and updated in each segment. The thermophysical properties of the heat carrier and cooling fluids are also obtained and updated from this database dependent on their temperature and pressure in each segment. shows the thermophysical properties of supercritical CO2 at pressures of 75 and 150 bar for the temperature range between 0 and 600 °C, including density, dynamic viscosity, thermal conductivity, specific heat, specific enthalpy, and specific entropy. It can be seen that the thermophysical properties of CO2 change drastically with temperature close to the pseudocritical and critical points. Therefore, the heat transfer coefficient and friction factors have to be calculated locally and for each segment of the heat exchangers. For the conditions modeled it was determined, using a performance change of less than 1% that a segment number of 50 would be sufficient for one module of the heater and 100 for the recuperator and cooler respectively.
Figure 2. Distributed modeling approach. (a) For a single heater module with cross flow; (b) For recuperator and cooler with counter flow.
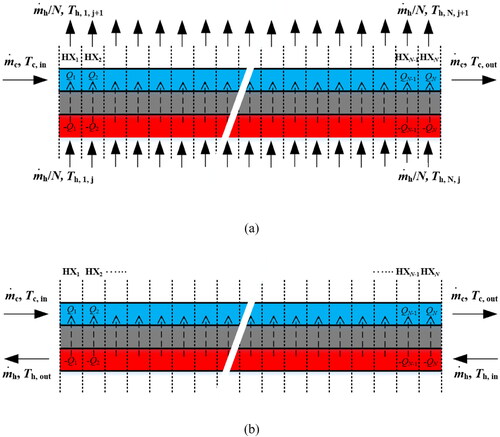
Figure 3. Thermophysical properties of supercritical CO2. (a) Density and dynamic viscosity; (b) Thermal conductivity and specific heat; (c) Specific enthalpy and specific entropy.
For each segment, the heat transfer rate from the hot fluid to the cold fluid is calculated by the ε-NTU method [Citation39],(1)
(1)
(2)
(2)
(3)
(3)
(4)
(4)
(5)
(5)
(6)
(6)
(7)
(7) where Q is the heat transfer rate, ε is the heat exchanger effectiveness, Cmin and Cmax represent the smaller and the larger capacity rates, T is the temperature, NTU is the number of transfer units, U is the overall heat transfer coefficient, A is the heat transfer area, h is the heat transfer coefficient, Rs is the thermal resistance of the channel wall,
is the mass flow rate, and cp is the specific heat. Subscripts c and h represent the cold and hot sides of the heat changer.
The heat transfer coefficient and pressure drop of the fluids are calculated from the empirical correlations for Nusselt number and friction factor for each heat exchanger type. The Nusselt number and friction factor of supercritical CO2 flowing inside the heater tubes and the heat carrier fluid across the tube bundles are those proposed by Gnielinski [Citation40] and Zukauskas [Citation41] respectively.(8)
(8)
(9)
(9)
(10)
(10)
(11)
(11)
(12)
(12) where Nu is the Nusselt number, f is the friction factor, Re is the Reynolds number, Pr is the Prandtl number, Remax is the Reynolds number calculated based on the maximum flow velocity, u∞ is the incoming free stream velocity, d is the outside diameter of tube, Sn and Sp represent the tube spacings in the normal direction and the parallel direction of flow, respectively. The correlation of Gnielinski [Citation40] for pipe and tube flow is valid for 3,000 < Re < 5 × 10⁶, 0.5 < Pr < 2,000. The correlation of Zukauskas [Citation41] for flow across tube bundles is applicable for 0.7 < Pr < 500 and 10 < Remax < 106. The parameters C and n in EquationEq. (10)
(10)
(10) are dependent on the geometry of the tube bundles and the range of Remax.
The Nusselt number and friction factor of supercritical CO2 flowing through the recuperator are from Ngo et al. [Citation13] which developed these correlations from the same heat exchanger geometry,(13)
(13)
(14)
(14)
These correlations were proposed based on the supercritical CO2 data base of 3.5 × 10³ < Re < 2.2 × 10⁴ and 0.75 < Pr < 2.2, and further validated by Kim et al. [Citation17] to an extended Reynolds number range of 3.5 × 10³ < Re < 5.8 × 10⁴.
The Nusselt number and friction factor of the cooling fluids in the chevron-type plate cooler are from Wanniarachchi et al. [Citation42],(15)
(15)
(16)
(16)
(17)
(17)
(18)
(18)
(19)
(19)
(20)
(20)
(21)
(21)
(22)
(22) where β is the chevron angle, ϕ is the corrugation profile aspect ratio of the developed length to the protracted length, μ is the dynamic viscosity, m and p are parameters during calculation. This correlation is applicable for 1 ≤ Re < 104 and 2° ≤ β ≤ 62°.
To account for the properties of supercritical CO2 at the near-critical region, the function f(B) developed by Krasnoshchekov and Protopopov [Citation43] is used to modify EquationEq. (15)(15)
(15) ,
(23)
(23)
(24)
(24) where k is the thermal conductivity,
is the integrated mean specific heat, h is the specific enthalpy of fluid, and the subscript w represents the internal tube surface.
In the above correlations, the Reynolds number Rei and hydraulic diameter D are defined as:(25)
(25)
(26)
(26) where G is the mass flux, A is the cross-sectional area of the flow, and P is the wetted perimeter of the cross section.
The pressure drop of these three heat exchangers on the cold side Δpc, i and on the hot side Δph, i can be determined from:(27)
(27)
(28)
(28) where L is the total tube length and N is the total number of segments.
Integrated system model
The heat exchanger models are combined with the turbomachinery models to form an integrated thermodynamic system model. The turbomachinery models are represented by efficiency η and pressure ratio PR [Citation36].(29)
(29)
(30)
(30) where hcom,out is the actual (real) compressor outlet enthalpy, hcom, in is the compressor inlet enthalpy, hcom,out,ideal is the ideal compressor outlet enthalpy, ηisen, com is the compressor isentropic efficiency; htub,out is the real turbine outlet enthalpy, htub,in is the turbine inlet enthalpy, htub,out,ideal is the ideal turbine outlet enthalpy, ηisen,tub is the turbine isentropic efficiency. The ideal outlet enthalpy of the compressor and turbine are based on the temperature and pressure and determined from the NIST REFPROP v9.1 database. The outlet pressures are calculated from the inlet pressure and the pressure ratio. The outlet temperatures of the compressor and turbine are determined from the outlet pressure and enthalpy.
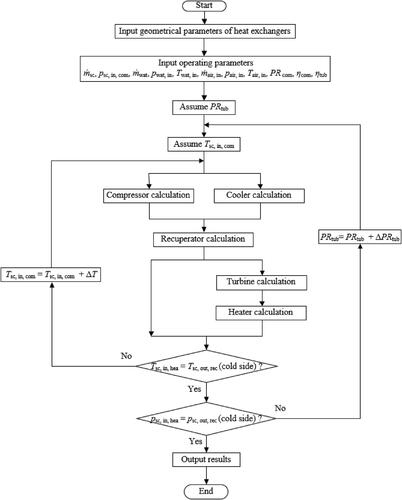
The hot exhaust air and cooling water are the heat carrier and cooling fluids, respectively. The flowchart of the integrated system model is shown in . The model firstly reads the input of geometrical parameters of the component geometry parameters and the operating parameters of heat carrier, cooling and working fluids, and then calls the subroutines of the individual components for calculations. Based on the assumed temperature of supercritical CO2 into compressor, the compressor and cooler are firstly calculated. The outputs of the compressor are used as the inputs of the high-pressure side of the recuperator, and those of the cooler are employed for the low-pressure side. The outputs on the low-pressure side of recuperator are then employed as the inputs of turbine. The outputs of the turbine are then applied as the inputs of the heater. The obtained inlet temperature and pressure of the heater will compare with the outlets of the high-pressure side of the recuperator. During the calculation, two solving routines are employed: the inside iteration for the CO2 temperature and the outside one for the CO2 pressure. For the temperature iteration, the solving routine starts from a CO2 temperature a little higher than the cooling water temperature and then iterates with the gradually increased values until the calculated CO2 temperature into the heater matches its outlet value from the recuperator where the difference less than 1 K indicates the matching. For the pressure iteration, an assumed pressure ratio of the turbine equivalent to that of the compressor launches the solving routine and then little-by-litter the decreased pressure ratio to make the calculated inlet CO2 pressure of the heater approach the outlet one exiting the recuperator. For each assumed pressure ratio of the turbine, the solving routine of temperature iterates until the matching requirement are achieved. The computation time of each simulation is much dependent on the initial assumed pressure ratio and temperature of supercritical CO2 into compressor and operating conditions, and takes several minutes or even hours. Based on the above equations, both the subroutine code of the heat exchangers and the turbomachinery, and the main routine code of the integrated system were written in the MATLAB programming language (MathWorks Inc, Natick, Massachusetts, United States).
Figure 4. Flowchart of integrated system simulation.
Validation
The modeling approach in this paper of combining the segmental approach with the ε-NTU methodology has been validated by Chai and Tassou [Citation35] in the modeling of PCHE by comparing the results with those from three-dimensional CFD simulations. These simulations used the standard k-ε model to account for turbulence, buoyancy and entrance effects. The real-gas thermophysical properties were obtained through direct linkage to the NIST Refprop database. The governing equations of velocity, pressure and temperature were solved through the ANSYS FLUENT 17.0 solver. The one-dimensional modeling employed in the present work is relatively fast and can provide essential component information and accurate system overview. The paper also compares the model predictions for the PCHE with the results of Guo and Huai [Citation10], that employed a similar distributed approach and ε-NTU method to investigate the thermohydraulic performance of heat exchanger. The compared heat exchanger has plate thickness 2.5 mm, channel pitch 3 mm, semi-circular channel diameter 2 mm, and contains 1,500 channels on the cold side and 1,500 on hot side. For the operating conditions Tc,in = 80 °C, Th,in = 180 °C, pc,in = 200 bar, ph,in = 75 bar, and c,in = 1.3 kg/s,
h,in = 2 kg/s. shows the variation of the overall heat transfer rate Q and the total entropy generation number
sT (
) with different heat exchanger length L. It can be seen that the developed model can predict very well the thermohydraulic performance of the heat exchanger with less than 2% difference for both the Q and
sT, confirming the validity of the modeling approach adopted. The validated heat exchanger methodology was subsequently combined with much simpler turbomachinery models to simulate the whole integrated thermodynamic system.
Figure 5. Comparison with results of Guo and Huai [Citation10]. (a) Variation of Q with L; (b) variation of NsT with L.
![Figure 5. Comparison with results of Guo and Huai [Citation10]. (a) Variation of Q with L; (b) variation of NsT with L.](/cms/asset/3bb4280f-b1b8-4b61-a361-4a1bc7d702b4/uhte_a_2140640_f0005_c.jpg)
Results and discussion
Performance analysis of heater
To investigate the influence of mass flow rates of the working and heat carrier fluids on the thermohydraulic performance of the heater, the flowrate of the supercritical CO2 was varied from 0.6 to 1.6 kg/s and the hot exhaust flow rate from 0.5 to 1.5 kg/s. The temperature and pressure input parameters were fixed at Tsc,out = 500 °C, psc,out = 150 bar, Tair,in = 600 °C and pair,in = 1 bar. shows the operating conditions for performance analysis of the heat exchangers.
Table 1. Operating conditions for performance analysis of the heat exchangers.
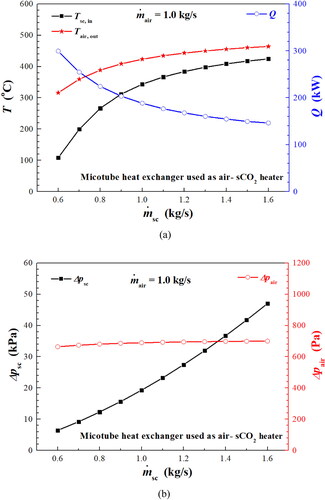
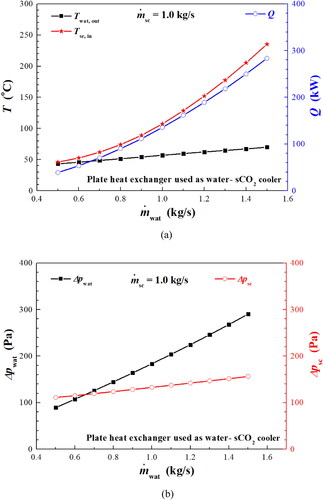
shows the variations of the calculated CO2 inlet temperature Tsc,in, average air outlet temperature Tair, out and the associated heat transfer rate Q with For
increasing from 0.6 to 1.6 kg/s, Tsc,in rises from 108 to 424 °C whilst Tair,out increases from 316 to 464 °C and the overall heat transfer Q drops from 299 to 146 kW. In terms of the input parameters, a larger
results in a lower temperature drop of Tsc for a segment i then for the whole flow passage. Therefore, the increased
leads to the increased Tsc,in and thus a lower temperature difference to the hot air. This change further brings about the increased Tair,out and the decreased Q. It should be pointed out that the thermal resistance of the heater is on the hot air side, so the increasing
cannot obviously enhance the heat transfer process and the decreased Q is mostly determined by the temperature difference. The corresponding influence of
on hydraulic performance is shown in . For
rising from 0.6 to 1.6 kg/s, the CO2 pressure drop Δpc increases from 6 to 47 kPa, mostly caused by the enlarged
and partly from the increased viscosity for the larger Tsc. The hot air pressure drop Δpair just rises a little from 664 to 700 Pa, due to the slightly larger viscosity for the increased Tair.
Figure 6. Influence of CO2 mass flow rate on heater performance. (a) Heat transfer; (b) Pressure drop.
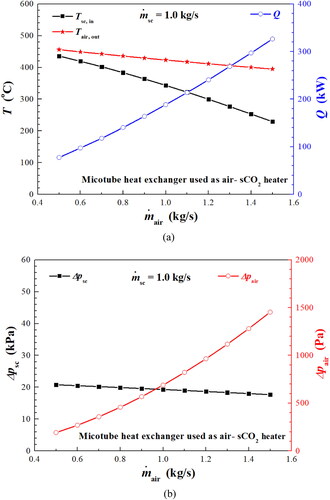
demonstrates the influence of on the thermal performance of the heater. With the increase of
from 0.5 to 1.5 kg/s, the Tsc,in decreases from 436 to 229 °C, the Tair,out reduces from 456 to 395 °C, and the corresponding Q dramatically increases from 77 to 327 kW. A larger
can significantly improve the heat transfer of hot air: as
increases from 0.5 to 1.5 kg/s, the average heat transfer coefficient of hot air goes up from 146 to 254 W/(m2 K). The better heat transfer performance results in significantly increased Q. For the influence of
on the hydraulic performance, illustrates the variation of pressure drop on both cold and hot sides. The CO2 pressure drop Δpsc slightly decreases from 21 to 18 kPa due to the smaller viscosity with the decrease of Tsc, while the hot air pressure drop Δpair dramatically rises from 192 to 1453 Pa with the increased
Figure 7. Influence of mass flow rate of heat carrier fluid on heater performance. (a) Heat transfer; (b) Pressure drop.
Performance analysis of recuperator
To examine the influence of mass flow rates of supercritical CO2 on the thermohydraulic performance of the recuperator, the mass flow rates on the hot and cold sides respectively cover the range from 0.5 to 1.5 kg/s. Temperature and pressure input parameters are: Tsc,c,in = 100 °C, psc,c,in = 150 bar and Tsc,h,in = 400 °C, p sc,h,in = 75 bar, as shown in .
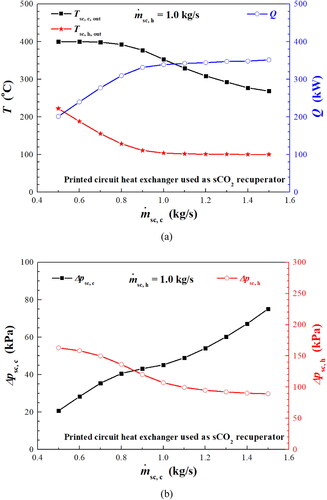
demonstrates the variations of the thermal and hydraulic performance with mass flow rate on the cold side For
increasing from 0.5 to 1.5 kg/s, the Tsc,c,out drops from 400 to 268 °C, the Tsc,h,out reduces from 222 to 100 °C, and the related Q increases from 201 to 351 kW. Increasing in
can clearly enhance the heat transfer: with the increase of
from 0.5 to 1.5 kg/s, the average heat transfer coefficient of cold CO2 climbs up from 1,881 to 3,751 W/(m2 K). It can be seen that the Q significantly increases with
up to 1.0 kg/s and after that the increase slows down due to the pinch point where the Tsc,h,out approaches the Tsc,c,in and there is little temperature difference between them. For the pressure drop, the increased
combined with the decreased viscosity on the cold side results in the increasing Δpsc,c from 21 to 75 kPa. The reduced viscosity on the hot side leads to a decrease in Δpsc,h from 163 to 89 kPa.
Figure 8. Influence of the cold CO2 mass flow rate on recuperator performance. (a) Heat transfer; (b) Pressure drop.
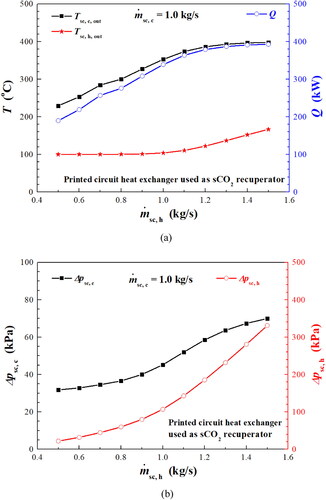
The influence of mass flow rate on the hot side on the recuperator performance is shown in . With an increase of
from 0.5 to 1.5 kg/s, the Tsc,c,out rises from 229 to 398 °C, the Tsc,h,out increases from 100 to 167 °C, and the associated Q increases from 190 to 393 kW. The average heat transfer coefficient of the hot CO2 increases from 1,650 to 3,312 W/(m2 K), which improves the heat transfer rate, from 379 to 393 kW. Increasing the
from 0.5 to 1.5 kg/s causes an increase in the Δpsc,c from 32 to 70 kPa. As a result of the large variation in the viscosity of the hot CO2 and the increasing mass flow rate, the pressure drop Δpsc,h rises rapidly from 22 to 331 kPa.
Figure 9. Influence of hot CO2 mass flow rate on recuperator performance. (a) Heat transfer; (b) Pressure drop.
Performance analysis of cooler
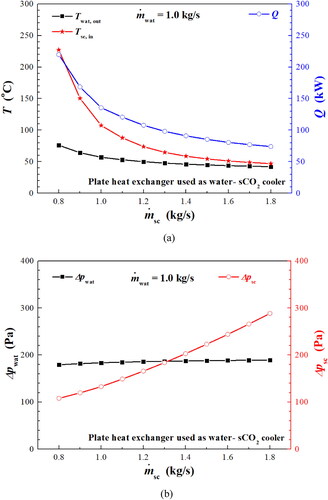
To study the influence of mass flow rate of the working and cooling fluids on the thermohydraulic performance of the cooler, flow rates in the range = 0.5 − 1.5 kg/s for water and
= 0.8 − 1.8 kg/s for the supercritical CO2, were used for fixed inlet temperatures and pressures of: Twat,in = 25 °C, pwat,in = 1 bar and Tsc,out = 35 °C, psc,out = 75 bar, as illustrated in .
shows the variation of the thermal performance of the cooler with in the range 0.5 to 1.5 kg/s. The calculated Tsc, in rises from 46 to 235 °C, the associated Twat, out increases from 43 to 70 °C, and the Q increases from 39 to 284 kW. The average heat transfer coefficient of the cooling water also increases from 1,123 to 2,416 W/(m2 K), and this heat transfer enhancement leads to the monotonous increases for all Q, Tsc,in and Twat,out. As shown in , the increasing
increases both the water side pressure drop and also the supercritical CO2 pressure drop, where the Δpwat goes up from 89 to 290 Pa and the Δpsc increases from 111 to 156 Pa.
Figure 10. Influence of mass flow rate of cooling fluid on cooler performance. (a) Heat transfer; (b) Pressure drop.
shows the influence of the on performance of the cooler. Increasing the
leads to significant reductions in the Tsc, in and the Q. For
from 0.8 to 1.8 kg/s, the Twat,out diminishes from 227 to 47 °C, and the associated Q declines from 220 to 74 kW. The larger
results in the enhancement of heat transfer of supercritical CO2: the heat transfer coefficient of CO2 varies from 619 to 1,237 W/(m2 K). The other practically important influence of
on Q is the rapidly decreased temperature difference between the two fluids, and in turn the declined Q further drags the temperature difference down. As shown in , the increase in the
leads to increased pressure drop on the hot side of the heat exchanger, whereas the pressure drop on the water side will stay fairly constant, where the Δpsc grows from 108 to 288 Pa and Δpwat keeps around 185 Pa.
Figure 11. Influence of CO2 mass flow rate on cooler performance. (a) Heat transfer; (b) Pressure drop.
Performance analysis of integrated system
For one case of the integrated system simulation, the input parameters are = 1 kg/s, psc,in,com = 75 bar,
= 1 kg/s, pwat,in = 1 bar, Twat,in = 25 °C,
= 1 kg/s, pair,in = 1 bar, Tair,in = 600 °C, compressor pressure ratio PRcom = 2, efficiency ηcom = 0.75, and turbine efficiency ηtub = 0.8. The power output generated by the turbine was calculated to be 63 kW and the input consumed by the compressor 38 kW and the thermal energy received from the heater 169 kW. Consequently, the net power output of the CO2 cycle (power output generated by the turbine minus input consumed by the compressor) is 25 kW, giving a net thermal efficiency of the cycle (net power output of the CO2 cycle over the thermal energy received from the heater) of 14.8%.
shows the temperature-entropy and the pressure-enthalpy diagrams of the integrated cycle. The temperature and pressure entry to and exit from the main components of the cycle are shown in : 34.4 °C into the compressor, 83 °C into the recuperator, 382 °C into the heater, 517 °C into the turbine, 443 °C into the recuperator from other side, and 86 °C into the cooler, respectively; 75 bar into the compressor, 150 bar into the recuperator, 149.6 bar into the heater, 149.4 bar into the turbine, 76.1 bar into the recuperator from other side, and nearly 75 bar into the cooler, respectively.
Figure 12. Integrated system cycle. (a) T – s diagram; (b) P – h diagram.
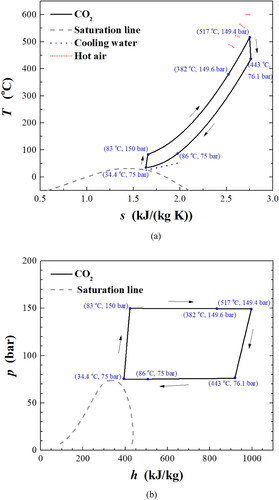
Table 2. The temperature and pressure entry to and exit from the main components of the cycle.
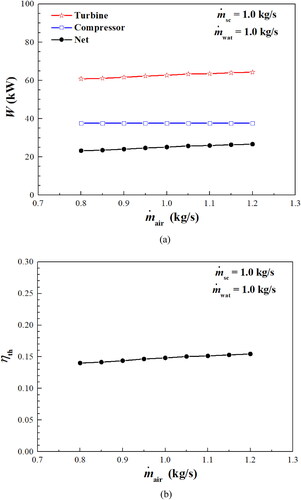
To investigate the influence of mass flow rate of the working fluid on the performance of the integrated system, the was increased from 0.8 to 1.2 kg/s in steps of 0.05 kg/s with all the other fixed input parameters shown in . The results are shown in . The increase in
from 0.8 to 1.2 kg/s leads to an increase in the power output generated by the turbine from 53 to 72 kW and increase of power input consumed by the compressor from 28 to 48 kW. The 50% increase of
from 0.8 to 1.2 kg/s results in 71% higher compressor power input while only 37% higher power output of the turbine, leading to the similar magnitude of net power output of the cycle around 25 kW. The less increase of power output of the turbine is caused by the lower entry temperature with increase of
542 °C entry for 0.8 kg/s flowrate while 491 °C for 1.2 kg/s. The increase
also leads more thermal energy received by the heater, 146 kW for 0.8 kg/s while 190 kW for 1.2 kg/s. The corresponding temperature of CO2 increases in the heater from 405 to 542 °C as
= 0.8 kg/s and 365 to 491 °C as
= 1.2 kg/s, while the temperature of air drops through the heater from 600 to 472 °C and from 600 to 428 °C, respectively. Therefore, the related net thermal efficiency of the cycle decreases from 16.9% to 12.7% as shown in .
Figure 13. Influence of mass flow rate of working fluid on integrated system performance; (a) Turbine output, compressor input and cycle output; (b) Thermal efficiency.
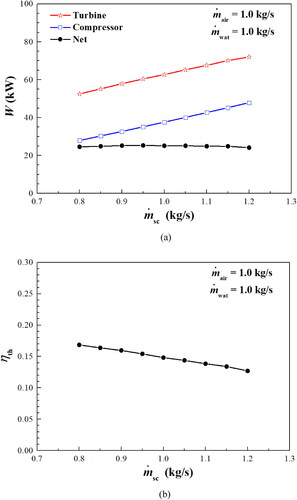
Table 3. Operating conditions for performance analysis of integrated system.
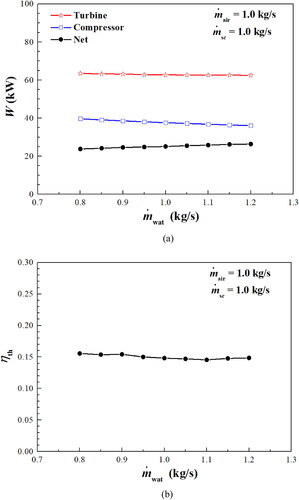
shows the performance of the integrated system with increasing in mass flow rate of the hot air from 0.8 to 1.2 kg/s with all the other fixed input parameters indicated in . For
increasing from 0.8 to 1.2 kg/s, the power output of the turbine increases from 61 to 64 kW, because of the increased entry temperature from 493 to 533 °C, and the power input to the compressor remains around 37 kW. Consequently, the corresponding cycle output keeps going up from 23 to 27 kW. The increase
also brings more thermal energy which can be received by CO2 from the heater, 165 kW for 0.8 kg/s while 173 kW for 1.2 kg/s. The corresponding temperature of CO2 in the heater is 369 °C entry and 493 °C exit as
= 0.8 kg/s, while 399 °C entry and 533 °C exit as
= 1.2 kg/s. The associated temperature of air through the heater drops from 600 to 423 °C and from 600 to 470 °C, respectively. The corresponding net thermal efficiency of the cycle increases from 14.1% to 15.4%.
Figure 14. Influence of mass flow rate of heat carrier fluid on integrated system performance; (a) Turbine output, compressor input and cycle output; (b) Thermal efficiency.
shows the variations of the performance of the integrated system for a rise in the water flowrate from 0.8 to 1.2 kg/s while keeping all other input parameters constant as indicated in . The turbine power output decreases slightly from 64 to 63 kW, resulting from the reduced entry temperature from 524 to 515 °C, while the compressor input power decreases from 40 to 36 kW, caused by the lower inlet temperature into the compressor (35.6 °C entry the compressor as
= 0.8 kg/s while 33.6 °C entry as
= 1.2 kg/s). Therefore, the net power output of the CO2 cycle increases from 24 to 27 kW. The corresponding temperature of CO2 in the heater increases from 403 to 524 °C as
= 0.8 kg/s while 380 to 515 °C as
= 1.2 kg/s, and thus the associated received thermal energy from the heater increases from 153 to 178 kW. Consequently, the net thermal efficiency of the cycle climbs very slowly around 15% with increase of
as shown in .
Figure 15. Influence of mass flow rate of cooling fluid on integrated system performance; (a) Turbine output, compressor input and cycle output; (b) Thermal efficiency.
Conclusions
In this study, a detailed mathematical model of an integrated supercritical CO2 heat to power system is presented. Microtube, printed circuit and chevron-type plate heat exchangers have been assumed as the heater, recuperator and cooler, respectively. The models of these three heat exchangers have been developed using the segmental approach and the ε-NTU method. The individual heat exchanger models and that of the integrated system have been used to investigate the influence of the heat carrier, cooling, and working fluids on the performance of the heat exchangers and the integrated system.
The temperature difference between the heat carrier and working fluids mostly determines the heat transfer process of the heater. Increasing in the mass flow rate of the heat carrier fluid increases the heat transfer capacity but with a penalty of increased pressure drop which can be problematic in exhaust heat recovery applications. Increasing the mass flow rate of working fluid on either side of the recuperator leads to an increase in the heat transfer capacity but also an increase in pressure drop. The internal pinch point in the recuperator can largely weaken the heat transfer process when the temperature difference between the two fluids is a minimum. Increasing the mass flow rate of cooling fluid increases the heat transfer rate of the heat exchanger with a very small penalty of increased water side pressure drop. Increasing the working fluid flow rate causes a significant increase of pressure drop in all these three heat exchangers.
Under the investigated off-design operating conditions, the studied integrated system produces the net cycle power output in the range of between 23 and 27 kW, and the associated net thermal efficiency of the cycle lies in the range of from 14.1% to 16.8%. Increasing in the working fluid mass flow rate increases the power output generated by the turbine and the power input consumed by the compressor as well as the received thermal energy from the heat source, while retains the net cycle power output and reduces the related net cycle thermal efficiency. Increasing in the heat carrier fluid mass flow rate increases the power output from the turbine as well as the received thermal energy, maintains the power input to the compressor, thus improves both net cycle power output and net cycle thermal efficiency. Increasing in the cooling fluid mass flow rate decreases the compressor power input, increase the thermal energy recovery and the net cycle power output, while remains net thermal efficiency of the cycle. The present work is expected to provide practical guidance to the optimal design of the supercritical CO2 power systems in the future.
| Nomenclature | ||
| A | = | heat transfer area, m2; cross-sectional area of flow, m2 |
| C | = | heat capacity rate, W/K; parameter in EquationEq. (10) |
| C* | = | heat capacity ratio |
| cp | = | specific heat, J/(kg K) |
| = | integrated mean specific heat, J/(kg K) | |
| d | = | diameter, m |
| D | = | hydraulic diameter, m |
| f | = | friction factor; function |
| G | = | mass flux, kg/(m2 s) |
| HX | = | heat exchanger segment |
| h | = | heat transfer coefficient, W/(m2 K); specific enthalpy, kJ/kg |
| k | = | thermal conductivity, W/(m K) |
| L | = | length, m |
| m | = | parameter in EquationEq. (17) |
| = | mass flow rate, kg/s | |
| n | = | parameter in EquationEq. (10) |
| N | = | total segment number |
| NsT | = | total entropy generation number |
| NTU | = | number of transfer unit |
| Nu | = | Nusselt number |
| p | = | pressure, Pa; parameter in EquationEq. (21) |
| P | = | wetted perimeter of cross section, m |
| PCHE | = | printed circuit heat exchanger |
| PR | = | pressure ratio |
| Pr | = | Prandtl number |
| p | = | pressure, Pa; exponent parameter |
| Q | = | heat transfer rate, W |
| Rs | = | thermal resistance, K/W |
| Re | = | Reynolds number |
| s | = | specific entropy, J/(kg K) |
| sg | = | entropy generation rate, J/K |
| Sn | = | spacing in normal direction, m |
| Sp | = | spacing in parallel direction, m |
| T | = | temperature, K |
| U | = | overall heat transfer coefficient, W/(m2 K) |
| u | = | velocity, m/s |
| u∞ | = | incoming free stream velocity, m/s |
| w | = | width, m |
| Greek symbols | = | |
| β | = | herringbone angle, o |
| ɛ | = | effectiveness |
| η | = | efficiency |
| μ | = | dynamic viscosity, Pa·s |
| ρ | = | density, kg/m3 |
| ϕ | = | corrugation profile aspect ratio |
| Δp | = | pressure drop, Pa |
| ΔPR | = | difference of pressure ratio |
| ΔT | = | temperature difference, K |
| Subscripts | = | |
| air | = | hot air |
| c | = | cold side |
| com | = | compressor |
| h | = | hot side |
| hea | = | heater |
| i | = | segment number |
| in | = | inlet |
| isen | = | isentropic |
| l | = | laminar |
| max | = | maximum |
| min | = | minimum |
| n | = | normal direction |
| out | = | outlet |
| p | = | parallel direction |
| rec | = | recuperator |
| s | = | stainless steel |
| sc | = | supercritical CO2 |
| t | = | turbulent |
| th | = | thermal |
| tub | = | turbine |
| w | = | wall |
| wat | = | cooling water |
Acknowledgements
The authors would like to acknowledge the financial support received from the funders and industry partners. All data used are in the paper but if any additional information is required it can be obtained by contacting the corresponding author.
Conflict of Interest Statement
No potential conflict of interest was reported by the authors.
Additional information
Funding
Notes on contributors

Lei Chai
Lei Chai is a research fellow at the Institute of Energy Futures, Brunel University London. He received his BSc degree in oil and gas storage and transportation engineering in 2007 from the China University of Petroleum (East China) and his PhD degree in thermal energy engineering in 2012 from Beijing University of Technology. He has published over sixty international journal and conference papers. His research interests are in the field of CO2 power and refrigeration systems, energy storage devices and systems, heat transfer enhancement, and novel heat exchangers.

Savvas A. Tassou
Savvas A Tassou is the Director of the Institute of Energy Futures and the Director of the Center for Sustainable Energy Use in Food Chains, Brunel University London. He has over 30 years of research experience in the area of thermal and energy engineering, covering heating and cooling systems, including heat pump and refrigeration technologies. More recently, his research has also extended to waste heat recovery from industrial processes and waste heat to power conversion using innovative heat exchangers and the sCO2 heat to power cycles.
References
- Y. Ahn, et al., “Review of supercritical CO2 power cycle technology and current status of research and development,” Nucl. Eng. Technol., vol. 47, no. 6, pp. 647–661, 2015. DOI: 10.1016/j.net.2015.06.009.
- M. T. White, G. Bianchi, L. Chai, S. A. Tassou, and A. I. Sayma, “Review of supercritical CO2 technologies and systems for power generation,” Appl. Therm. Eng., vol. 185, pp. 116447, Feb. 2021. DOI: 10.1016/j.applthermaleng.2020.116447.
- L. Cheng, G. Xia, and Q. Li, “CO2 evaporation process modeling: fundamentals and engineering applications,” Heat Transf. Eng., vol. 43, no. 8–10, pp. 658–678, 2022. DOI: 10.1080/01457632.2021.1905297.
- S. A. Wright, T. M. Conboy, E. J. Parma, T. G. Lewis, and A. J. Suo-Anttila, “Summary of the sandia supercritical CO2 development program,” Sandia National Lab, Albuquerque, NM, USA, Rep. SAND2011-3375C, 2011.
- J. Pasch, M. Carlson, D. Fleming, and G. Rochau, “Evaluation of recent data from the Sandia National Laboratories closed Brayton cycle testing,” Proceedings of the ASME Turbo Expo 2016: Turbomachinery Technical Conference and Exposition, Seoul, South Korea, Jun. 13–17, 2016. DOI: 10.1115/GT2016-57620.
- L. Chordia, M. A. Portnoff, and E. Green, “High temperature heat exchanger design and fabrication for systems with large pressure differentials,” Thar Energy, LLC, Pittsburgh, PA, USA, Rep. DE-FE00024012, 2017.
- W. M. Kays, Compact Heat Exchangers– Guidance for Engineers. WS Atkins Consultants Ltd, Surrey, UK, 2000.
- L. Chai and S. A. Tassou, “A review of printed circuit heat exchangers for helium and supercritical CO2 Brayton cycles,” Therm. Sci. Eng. Prog., vol. 18, pp. 100543, Apr. 2020. DOI: 10.1016/j.tsep.2020.100543.
- J. Guo, “Design analysis of supercritical carbon dioxide recuperator,” Appl. Energy, vol. 164, pp. 21–27, Feb. 2016. DOI: 10.1016/j.apenergy.2015.11.049.
- J. Guo and X. Huai, “Performance analysis of printed circuit heat exchanger for supercritical carbon dioxide,” ASME J. Heat Transf., vol. 139, no. 6, pp. 061801, 2017. DOI: 10.1115/1.4035603.
- L. Chai and S. A. Tassou, “Numerical study of the thermohydraulic performance of printed circuit heat exchangers for supercritical CO2 Brayton cycle application,” Energy Procedia, vol. 161, pp. 480–488, Mar. 2019. DOI: 10.1016/j.egypro.2019.02.066.
- K. Nikitin, Y. Kato, and L. Ngo, “Printed circuit heat exchanger thermal–hydraulic performance in supercritical CO2 experimental loop,” Int. J. Refrig., vol. 29, no. 5, pp. 807–814, 2006. DOI: 10.1016/j.ijrefrig.2005.11.005.
- T. L. Ngo, Y. Kato, K. Nikitin, and T. Ishizuka, “Heat transfer and pressure drop correlations of microchannel heat exchangers with S-shaped and zigzag fins for carbon dioxide cycles,” Exp. Therm. Fluid Sci., vol. 32, no. 2, pp. 560–570, 2007. DOI: 10.1016/j.expthermflusci.2007.06.006.
- D. E. Kim, M. H. Kim, J. E. Cha, and S. O. Kim, “Numerical investigation on thermal–hydraulic performance of new printed circuit heat exchanger model,” Nucl. Eng. Des., vol. 238, no. 12, pp. 3269–3276, 2008. DOI: 10.1016/j.nucengdes.2008.08.002.
- W. Chu, X. Li, Y. Chen, Q. Wang, and T. Ma, “Experimental study on small scale printed circuit heat exchanger with zigzag channels,” Heat Transf. Eng., vol. 42, no. 9, pp. 723–735, 2021. DOI: 10.1080/01457632.2020.1735779.
- S. M. Lee and K. Y. Kim, “A parametric study of the thermal-hydraulic performance of a zigzag printed circuit heat exchanger,” Heat Transfer Eng., vol. 35, no. 13, pp. 1192–1200, 2014. DOI: 10.1080/01457632.2013.870004.
- S. G. Kim, Y. Lee, Y. Ahn, and J. I. Lee, “CFD aided approach to design printed circuit heat exchangers for supercritical CO2 Brayton cycle application,” Ann. Nucl. Energy, vol. 92, pp. 175–185, Jun. 2016. DOI: 10.1016/j.anucene.2016.01.019.
- S. Y. Lee, B. G. Park, and J. T. Chung, “Numerical studies on thermal hydraulic performance of zigzag-type printed circuit heat exchanger with inserted straight channels,” Appl. Therm. Eng., vol. 123, pp. 1434–1443, Aug. 2017. DOI: 10.1016/j.applthermaleng.2017.05.198.
- A. Meshram, et al., “Modeling and analysis of a printed circuit heat exchanger for supercritical CO2 power cycle applications,” Appl. Therm. Eng., vol. 109, pp. 861–870, Oct. 2016. DOI: 10.1016/j.applthermaleng.2016.05.033.
- J. S. Kwon, S. Son, J. Y. Heo, and J. I. Lee, “Compact heat exchangers for supercritical CO2 power cycle application,” Energ. Convers. Manage, vol. 209, pp. 112666, Apr. 2020. DOI: 10.1016/j.enconman.2020.112666.
- L. Chai and S. A. Tassou, “Modelling and evaluation of the thermohydraulic performance of compact recuperative heat exchangers in supercritical carbon dioxide waste heat to power conversion systems,” Heat Transf. Eng., vol. 43, no. 13, pp. 1067–1082, 2022. DOI: 10.1080/01457632.2021.1943833.
- S. S. Pitla, E. A. Groll, and S. Ramadhyani, “New correlation to predict the heat transfer coefficient during in-tube cooling of turbulent supercritical CO2,” Int. J. Refrig., vol. 25, no. 7, pp. 887–895, 2002. DOI: 10.1016/S0140-7007(01)00098-6.
- C. Dang and E. Hihara, “In-tube cooling heat transfer of supercritical carbon dioxide. Part 2. Comparison of numerical calculation with different turbulence models,” Int. J. Refrig., vol. 27, no. 7, pp. 748–760, 2004. DOI: 10.1016/j.ijrefrig.2004.04.017.
- A. Kruizenga, et al., “Heat transfer of supercritical carbon dioxide in printed circuit heat exchanger geometries,” J. Therm. Sci. Eng. Appl., vol. 3, no. 3, pp. 8, 2011. Article no. 031002. DOI: 10.1115/1.4004252.
- A. Kruizenga, H. Li, M. Anderson, and M. Corradini, “Supercritical carbon dioxide heat transfer in horizontal semicircular channels,” ASME J. Heat Transf., vol. 134, no. 8, pp. 081802, 2012. DOI: 10.1115/1.4006108.
- H. Li, et al., “Development of a new forced convection heat transfer correlation for CO2 in both heating and cooling modes at supercritical pressures,” Int. J. Therm. Sci., vol. 50, no. 12, pp. 2430–2442, 2011. DOI: 10.1016/j.ijthermalsci.2011.07.004.
- S. He, W. S. Kim, P. X. Jiang, and J. D. Jackson, “Simulation of mixed convection heat transfer to carbon dioxide at supercritical pressure,” Proc. Inst. Mech. Eng., Part C: J. Mech. Eng. Sci., vol. 218, no. 11, pp. 1281–1296, 2004. DOI: 10.1177/095440620421801101.
- S. He, et al., “A computational study of convection heat transfer to CO2 at supercritical pressures in a vertical mini tube,” Int. J. Therm. Sci., vol. 44, no. 6, pp. 521–530, 2005. DOI: 10.1016/j.ijthermalsci.2004.11.003.
- L. Cheng, G. Ribatski, and J. R. Thome, “Analysis of supercritical CO2 cooling in macro-and micro-channels,” Int. J. Refrig., vol. 31, no. 8, pp. 1301–1316, 2008. DOI: 10.1016/j.ijrefrig.2008.01.010.
- P. X. Jiang, Y. Zhang, Y. J. Xu, and R. F. Shi, “Experimental and numerical investigation of convection heat transfer of CO2 at supercritical pressures in a vertical tube at low Reynolds numbers,” Int. J. Therm. Sci., vol. 47, no. 8, pp. 998–1011, 2008. DOI: 10.1016/j.ijthermalsci.2007.08.003.
- P. Jiang, Y. Zhang, and R. Shi, “Experimental and numerical investigation of convection heat transfer of CO2 at supercritical pressures in a vertical mini-tube,” Int. J. Heat Mass Transf., vol. 51, no. 11–12, pp. 3052–3056, 2008. DOI: 10.1016/j.ijheatmasstransfer.2007.09.008.
- H. K. Versteeg and W. Malalasekera, An Introduction to Computational Fluid Dynamics: The Finite Volume Method. USA: Pearson Education, 2007.
- M. Marchionni, L. Chai, G. Bianchi, and S. A. Tassou, “Numerical modelling and transient analysis of a printed circuit heat exchanger used as recuperator for supercritical CO2 heat to power conversion systems,” Appl. Therm. Eng., vol. 161, pp. 114190, Oct. 2019. DOI: 10.1016/j.applthermaleng.2019.114190.
- Y. Jiang, E. Liese, S. E. Zitney, and D. Bhattacharyya, “Design and dynamic modelling of printed circuit heat exchangers for supercritical carbon dioxide Brayton power cycles,” Appl. Energy, vol. 231, pp. 1019–1032, Dec. 2018. DOI: 10.1016/j.apenergy.2018.09.193.
- L. Chai and S. A. Tassou, “Modelling and performance analysis of heat exchangers for supercritical CO2 power systems,” Presented at the 5th Sustainable Thermal Energy Management International Conference, Hangzhou, China, May 14–16, 2019.
- K. Brun, P. Friedman, and R. Dennis, Fundamentals, and Applications of Supercritical Carbon Dioxide (sCO2) Based Power Cycles. Cambridge, UK: Woodhead Publishing, 2017.
- J. Dyreby, S. Klein, and G. Nellis, “Design considerations for supercritical carbon dioxide Brayton cycles with recompression,” J. Eng. Gas Turb. Power, vol. 136, no. 10, pp. 101701, 2014. DOI: 10.1115/1.4027936.
- J. Yang, A. Jacobi, and W. Liu, “Heat transfer correlations for single-phase flow in plate heat exchangers based on experimental data,” Appl. Therm. Eng., vol. 113, pp. 1547–1557, Feb. 2017. DOI: 10.1016/j.applthermaleng.2016.10.147.
- A. L. London and R. A. Seban, “A generalization of the methods of heat exchanger analysis,” Int. J. Heat Mass Transfer, vol. 23, no. 1, pp. 5–16, 1980. DOI: 10.1016/0017-9310(80)90133-7.
- V. Gnielinski, “New equations for heat and mass transfer in turbulent pipe and channel flow,” Int. Chem. Eng., vol. 16, no. 2, pp. 359–368, 1976.
- A. Žukauskas, “Heat transfer from tubes in crossflow,” Adv. Heat Transfer, vol. 8, pp. 93–160, 1972. DOI: 10.1016/S0065-2717(08)70038-8.
- A. S. Wanniarachchi, U. Ratnam, B. E. Tilton, and K. Dutta-Roy, “Approximate correlations for chevron-type plate heat exchangers,” Presented at the 1995 National Heat Transfer Conference, Portland, USA, Aug. 5–9, 1995.
- E. A. Krasnoshchekov and V. S. Protopopov, “About heat transfer in flow of carbon dioxide and water at supercritical region of state parameters,” Therm. Eng., vol. 10, pp. 94, 1960.