ABSTRACT
Improving employee performance in an organization seems to cycle back and forth among six broad approaches. Rather than debate which approach is most effective, the argument is made that each approach is simply one aspect of a larger behavior system. The ultimate answer, then, is to integrate these approaches within an overarching behavior systems perspective. A potential behavior systems perspective is described as well as its implications for employee performance improvement. An expansion of OBM graduate curricula is recommended that includes more diverse improvement strategies.
SIX PERFORMANCE IMPROVEMENT STRATEGIES
The following six approaches are reasonably objective, quantifiable approaches to employee performance improvement. Non-behavioral approaches that focus on employee attitudes, commitment, self-actualization, or job satisfaction were not included in this paper. (For another categorization of approaches, see CitationWilmouth, Prigmore, and Bray, 2002.)
HUMAN RESOURCES
The basic human resources functions are job definition, hiring, orientation, training, compensation and benefits, performance reviews, promotions, and termination. Each of these functions has a substantial impact on employee performance and ultimate organizational success.
PROCESS IMPROVEMENT
Frederick Taylor's “Scientific Management” focused on work methods (CitationTaylor, 2003). Taylor believed that employees would perform well if they were provided more efficient work methods. Since Taylor's time, a number of variations on this theme have been developed and applied. Many of these applications originate in industrial engineering. However, work process has more recently found an audience in the behavioral community. Examples of behaviorists interested in work processes include CitationBrethower, (1972) CitationRummler and Brache (1995), and CitationMalott (2003).
INTERPERSONAL RELATIONS
A third approach to employee performance improvement has been to improve managers' interpersonal or leadership skills. The start point for this strategy is likely Elton CitationMayo's (1977, 1933) work at the Hawthorne plant. A conclusion drawn from this study was that how supervisors interact with subordinates is a key variable in optimizing employee performance. This view was expanded and popularized by the “industrial humanists” in the 60s and 70s including McGregor, Herzberg, Argyris, and others. An example of a behaviorist interested in supervisor—worker interpersonal relationships and leadership is Aubrey CitationDaniels (1983) and the well established “performance management” literature.
COMMUNICATIONS
A fourth view broadly focuses on communications within the organization. In this view, employee performance will improve if better information is provided. Advocates of this view may focus on providing information as a “prompt” or the focus may be on feedback. CitationPeter Drucker's management by objectives” (1958) is an example of an emphasis on providing employees specific performance objectives. Kaplan and Norton's “balanced scorecard” (1996) is a more recent example of this view.
Jack Stack's “Open Book Management” (1994), CitationDeming's statistical process control (1943), Total Quality Management, and more recently “Six Sigma” are examples of an emphasis on performance definition and feedback. Though behaviorists debate about the functional role of feedback, its impact on human performance is well established.
ORGANIZATIONAL STRUCTURE
Another viewpoint is that the structure of the organization is the key variable that determines how effectively employees perform. The “structure” typically refers to reporting relationships within the organization. A well-known theorist in this field was Max CitationWeber (1964). Examples of this strategy include matrix management, organizational reengineering, self-managed work teams, interdepartmental teams to eliminate organizational “silos,” and job enlargement and enrichment. Reorganization is a key strategy for employee performance improvement for advocates of this approach. To my knowledge, behaviorists only indirectly address this view.
PERFORMANCE PAY
Various pay schemes have been advocated as strategies for improving employee performance. CitationScanlon (1964) introduced profit sharing, which remains popular in many organizations. Gain sharing also has had wide application (CitationBinder, 1990). An example from the 80s is “Improshare.” “Goal Sharing” was popular in the 90s, but related primarily to managers. Skills-based pay, team incentives, and pay-for-performance (one-time bonuses linked to the annual performance review) have all had their advocates. Behaviorists, including this author, have investigated this strategy. A good example is the work of Bucklin and Dickinson (2001).
THE NEED FOR A SYSTEMS PERSPECTIVE
Although other strategies exist, and sometimes strategies overlap, these six are the foundation for a high percentage of employee performance improvement initiatives. Unfortunately, there are few examples of any single approach generating sustainable, high levels of employee performance that demonstrably impacted the organization's overall effectiveness. From a “systems” perspective, these results are not surprising. If we think of an automobile as a “transportation system,” should we be surprised if it fails to perform without wheels, an engine, or a drive train? It is wishful thinking to believe that one-dimensional solutions will solve complex behavior system problems.
A BEHAVIOR SYSTEMS PERSPECTIVE: DEFINING THE DEPENDENT VARIABLES
In experimentation, the “independent variable” is manipulated to produce a change in the “dependent variable.” To develop a behavior systems perspective, we first need to agree on the “dependent variable.” That is, what are we trying to change and improve? There is much talk about “organizational change,” “organizational behavior” and “organizational effectiveness.” However, a fundamental problem is that organizations don't change—the behaviors of the people in the organization do. Organizations don't behave—people do. Similarly, organizations are not effective—the people in the organization are. Neither do divisions, departments, or teams behave. Our starting point, the dependent variable for developing a behavior system, must therefore be the individual employee's behavior.
Early in my performance improvement career, I became enamored with the “standard time” approach to performance measurement used by industrial engineers. Each job was broken down into specific tasks (behaviors). The average time involved in completing the task was then determined. The number of tasks completed during the month was multiplied by the standard times to compute “earned hours” for the employee. These earned hours were compared to actual hours on the job to compute a productivity ratio. A ratio of 100% meant that the standard hours of work produced equaled the time spent producing it. Earned and actual hours were then summed to compute team, department, division and organizational productivity ratios.
In one client bank's (CitationAbernathy, 1980) operations center, there were around 150 employees. The number of standard tasks required to measure the operations center behaviors (tasks) numbered almost 1,000! Not only is such a program difficult to implement and administer, it fails to address key performance dimensions that are also critical to the organization's success (revenue, expenses, cash flow, timeliness, accuracy, safety, etc.) Task analysis also assumes that all tasks are equally important. But which salesman do we most admire? The one whose sales activity equaled time on the job, or the one who actually made a sale? A slogan I have used to describe this issue is “Busyness is not Business.”
Tom Gilbert's “performance improvement potential” (1978) defined outcomes rather than the behaviors that produced the outcomes. This was a big step forward. However, he sometimes prioritized outcomes in terms of their variability across performers or local financial return (“stakes”) rather than their importance to the overall organization's success. The problem here is that relatively small changes in some outcomes are much more significant to the organization than large changes in others.
Organizational behavior management has often fallen into the same trap. In the laboratory one behavior is no more or less valuable than another. They simply serve as convenient dependent variables to investigate independent variables of interest. To some extent, this view has carried over into field applications. However, in the “real world” some outcomes and their associated behaviors are infinitely more valuable to the organization then are others. Further, providing feedback and consequences for only one dimension of a job or target may have an adverse impact on other critical dimensions or concurrent operants (CitationFelix & Riggs, 1986).
Defining Organizational Profit Drivers
On what basis, then, do we decide which employee behaviors are important? My first premise is that the ultimate goal of a business must be to make money in a responsible way for investors, employees, vendors and customers (through lower prices). Organizations that fail to earn more than they spend eventually cease to exist (with the exception of governments where taxes are taken by force). This is a bad outcome for owners, investors, customers, employees, and government. If this ultimate goal is accepted, the behavior system engineer must determine which employee behaviors drive the organization's profitability. One of the most notable attempts to design an effective behavior system was that of CitationB. F. Skinner in his “Walden Two” (1948). Unfortunately, he prioritized results and behaviors by giving each a point value based on rather ambiguous criteria. It was never clear how Walden Two actually made a living.
This task may seem overwhelming at first. However, I have found key employee results that drive profitability can be conveniently organized into seven performance categories. These categories were arrived at inductively through an analysis of some two thousand performance measures using the statistical technique “cluster analysis” (Abernathy, 2001). The categories are sales, expense control, productivity, cash flow, regulatory compliance, customer satisfaction, and strategic projects (). These categories have been successfully applied in the design of behavior systems for all sizes and types of organizations in the U.S. and abroad. (For another type of categorization, see CitationKaplan & Norton, 1996.)
FIGURE 1. The figure depicts the 7 performance measurement categories used to design a performance scorecard.
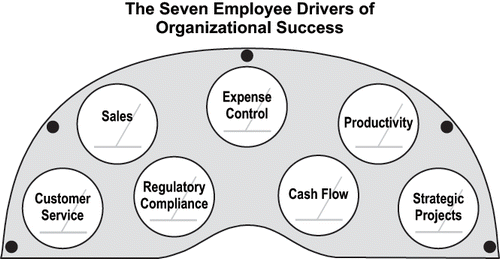
What differs across organizations is the importance of each category. For example, a fast food restaurant may have little concern with cash flow due to low inventories and cash customers. A government agency may have little opportunity to increase revenues. A software company may have little concern with regulatory compliance issues such as safety, and so on.
Each organization must first define an organizational measure or measures for each relevant category. For example, the sales category might be defined as revenue, gross profit, or strategically subdivided by current and new customers or product lines. Priority weights are then assigned to the organizational measures based upon the nature of the business, the strategy, and each measure's estimated improvement opportunity and change effort. In some cases, a category may not be relevant at all. The selected measures are then priority weighted by the organization's executive group. Rarely do line managers or workers have the information and perspective to be helpful in this process. However, the behavior systems engineer can conduct a valuable assessment in advance to provide information for the executive group's decision-making process.
I term this list of weighted organizational performance measures the “strategic scorecard.” An improvement in this scorecard's results should directly translate into improvements in either short-term or long-term profitability, assuming the strategy is effective. Of course, the organizational measures only represent ultimate objectives and do not define specific employee outcomes or behaviors. The organizational scorecard only serves as a blueprint for pinpointing critical employee behaviors. Once the system is operational, it also serves to evaluate the behavior system's effectiveness. , , and present sample charts of a hypothetical organization's strategic scorecard results in the first year of implementation.
FIGURE 2a. The figure depicts the profit and cash flow measures first year performance trends for the sample organization.
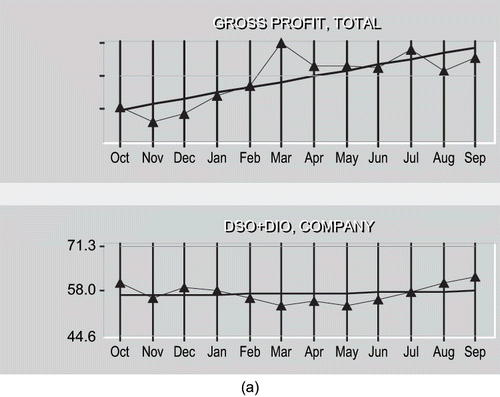
FIGURE 2b. The figure depicts the internal and external quality measures first year performance trends for a sample organization.
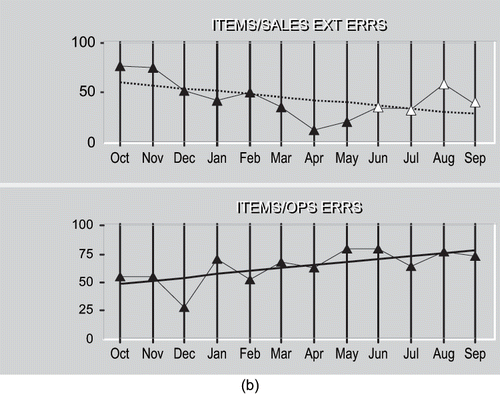
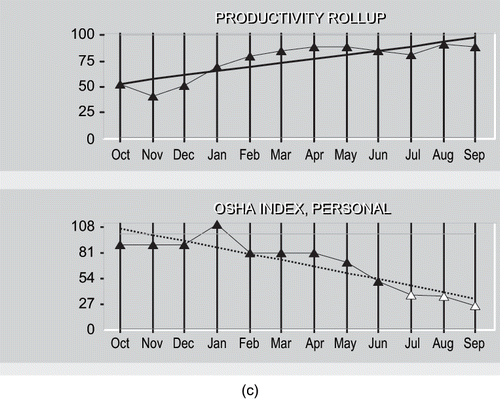
FIGURE 2c. The figure depicts the productivity and safety measures first year performance trends for an organization.
depicts the overall profit of the example company. The profit consistently improved over the 12-month period and exceeded the executive goal in the sixth month. Though the cash flow measures DSO (Days Sales Outstanding—past due accounts), and DIO (Days Inventory Outstanding—inventory turns) improved somewhat (lower is better), they returned to their initial levels by the end of the year. This lack of improvement would suggest that either the wrong employee results were measured or there were constraints on performance that had not been addressed.
tracks two components of accuracy—items per sale errors (errors that impact the customer) and items per operations error (internal quality that requires rework or produces scrap). The items per sale errors declined (got worse) for the first 7 months. The white triangles represent the implementation of an improvement plan, which tentatively appears successful. The items per operations error generally improved over the 12-month period and no improvement plan was implemented.
displays a productivity roll-up, which is a composite number derived from several departments (a bad approach to overall organizational measurement, in my opinion). However, the composite improved to near goal by the end of the 12 months, which suggests that the various departments' productivity improved. The final chart displayed in is the organization's OSHA (safety) index. It is tracked as a percentage of goal. This measure declined precipitously in the fifth month and continued to decline. The white triangles indicate an improvement plan was implemented in month nine which does not appear to have been effective.
Method of Cascading Objectives
Once the strategic scorecard is designed, the behavior system engineer must then identify the key employee outcomes that drive each organizational scorecard measure. One approach that has proven practical for the author is termed “the method of cascading objectives.” The organizational scorecard is used as a “blueprint” or guide for scorecard design sessions first with executives, then senior managers, middle managers, line managers, and workers. The method of cascading objectives promotes vertical alignment among the scorecards since each participant manager is defining subordinate measures that will drive his or her own scorecard performance.
The number and variety of participants in the design process is a tradeoff between efficiency and validity. For example, should investors, customers, vendors, or marketing experts be included in the design of the organizational scorecard? Should workers be involved in the design of their scorecards to capitalize on their firsthand knowledge and to increase employee receptivity to the measures? As more people participate, the process becomes exponentially longer. My approach has been to include only managers in the measurement system design process. The result is a very efficient and rapid design process on the order of 3 to 5 job positions per design day.
Upon completion of the design process we have a hierarchical, priority-weighted, collection of performance scorecards for executives, managers, supervisors, and workers. Performance measures may relate to personal performance, small team performance, or vertical and horizontal links to other performers and departments. The number of measures on a scorecard averages around 4 to 5. In general, the higher the organization level, the greater the number of measures.
In a few cases, these measures define specific behaviors. More often they define results that are produced by one or more behaviors. To arrive at our stated dependent variable, employee behavior, each scorecard result measure would need to be further defined in terms of the specific employee behaviors that produce the result. Doing so would bring us back to possibly thousands of behaviors in the same way task analysis does. My alternative to this miasma is to implement behavior-level measures on an ad hoc basis. The manager, worker team, and/or performance analyst identify poor or declining outcome results on the scorecard. Only then is an analysis conducted to determine the key behaviors that drive the result (don't fix what ain't broke). This is similar to CitationTom Gilbert's approach (1978), except measures are defined strategically rather than by how deficient they are. Only strategic measures are examined to determine where improvements need to be made.
If the target behavior or behaviors improve, the outcome improves, which in turn improves each successively higher organizational outcome. The more vertically linear an organization, the more direct the relationship between improvements in behavior and improvements in organizational results. In more complex organizations, several results may drive higher-level results, making it more difficult (but not impossible) to assess the impact of improvements in employee behaviors.
A BEHAVIOR SYSTEMS PERSPECTIVE: DEFINING THE INDEPENDENT VARIABLES
The independent variables are what managers and the behavior system engineer manipulate to improve each measure's performance. As discussed in the beginning of this article, there are at least 6 common strategies for performance improvement. Two of these, communications and performance pay, can be built directly into the measurement system outlined above. Simply preparing and distributing the assigned scorecards to all employees each month greatly enhances communications (though may be insufficient). Performance pay may be directly tied to scorecard results. However, I prefer to link performance pay opportunity to overall organizational profitability with each employee's allocation of the opportunity determined by his or her scorecard performance (CitationAbernathy, 2000).
In contrast to the typically high number of employee behaviors, there appears to be a finite number of improvement strategies (independent variables). An unpublished literature search by the author found the number of unique and proven improvement strategies to be around 17, depending upon how narrowly they are defined. Some of these strategies may be applied to individual employees or small teams, while others must be applied at higher levels or, in some cases, can only be implemented for the total organization.
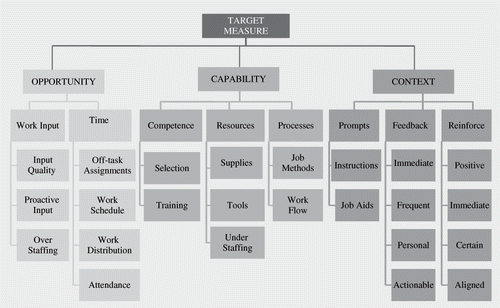
Though the number of improvement strategies (independent variables) is finite, some procedure for selecting them is still needed. Otherwise, we may find our “solutions chasing problems.” The improvement strategy selection method the author has developed (unpublished) defines performance constraints in three categories: opportunity, capability and context. The analysis typically proceeds from left to right. That is, do the employees have the opportunity to perform, do they have the capability, and does the job context facilitate and support the performance?
Each of these categories is further categorized into specific improvement strategies as illustrated in . The decision process used to pinpoint the most likely performance constraints involves looking at the variability and trend of the measure's data and a series of questions asked by the manager or behavior system engineer. For example, if the performance is cyclic, an opportunity analysis is suggested. If the performance fails to improve at all, a capability problem is suggested. If performance is declining (assuming the same staff) there may be a context issue. Each identified constraint relates to one or a few performance improvement strategies. The complete decision process and improvement strategies are outside the scope of this article. However, an example will illustrate the process.
FIGURE 3. The figure depicts a decision tree used to identify likely performance constraints for a deficient performance measure.
Performance Improvement Examples
As a consultant for Edward J. Feeney & Associates, the first client I was assigned was a restaurant located in Marin, California. It was a rapidly expanding restaurant chain with 110 locations in the U.S. and Canada. The restaurants were constructed from old train cars and the dining experience was upscale. They specialized in prime rib.
I discovered a “context” issue when I arrived at the restaurant. The wait staff was on strike and was picketing the restaurant. When I entered the restaurant, I was greeted with a poster board on the wall entitled “The Keep Your Job Contest.” The manager explained the program to me. Each waitperson's sales for the week were tallied and the names listed on the board in rank order from most to least sales. When an individual was ranked in the bottom three for two consecutive weeks, he or she was fired. Needless to say this was a context—reinforcement problem that I eliminated that day!
My next assignment was to increase the wine sales of the cocktail servers. I began by measuring wine sales per table for each server. The results were poor. I then implemented a feedback system (context solution) in which servers were informed of their sales per table at the end of each shift. This improvement plan produced negligible results. I interviewed the servers to eventually discover that the wines were French and the servers were reluctant to recommend them because they couldn't pronounce them. I conducted a training session in which each server practiced pronouncing the names. I also distributed index cards to the servers with the wines spelled phonetically. Wine sales increased dramatically. Rather than a context constraint, as I had first assumed, the constraint was capability—competence—training.
My next assignment was to increase wait staff productivity (meals/ labor hour). Once again I assumed a context constraint and implemented a productivity feedback plan in which each waiter or waitress was informed of their personal meals per labor hour at the end of each shift. Though there were changes in the relative meals per labor hour among the wait staff, there was little impact on the overall restaurant meals per labor hour. An analysis found that the staffing level and customer seating were at the root of the problem. I first developed a statistical meal-forecasting program on a microcomputer. Previously, forecasts were based on the manager's experience and hunches. The statistical forecasts proved more accurate and enabled the manager to staff the restaurant more efficiently. This performance plan addressed an opportunity—work input—overstaffing constraint.
At the end of a shift it was not possible for a waitperson to close his or her section because each section often had only one or two tables with customers. I designed a seating chart for the hostess in which different colors were marked on the chart at each hour of the shift. This enabled the hostess to seat new customers in sections where other customers had just arrived to allow some of the wait staff to close out earlier. Meals per labor hour improved significantly, as did wait staff morale, since working in a near empty section with low tip potential and at less than minimum wage was undesirable. This performance plan addresses an opportunity—time—work distribution constraint.
The final example concerns the meat carvers' prime rib “yield.” Yield was computed as pounds of prime rib served divided by pounds of prime rib purchased. The baseline yield was 41% across all 110 restaurants. This meant that only 41% of the prime rib purchased was actually sold. A 1% increase in yield generated a $300,000 annual savings for the company. All the carvers had received the same training and the variability in performance among carvers was small. On further analysis, I discovered there were multiple performances that determined the final yield. These included how the rib was stored (position and temperature), how the rib was cooked, how the carving was planned (where the first cuts were made), how accurate each slice was carved, and the customer return rate. I implemented a feedback system in which each of these yields was computed and plotted on a chart in the kitchen. The overall yield rose from 41% to 48%, a savings of $2,100,000. This performance plan was an example of resolving a context—feedback constraint.
These examples illustrate how performance constraint analysis and the selection of a performance improvement strategy utilize a combination of analyses based on actual data trends, variability, logic, and practicality. Because an organizational profit-focused performance measurement system was implemented prior to the improvement effort, we avoid the common problem of implementing improvement plans for employee behaviors that have minimal value relative to organizational profitability and survivability. We quit implementing the solution of the month or the solution with which we are familiar. Rather, we select an appropriate solution (independent variable) from an array of proven strategies based on a more molar view of behavior constraints.
SUMMARY
A behavior systems approach defines both dependent and independent organizational variables from a different perspective than Performance Management (PM). With respect to dependent variables, traditional PM defines target behaviors through an agreement with the supervisor and a baseline analysis of trend and variability. In contrast, Behavior Systems Engineering (BSE) defines outcomes in terms of their relative impact on short and long-term organizational profitability. Target behaviors are then identified on an ad hoc basis when an adverse trend or variability is detected for a key behavior system measure.
BSE expands the range of independent variables in comparison to OBM. Not all performance constraints are performance management issues. Often performance is constrained by ineffective human resource practices, poor communications, faulty staffing and processes, training and several other issues. For example, if there is not enough work to do, performance prompting, feedback, and social reinforcement will produce negligible results.
The author's recommendation for OBM is to replace the narrow didactic view of human performance in organizations with a more comprehensive systems view of the dependent and independent variables that make up an organizational environment. This adaptation in no way undermines the value of performance management and certainly must continue to be based on fundamental behavioral principles.
Without behavioral principles, these solutions become a “grab bag” of tools with no underlying structure or rationale. For this reason I propose that OBM training is simply expanded to include a few relevant courses from the business school (managerial accounting and human resources management), industrial engineering (process improvement, staffing and scheduling), I/O Psychology (job analysis and employee selection) and perhaps systems engineering. I am presently developing such a curriculum at Southeastern Louisiana University for a new masters program in I/O Psychology to begin the fall of 2008.
References
- Abernathy , W. B. 1980 . “ A bank-wide performance system ” . In Case Studies in organizational behavior management , Edited by: O'Brien , R. , Dickinson , A. and Rosow , M. 79 – 98 . New York : Prentice-Hall .
- Abernathy , W. B. 2000 . “ An analysis of the results and structure of twelve organizations' performance scorecard and incentive pay systems ” . In Organizational change , Edited by: Hayes , L. , Austin , J. , Houmanfar , R. and Clayton , M. 240 – 272 . Reno, NV : Context Press .
- Abernathy , W. B. 2000 . Managing without supervising: Creating an organization-wide performance system , Atlanta : Aubrey Daniels International .
- Binder , A. S. , ed. 1990 . Paying for productivity: A look at the evidence , Washington, D.C. : The Brookings Institution .
- Brethower , D. M. 1972 . Behavioral analysis in business and industry: A total performance system , Kalamazoo, MI : Behaviordelia .
- Daniels , A. C. and Rosen , T. A. 1983 . Performance management: Improving quality and productivity through positive reinforcement , Tucker, GA : Performance Management Publications .
- Deming , W. E. 1943 . Statistical adjustment of data , New York : John Wiley & Sons .
- Drucker , P. F. 1958 . Business objectives and survival needs, notes on a discipline of business enterprise , Chicago : University of Chicago School of Business .
- Felix , G. H. and Riggs , J. L. 1986 . Productivity by the objectives matrix , Corvalis, OR : Oregon Productivity Center .
- Gilbert , T. F. 1978 . Human competence: Engineering worthy performance , New York : McGraw-Hill .
- Kaplan , R. S. and Norton , D. P. 1996 . The balanced scorecard: Translating strategy into action , Boston : Harvard Business School Press .
- Malott , M. E. 2003 . Paradox of organizational change: Engineering organizations with behavioral systems analysis , Reno, NV : Context Press .
- Mayo , E. 1977, 1933 . The human problems of an industrial civilization , New York : Arno Press .
- Rummler , G. A. and Brache , A. P. 1995 . Improving performance: How to manage the white space on the organizational chart , San Francisco : Jossey-Bass .
- Scanlon , J. 1964 . Profits and growth , Dallas : Southwestern Graduate School of Banking, Southern Methodist University .
- Skinner , B. F. 1948 . Walden II , New York : Prentice-Hall .
- Stack , J. 1994 . The great game of business , New York : Currency Doubleday .
- Taylor , F. W. 2003 . Scientific management , New York : Taylor & Francis .
- Weber , M. and Parsons , T. 1964 . The theory of social and economic organization , New York : Free Press .
- Wilmouth , F. S. , Prigmore , C. and Bray , M. 2002 . HPT models: An overview of the major models in the field . Performance Improvement , 41 ( 8 ) : 14 – 22 .