
ABSTRACT
The empirical basis for behavior-based safety (BBS) continues to mature and provide guidance to both practitioners and companies. This paper will share the results of a recent study conducted by Cambridge University using data provided from DEKRA clients. The study involves 88 international clients who provided over 1.3 million observational data points, including monthly incident and culture survey data. The findings challenge traditional assumptions about BBS initiatives. For example, the study strongly suggests that having a limited number of “dedicated observers” is more effective than processes that encourage all employees to participate. The data also suggest that being observed once a month is more effective than more frequent observations. Further, the data illustrate how using observers familiar with tasks is more effective than using observers “with a fresh pair of eyes.” Additional data are presented on other elements of BBS along with a summary of implications for BBS practitioners.
Beginning in the early 1980s, behavioral psychology was a catalyst for numerous organizations adopting behavioral practices targeting safety improvement. These efforts applied the early concepts of behavior scientists Beth Sulzer-Azaroff, Judy Komaki, and Bill Hopkins to systematically track and improve behaviors critical to safety/injury prevention.
Behavior-based safety (BBS) has its roots in applied behavior analysis. Early researchers used behavioral techniques to control exposure to industrial hazards (Rhoton, Citation1980; Sulzer-Azaroff, Citation1978). Starting the mid-1980ʹs, researchers began documenting these techniques in reducing occupational injuries (Sulzer-Azaroff & Austin, Citation2000) and illnesses (Hopkins et al., Citation1986).
Later studies have shown that the effectiveness of BBS initiatives can sustain for many years. Hagge et al. (Citation2017) and Myers et al. (Citation2010) provided data on BBS processes lasting 14 years. Examining 73 organizations that implemented BBS, Krause and Sloat (Citation1999) demonstrated that BBS results in continuous safety improvement for five years following the initial implementation.
Research continued to suggest that BBS is often as effective as engineering controls, and more effective than common safety committee interventions (Guastello, Citation1993). While engineering controls are more effective at eliminating a single hazard, behavioral interventions are typically able to address a broader range of hazards resulting in the reduction of many types of injuries. With a relatively steady flow of case studies (Hagge et al., Citation2017; Myers et al., Citation2010), BBS is perhaps the most empirically validated approach to controlling injuries in organizational environments.
Several researchers have studied how participation, observation and feedback frequency affects the effectiveness of BBS. Chhokar and Wallin (Citation1984) looked at feedback frequency (once per week versus once per two weeks) and discovered that infrequent feedback was just as effective. Cooper (Citation2006) found a small, but non-significant relationship between observation frequency and injury rate. Lebbon et al. (Citation2012) also found a small but significant negative correlation between observation frequency and injuries. However, in that study, observation frequency did not result in significant reductions in lost workday cases.
Park et al. (Citation2019) discovered that when feedback was not very frequent, the specificity of the feedback was important to its effectiveness. However, when feedback was frequent, the quality of the feedback made no difference. These findings suggest that if an organization starts with a small number of observers, the observers should be trained well. However, as the frequency of observations increases, the level of training may not be as important.
Some practitioners have suggested that organizations try to create high levels of participation as BBS observers (McSween, Citation2005). This recommendation was strengthened by data from Alvero and Austin (Citation2004) who reported that those who conducted BBS observations improved the consistency of their own work practices, a finding they labeled the “observer effect.” In an earlier study, Lebbon et al. (Citation2012) reported that more observations produced greater reductions in injuries. However, in their 14-year study of BBS in a coal mine, Hagge et al. (Citation2017) suggest that having 30% of the employees participating as observers is sufficient to create site-wide safety improvement.
Early attempts to measure BBS
Unfortunately, other than studies on observation, participation, and feedback frequency, few researchers addressed the relative importance of the different design components of BBS. Lacking component analysis left practitioners in a position of using a “rules of thumb” measurement often derived from existing research studies, but not independently validated by research. Or, in some cases practitioners have drawn on “best practices” observed in organizations that have exemplary BBS initiatives. Both approaches make design decisions based on opinion, not science.
One study examined other components of BBS. Cooper (Citation2009) looked at a combination of published studies and data from several of his BBS clients to examine the effects of several different design elements. First, his analysis replicates other studies in demonstrating that BBS results in statistically significant reductions in injuries. He then examined various design elements, showing that conducting daily observations with feedback was more effective than conducting a single weekly observation with feedback. For organizations of different sizes, however, his work provides no guidelines on the ideal number of observations needed per employee.
Cooper (Citation2009) also compared work group observations (when an employee is observed and given individual feedback to the employees within a single work area) with individual observations and feedback. His finding suggests that work group observations are more effective in a static environment like manufacturing, than individual observations, although individual observations were more effective in dynamic environments such as construction sites. Cooper also found that using multiple feedback delivery mechanisms, such as postings, meeting reviews, electronic mail, and one-on-one discussions, are better than a single type of feedback delivery. His study showed that participative goal setting was also associated with greater incident reductions. While Cooper’s work certainly provides an initial set of empirically based guidelines, much work remains to be done.
Ineffective challenges to BBS
Since the rise of BBS, many organizations have developed or evolved BBS efforts that were not consistent with behavioral concepts. In doing so, they suffered a high rate of failure. Therefore, it is not unusual to encounter a safety professional who says their BBS process doesn’t work.
For example, Agraz-Boeneker et al. (Citation2007) presented a case study showing a BBS process that did not improve safety. An examination of their work is enlightening. Most BBS practitioners would easily identify the design problems with the BBS process worthy of investigation. Among the design problems, all of the approximately 200 employees were required to conduct one safety observation per day. Most practitioners would expect accuracy problems with forced observations, particularly at this frequency. Another factor that may have created problems was the checklist used in this BBS process. It was three pages long and included safety issues related to topics such as fire protection which were important but not directly related to the tasks being performed by the employees. Improvement plans did not address factors that were contributing to at-risk behavior. The weekly plan would target a behavior selected from the data, review that behavior in weekly safety meetings, and employees were encouraged to increase their feedback on the target behavior during their daily observations. No attempt was made to reduce exposure or change the job tasks in ways that addressed areas of concern. Finally, the process did not clearly include active involvement of managers and supervisors in support of the BBS process.
Once these issues were addressed, the organization saw safety improvement more in line with those typically reported in the literature (A. Sachambala, personal communication, October 5, 2008). Though BBS practitioners would generally identify similar problems with the failed BBS initiative, few studies demonstrate the efficacy of the factors critical to success.
Making a case For BBS
This paper, therefore, has two goals: To provide additional empirical support for BBS as an effective intervention for reducing injuries and improving safety culture; and to provide evidence on the components that strengthen the effectiveness of the BBS design.
The second goal required data analysis. The results challenged many long-held assumptions about the best way to implement BBS. In most cases, the design assumptions worked, but the data suggested that other less intuitive approaches were often more effective in reducing injuries.
Settings
DEKRA is an international consulting and inspection company. DEKRA’s safety consulting business has resulted in an extensive database with more than 3.4 million safety observations from 354 sites, and incident data from 2,154 sites. From this database, researchers selected 88 client sites that met two criteria: They had 24 months of baseline data on injuries, and they had 36 months of injury data following the implementation of a BBS process. This data set included over 1.3 million BBS observations. The clients selected for this study were distinct from those in Krause and Sloat (Citation1999). Clients in the present study used a different software package that allowed a more detailed analysis of the observations conducted within those organizations.
Behavior based safety intervention
All 88 sites adopted the Behavioral Accident Prevention Process system (BAPP®), DEKRA’s proprietary BBS process. The BAPP® system was initially designed based on traditional behavior-based principles but was quickly adapted to incorporate the Total Quality Management principles outlined by Deming (Citation2018). Finally, the system was refined based on input from safety professionals who suggested ways to further enhance the system.
The BAPP® system is implemented in a very systematic way that creates a process that is customized to meet the specific configuration and needs of the client operations. The implementation follows a traditional consultant-facilitated implementation approach and includes the components described in . One significant aspect of the implementation strategy is the training DEKRA gave to a small number of observers for the initial implementation. Additional observers were trained later (either by steering committee members or the consultant), starting with a small group of observers who were often less than 10% of the total employee population.
Table 1. The typical components of the BAPP® implementation process.
Sites were encouraged to train enough observers to achieve a contact rate of 1.0. A contact rate of 1.0 meant that the number of observations equals the number of employees. Contact rate is calculated by dividing the number of observations per month by the number of employees in the target population. In the BAPP® system, observations were a combination of one observer observing up to five employees. So, one observation could count as five observations if all five employees received feedback. Most organizations planned to have 10–20% of their employees trained in observations and feedback skills and then to engage other employees by rotating the role of observer.
Another critical element of the implementation process was software that tracked observations and organized the data to help both the steering committee and site leaders better manage the process. The software did this for the Steering Committee by allowing it to ensure that observers were doing their observations with appropriate frequency and ensuring that observations were occurring in the right areas.
Of equal importance, the data helped identify where employees were being exposed to hazards so that the steering committee and site leaders could address barriers that prevented employees from working safely and develop action plans that provided additional controls for exposures with greater potential severity. This software platform was also critical for providing the data for the assessment of the components discussed in this study.
Impact on injuries
The BAPP® process resulted in statistically significant reductions in injuries and replicated the findings of previous studies that demonstrated the effectiveness of BBS process (see for example, Krause & Sloat, Citation1999; Sulzer-Azaroff & Austin, Citation2000). shows the monthly safety performance for the participating organizations over a 24-month baseline period and for 36 months following BAPP® implementation.
Figure 1. Injuries before and after BAPP® implementation.
The BBS process resulted in an average 25% reduction in injuries the first year, a 34% reduction in injuries at the end of the second year, and a 42% reduction by the end of the third year. shows both intercept and slope statistics for injury rate for the base intervention model. The dependent variable is the number of injuries at each site. The independent variables are time, the BAPP® process, and the number of employees at each site.
Table 2. Statistical analysis showing impact of BAPP® on occupational injuries.
The tests in show the results using a Poisson distribution model as the frequency of occupational injuries is typically represented by a Poisson distribution. These data were used to create a regression model of injuries and create showing the monthly least square mean number of injuries over a 24-month baseline period and for 36 months following BAPP® implementation (unfortunately, the raw data were not readily available for this plot). The least square mean number of injuries was calculated using the following regression model:
Injuriest = EXP (BAPP®*BAPP® coeficient+Month*BAPP®Interaction coeficient+Month*Trend Coeficient +Constant Std Err)
Using the data from yields the following regression model:
Injuriest = EXP(BAPP®*.156+Month*.01+Month*.001+.3)
This equation models the injuries in month t. BAPP® is a variable that takes the value of 0 during baseline and 1 in the month where the first observation is executed at the site and all subsequent months. The Month variable goes from −24 to +36 to reflect the timeframe of the baseline and intervention. The test performed with this model is a within-site before and after comparison, controlling for a common trend and the number of workers. A variety of other models were tested, including a least squares without assuming a poison and a placebo test, to assess whether the date of intervention was different than random intervention. Another analysis was performed adding the number of employees as a factor in the regression analysis. The other statistical analyses all supported the statistical significance of these injury reductions (for additional details of these and the other statistical tests, see, Brahm et al., Citation2019). The results of these analyses show that BBS can help organizations achieve significant reductions in their injuries.
Impact on culture survey
The study also showed that BAPP® implementation has a significant impact on culture, as measured by a standardized perception survey (see, ). The Organizational Culture Diagnostic Instrument (OCDI) is a proprietary survey designed with the aid of published peer-reviewed research studies isolating dimensions that defined organizational culture and safety climate that in previous studies predicted the improvement of business and safety-relevant outcomes (Edmondson, Citation2004; Hofmann & Morgeson, Citation1998; Hofmann & Stetzer, Citation1996; Zohar, Citation2002).
Figure 2. Overall improvement in OCDI scores over 6 years during bapp® implementation.
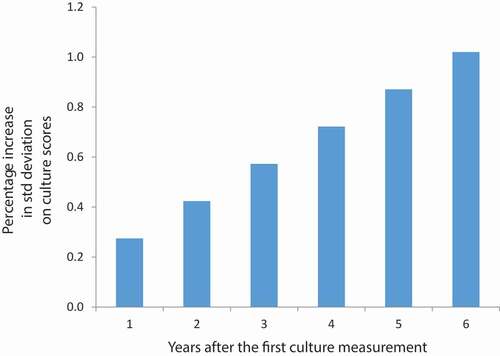
From the 88 sites participating in the BBS study, 76 sites completed multiple administrations of this perception survey, allowing for a comparison of baseline with the post-intervention safety climate. After six years, organizations showed a full standard deviation improvement in overall survey scores. presents the categories of the survey. The first six scales that predict safety performance are factors that have to do with factors important to relationship and trust building. The last three are specific to safety.
Table 3. Culture survey categories and sample content.
presents a summary of the percentile scores for the survey categories for both baseline and the final survey. These data show the rank of BAPP® clients as compared to survey norms. A percentile score of 65 means that the category score is higher than 65% of the organizations taking the survey. The data in this figure show the improvements in each of the nine categories.
Figure 3. Increases in survey scores over six years, in each category.
The overall mean raw score for the first administration ranged between 2.94 and 4.02 with an average of 3.53 (on a 5-point Likert scale). The overall mean score for the latest administration ranged from 3.11 to 4.39 and averaged 3.65. Overall, a paired samples t-test showed a statistically significant difference between the baseline and post-intervention OCDI scores, t(77) = −7.49, p < 01. Results showed a statistically significant improvement on all nine scales (p < 01). These changes suggest that employees were more willing to discuss safety in the workplace and, more broadly, that the relationships between managers, supervisors and employees improved because of the BBS implementation.
These results are important because leadership is critical to the success of behavior-based safety (Cooper, Citation2006). Leadership training was a critical component of the initial implementation, but consultants did not conduct extensive safety coaching beyond the initial workshop. Sites received a report and summary of the survey results. While the leadership teams at some locations may have aggressively worked to improve these scores, the behavior-based safety implementation was the major change in the system common to all participating organizations and therefore, likely to have driven these improvements. Sharing the survey information within the organizations is clearly a possible source of confounding in interpreting these scores and raises the question about how much resulting leadership improvements may have contributed to improvements in both safety performance and culture as measured by the survey.
Informal observation of clients with a successful BBS process suggest that BBS provides a better system for more positive and constructive leader/employee interactions. BBS often helps an organization’s safety efforts become more data driven. Leaders often point out that the employees use BBS data to help communicate with leaders about exposure to hazards, rather than just complaining about a safety issue. Employees then see leaders responding to the data by addressing the hazards. These leadership actions help employees come to trust that their leaders are serious about providing a safe place to work. Experience suggests that the more successful BBS processes create positive and collaborative effort to improve safety.
Component analysis
Frequency of observations
A monthly observation rate equal to between 16–65% of the total number of employees (between 16 and 65 observations per hundred employees each month), resulted in the greatest injury reduction. One of the critical factors when planning a BBS process is to determine the number of safety contacts per week or per month that are needed to maximize the impact of the process on injuries. Previous guidelines were based on existing research studies that generally used one observation and feedback session each week for employees engaged in work that exposed them to risk of injury (cf. McSween Citation2005).
shows data on the independent variable in this comparison, the number of observations per employee at each site implementing BBS. The implementation strategy for most participants was to expand the number of observers as the process matured so this increase is a result of increasing the number of observers ( shows the number of observations per observer remained relatively stable throughout the study).
Figure 4. The number of observations per employee across the 36 months of implementation.
The goal was to determine the tipping point, or critical mass, to create change. In other words, how many observations and feedback discussions does a population of employees need in order to have the greatest impact on their safety?
For this comparison, sites were ranked on their average contact rate (the independent variable, the number of observations per employee per month). shows the impact of contact rate on injury reduction. Previous authors (McSween, Citation2005) suggest one observation per week for each employee involved in tasks with exposure to hazards which would be a contact rate of four. Also, this metric does not provide information on the percentage of employees who have been observed but does provide a useful guide to the ratio of weekly observations to the total number of employees. The current study shows that BBS can be much more efficient with greater effectiveness by planning between one and three observations per month for every five employees (or a contact rate between 16% and 65%). These data conflict with earlier findings of Lebbon et al. (Citation2012) who reported that injuries were inversely related to the number of observations, suggesting more is better. Data in the present study suggest organizations should try to identify a frequency of observations that is both effective and efficient and that more is not necessarily better for many organizations.
Figure 5. Impact of # observations per month/# employees on injury reductions.
In thinking critically about this metric, the number of observations should not be a primary metric. Rather, contact rate should be driven by frequency of employees engaging in tasks that put them at risk. The safety contact rate may be of interest in assessing the efficiency of a process, but steering committees are better served to focus on ensuring high quality contacts (the observations and feedback). In DEKRA’s process, observers are trained to discuss their observations as part of the BBS process. The authors believe that effectiveness of the lower contact rate process may suggest that a small number of observers do more observations with discussions that are higher quality than achieved by observers in systems that encourage higher numbers of observations. These contact rate data are important, however, as they show that a higher rate of observations per employee is not necessarily better and provide a useful guideline for planning and assessing the frequency of observations for organizations of different sizes.
Observations per observer
Organizations with observers who did more observations per month had greater safety improvement than those organizations with observers who did fewer observations per month. An important element in the BBS process requires planning the number of observations that each observer should conduct each month. shows the number of observations typically performed by each observer in the client organizations participating in this study. shows the impact of this variable on injuries. In this case, sites that averaged the highest number of observations per observer had the greatest reductions in injuries. The data suggest that observers should conduct seven or more observations per month to maximize the impact of their BBS process.
Figure 6. The mean, 25th, and 75th percentiles of the number of monthly observations per observer.
Figure 7. Mean number of monthly observations per observer and impact on injuries.
In the DEKRA process, employees volunteered to participate as observers and then were expected to do observations every week. This is different from designating observers and requiring them to do observation, and it is very different than requiring all employees to do observations. In the “observations required” process, the implied consequences are negative, making the observations a “have to” process. The result is too often a focus on the quota and the BBS process becomes a paperwork exercise providing very little real value. In a voluntary process, the employee agrees to the expected target when they accept the assignment. In this case the observers are a special subset (not everyone has to do this, but a special group gets to do this) and it is easier to sustain through positive reinforcement from leaders, seeing employees work more safely, and the safety improvements resulting from their efforts. While DePasquale and Geller (Citation1999) provided data that show employees in mandatory processes reported more feedback and reported more positive views of their BBS initiatives, in DEKRA’s experience, processes that require all employees to conduct observations typically do not have the quality of content and discussion to create behavior change.
Employee participation as observers
In this study, high employee participation (as observers) resulted in fewer safety improvement than lower levels of participation (as observers). A second question in planning BBS is how many employees should participate in conducting observations. The definition of “employee participation” in this article refers to the number of employees that participate as observers relative to the total number of employees (% participation = total number of observers/total number of employees). Some practitioners (such as McSween, Citation2005) have encouraged strategies that maximize voluntary participation.
This strategy of maximizing the number of employees conducting observations was supported by research for what was later called the “observer effect,” in which employees who conducted observations were more likely to perform those safety practices themselves (Alvero & Austin, Citation2004). The “observer effect” implies that more observations are better as more employees would benefit from working more safely as a result their participation as observers.
The current research suggests that is not the case. shows the average levels of participation achieved by sites involved in the current study. The data are consistent with the implementation guidelines provided by DEKRA during BAPP® implementation: start a small group of observers, expand to between 10–20%, then expand involvement through rotation.
Figure 8. The mean, 25th and 75th percentiles of employees conducting observations (the # of observers, as a % of total employee population).
As illustrates, high participation appears to be less effective in reducing injuries. Other studies also show that BBS does not require high levels of participation. For example, Hagge et al. (Citation2017) present a case study that demonstrates how a participation rate of 30% produced a 50% reduction in injuries. In this study, organizations with between 4–8% participation using DEKRA’s implementation strategy achieved better results in injury reduction, with evidence that observer participation rates greater than 20% may not drive significant safety improvements. The data presented in are averages across the three-year implementation, so a company that achieves 40% participation in year three may well report an average of 20% across the three-year implementation. One of the constraints of this study, however, is that the high participation groups still had relatively low participation averaged across the three-year implementation (between 20–30%, as seen in ), so this finding might not hold for organizations with sustained participation rates above 40%. In contrast to the current study, others have reported effective injury reductions at much higher rates of participation. Myers et al. (Citation2010), for example, reported that higher rates of participation created greater reductions in injuries at participation above 80%. Additional research should attempt to clarify the impact of much higher levels of participation than were examined in the current study.
Figure 9. The impact of participation on occupational injuries.
In the past, some BBS consultants proposed that observers in high participation organizations did not have to do as many observations as observers in organizations with low participation rates. The study also examined this premise by comparing the group with more observations/low participation with the group that had fewer observations/higher participation. The data in shows that the group with lower participation and more observations was more effective in reducing injuries than the group with fewer observations and higher participation. These data points are, again, least square estimates of the mean number of injuries, and are therefore more orderly than the raw score means. The data set for high participation/high observations was too small to have confidence in the data, though the results appeared to fall between the groups shown in .
Figure 10. Impact of “more observations, low participation” versus “less observation, high participation” strategies and their impact on injury rates.
Tenure of observers
Rotating new employees into the observer role is more effective than having a stable group of observers who continue in the role indefinitely. Organizations planning a BBS process must also plan whether to rotate participating employees as safety observers and, if so, how often. Again, the sample was ranked based on how long observers had been conducting observations. presents the average tenure along with the top and bottom 25 percentiles. This figure shows the average number of months that an employee has been participating as an observer. Organizations that rotate their observers have observers with lower tenure as observers.
Figure 11. Average tenure of BBS observers.
compares the injury rates for sites in the top 25% (high tenure) and bottom 25% (low tenure). The figure shows that organizations that rotate their observers achieve better injury reductions than those organizations where observers remain static.
Figure12. Impact of observers’ tenure on Injuries.
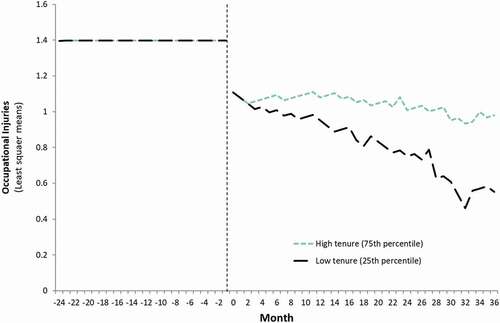
The safety improvement in shows that the high and low tenure groups begin to separate after three months. This suggests that rotating employees as soon as three months improves the effectiveness of the BBS observations. Looking at the data over the full implementation phase, however, shows that the low tenure group averages a little over a year tenure, while the high tenure group averaged over 20 months, suggesting a 12-month rotation is an effective strategy.
Participation may have been a confounding factor in these results. The low tenure group would have observers rotating out of the observer role, while new observers were trained to replace them, thus maintaining a relatively static rate of participation. The high tenure group may have added observers to the existing observers, resulting in a larger number of observers, so they may have had a higher rate of participation which may have contributed to lower injury reductions as reflected in the participation data (see, ).
Specialization by observers
Organizations planning a BBS process must also address the question of where employees conduct observations. A common design consideration is whether observers should observe work in their own areas or visit other areas where they may be less familiar with the work. Many BBS consultants historically have encouraged their clients to encourage observers to cross functional boundaries. The rationale is that employees unfamiliar with the work will bring a “new set of eyes” that will help them see risks not identified by employees familiar with the work. Anecdotal observations suggest that some clients report better communication across department lines as observers get better acquainted with those working in other areas.
shows the extent to which observers in DEKRA clients tended to stay in a single area rather than conduct observations in multiple areas. In contrast to the common “cross boundary” BBS observation processes discussed above, shows that organizations with employees that tended to observe work in a single area had greater injury reductions than organizations with observers who visited multiple areas. The implication is that observers stayed in their own work areas, but the data did not identify whether the observers were in their own area, rather it allowed assessment of the number of different areas where observers conducted observations.
Figure 13. Percent of observers specializing in one area.
Figure 14. Injury reductions in groups with high vs low observer specialization.
One hypothesis is that a “new set of eyes” may not be as much benefit as the cultural change resulting from improved relationships within the work group. Observations in a single area may be more likely to develop a reciprocal relationship between observers and their coworkers, because of repeated visits, a history of discussing concerns, and becoming better acquainted with employees in a single area. They may also develop more expertise on the safety issues due to their experience as observers focused on their own work areas, thus improving the quality of observations and subsequent discussions.
Observer use of “flags”
Organizations with observers who used one or two comment flags to help clarify causal factors on the critical behavior appear to be more effective than organizations that have observers using multiple flags during observations. They are also proven more effective compared to sites that did not use comment flags on the observation checklist (see, ). The BAPP® software had the capability to create drop-down comment flags that facilitated and standardized the information collected about critical behaviors.
Figure 15. Impact of comments on occupational injuries.
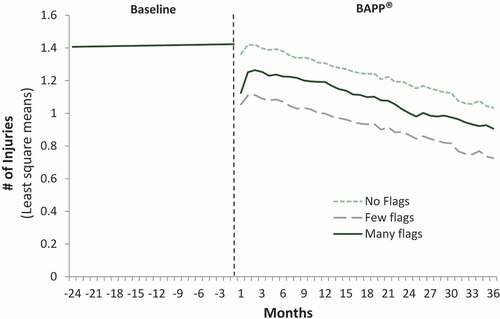
For example, the critical behavior “Is employee using fall protection when working above 6 feet” might have flags such as: “Safety harness not available in work area” and “No place to tie off with safety harness.” Both help observers provide more dynamic information to the safety committee for analysis. The observer would make notes to themselves on the observation form, then select the appropriate causal factors from the flags on the drop-down menu when they entered their data into the observation software. This process was the same whether observers entered their own data, or whether a designated employee entered the data. Flags often identified the hazard, environmental context, or barriers to safe behaviors. The flags provided data that were easily available for analysis. Other open-ended comments may have been recorded but data were not available on their use. Further research should examine whether the same holds true for well pinpointed comments by observers in a more open-ended format.
Conclusions
provides a summary of the design issues, common BBS implementation guidelines, and the implementation guidelines supported by data in the current study. While the results from the current study support these as general guidelines, care must be taken in their application. The needs and objectives of the organization should drive decisions about the design of a behavior-based safety system. For example, the current data suggest that observers should generally conduct observations in their own areas. Anecdotal observations suggest some BBS clients that encouraged crossing department boundaries reported that their observation process benefited from better communication between departments and the BBS process helped break down barriers between “silos” that previously existed.
Table 4. Old BBS implementation guidelines, often drawn roughly from earlier research, compared with design guidelines supported by the current study.
The finding that BBS initiatives with higher levels of participation were less effective in reducing injuries contrasts with what some authors (McSween, Citation2005) have promoted. In particular, the reduced effectiveness of participation in the top quintile deserved further investigation. In the current study, the highest quintile still had relatively low levels of participation and may not reflect the injury reductions achieved by organizations that start with much higher levels of participation. Again, the data for the quintiles was averaged across the three-year implementation. No effort was made to assess the impact of increasing participation across the implementation within the participating companies. This reflects the BAPP® implementation strategy that starts with a small number of well-trained observers and then expands participation. The levels of participation with this strategy remained well below those reported by other studies (cf., Hagge et al., Citation2017; Myers et al., Citation2010). DEKRA also started implementation with fewer trained observers than both Myers et. al and Hagge et al. Those studies started observations with training 20% of the employees to conduct and discuss observations. Perhaps the current participation results reflect both the lower overall participation rates and the “train-the-trainer” methodology used in DEKRA’s implementation. Additional studies should consider whether other factors, such the quality of the training and higher initial level of participation, impact the data shown in .
Organizations may implement BBS differently depending on the goals they have for their BBS process. For example, while the general design guideline suggests a small number of dedicated observers, some organizations may elect to promote broader participation to expand active employee involvement in their safety efforts. While some organizations may elect to promote broader voluntary participation early in the process, the data in the current study suggest that rotating observers more frequently may be a more effective alternative strategy for expanding employee involvement.
The current guidelines are a starting point, but practitioners should plan BBS initiatives that are built on the needs and priorities of the organization. Even with these design guidelines, the authors believe that one BBS design does not fit all organizations. While these results provide a validated approach to implementation, those designing BBS initiatives should consider them an appropriate foundation that is contingent on information about the leadership, processes, and other factors identified during an assessment conducted prior to planning the BBS initiative. Further research may well validate or expand our understanding of these guidelines and their applications.
The importance of technology in this implementation cannot be overstated. Having software to track observations was critical to this study – so critical in fact, that the research could not have been performed without it.
The software gave teams the ability to monitor their process and develop action plans to improve the BBS process and address safety issues at their site. Previous internal studies with DEKRA clients show that sites that use their data to find and address safety issues have greater injury reductions than those that fail to continually develop such action plans (a finding the needs additional empirical support). The ability to track the process also help the sites better sustain their BBS initiatives (again, an observation that needs further empirical support). The tracking software is a critical tool for both BBS steering committees and for researchers.
While the current study supports the effectiveness of BBS, such behavioral sampling strategies may not be appropriate for all organizations. While the current study did not consider this issue, some processes, such as those in the pharmaceutical industry, are designed to achieve high levels of consistency and allow little variation in work practices. Such organizations may not require a BBS process. However, even those organizations may have pockets of exposure, such as maintenance groups and contractors that may experience more variation in safety practices. For those reasons, they may still benefit from a BBS application.
For organizations with a process that allows behavioral variation, and where that variation results in injuries to employees, BBS is an empirically based practice that reflects the approach best supported by scientific data. Overall, BBS remains an effective strategy for adding an additional level of administrative controls to address hazards and reduce injuries in the workplace.
This research was initially launched as an investigation of the effectiveness of BAPP® in reducing injuries. However, the BBS process also appears to be a robust approach to culture change. The improvements in employees’ perceptions of their interactions between leaders and employees, fairness, and the other factors measured by the Organizational Culture Diagnostic Instrument, suggest that the BBS methodology is an effective approach to positive culture change.
The authors believe that the BBS methodology can be easily adapted to other areas of performance, such as improving quality or error reduction. In short, BBS appears to have many of the elements that are necessary to create a high performance organization. The collection of data on critical behaviors, involving employees in the collection and analysis of data, the use of that data to identify and address hazards and unwanted variation, and the increased use of feedback are all elements with the potential to add value beyond their use in behavior-based safety.
Acknowledgments
The authors would like to thank Francisco Brahm, Ph.D. from the London Business School for his work on the statistical analysis of the impact of BAPP® on occupational injuries.
Disclosure statement
No potential conflict of interest was reported by the author(s).
Correction Statement
This article has been corrected with minor changes. These changes do not impact the academic content of the article.
References
- Agraz-Boeneker, R., Groves, W. A., & Haight, J. M. (2007). An examination of observations and incidence rates for a behavior based safety program. Journal of SH&E Research, 4(3), 1–22. https://doi.org/10.3320/1.2758702
- Alvero, & Austin, J. (2004). The effects of conducting behavioral observations on the behavior of the observer. Journal of Applied Behavior Analysis, 37(4), 457–468. https://doi.org/10.1901/jaba.2004.37-457
- Brahm, F., Loch, C. H., & Riquelme, C. (2019). The breakdown and recovery of cooperation in large groups: Exploring the role of formal structure using a field experiment. Available at SSRN. http://dx.doi.org/10.2139/ssrn.3406682
- Chhokar, J. S., & Wallin, J. A. (1984). A field study of the effect of feedback frequency on performance. Journal of Applied Psychology, 69(3), 524–530. https://doi.org/10.1037/0021-9010.69.3.524
- Cooper, M. D. (2006). Exploratory analyses of the effects of managerial support and feedback consequences on behavioral safety maintenance. Journal of Organizational Behavior Management, 26(3), 1–41. https://doi.org/10.1300/J075v26n03_01
- Cooper, M. D. (2009). Behavioral safety interventions: A review of process design factors. Professional Safety, 54(2), 36–45.
- Deming, W. E. (2018). Out of the Crisis. The MIT Press.
- DePasquale, J. P., & Geller, E. S. (1999). Critical success factors for behavior-based safety: A study of twenty industry-wide applications. Journal of Safety Research, 30(4), 237–249. https://doi.org/10.1016/S0022-4375(99)00019-5
- Edmondson, A. C. (2004). Learning from mistakes is easier said than done: Group and organizational influences on the detection and correction of human error. Journal of Applied Behavioral Science, 40(1), 66–90. https://doi.org/10.1177/0021886304263849
- Guastello, S. J. (1993). Do we really know how well our occupational accident prevention programs work? Safety Science, 16(3–4), 445–463. https://doi.org/10.1016/0925-7535(93)90064-K
- Hagge, M., McGee, H., Matthews, G., & Aberle, S. (2017). Behavior-based safety in a coal mine: The relationship between observations, participation, and injuries over a 14-year period. Journal of Organizational Behavior Management, 37(1), 107–118. https://doi.org/10.1080/01608061.2016.1236058
- Hofmann, D. A., & Morgeson, F. P. (1998). Safety-related behavior as a social exchange: The role of perceived organizational support and leader-member exchange. Journal of Applied Psychology, 84(2), 286–296. https://doi.org/10.1037/0021-9010.84.2.286
- Hofmann, D. A., & Stetzer, A. (1996). A cross-level investigation of factors influencing unsafe behaviors and accidents. Personnel Psychology, 49(2), 307–339. https://doi.org/10.1111/j.1744-6570.1996.tb01802.x
- Hopkins, B. L., Conrad, R. J., Dangle, R. F., Fitch, H. G., Smith, M. J. and Anger, W. K. (1986) Behavioral technology for reducing occupational exposure to styrene. Journal of Applied Behavior Analysis, 19, 3–11. http://dx.doi.org/10.1901/jaba.1986.19-3
- Krause, T. R. S., & Sloat, K. J. (1999). Long-term evaluation of behavior-based method for improving safety performance: A meta-analysis of 73 interrupted time-series replications. Safety Science, 32(1), 1–18. https://doi.org/10.1016/S0925-7535(99)00007-7
- Lebbon, A., Sigurdsson, S. O., & Austin, J. (2012). Behavioral safety in the food services industry: Challenges and outcomes. Journal of Organizational Behavior Management, 32(1), 44–57. https://doi.org/10.1080/01608061.2011.592792
- McSween, T. E. (2005). The values-based safety process: enhancing your safety culture with behavior-based safety (2nd ed.) Wiley.
- Myers, W. V., McSween, T. E., Medina, R. E. R., & Alvero, A. M. (2010). The implementation and maintenance of a behavioral safety process in a petroleum refinery. Journal of Organizational Behavior Management, 30(4), 285–307. https://doi.org/10.1080/01608061.2010.499027
- Park, J., Johnson, D. A., Moon, K., & Lee, J. (2019). The interaction effects of frequency and specificity of feedback on work performance. Journal of Organizational Behavior Management, 39(3–4), 3–4, 164–178. https://doi.org/10.1080/01608061.2019.1632242
- Rhoton, W. W. (1980) A procedure to improve compliance with coal mine safety regulations. Journal of Organizational Behavior Management, 4(4), 243–249. https://doi.org/10.1300/J075v02n04_01
- Sulzer-Azaroff, B. (1978). Behavioral ecology and accident prevention. Journal of Organizational Behavior Management, 2(1), 11–44. https://doi.org/10.1300/J075v02n01_02
- Sulzer-Azaroff, B., & Austin, J. (2000). Does BBS work? Behavior-based safety in injury reduction: A survey of the evidence. Professional Safety, 45(7), 19–24.
- Zohar, D. (2002). The effects of leadership dimensions, safety climate, and assigned priorities on minor work injuries in work groups. Journal of Organizational Behavior, 23(1), 75–92. https://doi.org/10.1002/job.130