
 ?Mathematical formulae have been encoded as MathML and are displayed in this HTML version using MathJax in order to improve their display. Uncheck the box to turn MathJax off. This feature requires Javascript. Click on a formula to zoom.
Abstract
Characterizing the brain source activity using magnetoencephalography (MEG) requires solving an ill-posed inverse problem. Most source reconstruction procedures are performed in terms of power comparison. However, in the presence of voxel-specific noises, the direct power analysis can be misleading due to the power distortion as suggested by our multiple trial MEG study on a face-perception experiment. To tackle the issue, we propose a temporal autocorrelation-based method for the above analysis. The new method improves the face-perception analysis and identifies several differences between neuronal responses to face and scrambled-face stimuli. By the simulated and real data analyses, we demonstrate that compared to the existing methods, the new proposal can be more robust to voxel-specific noises without compromising on its accuracy in source localization. We further establish the consistency for estimating the proposed index when the number of sensors and the number of time instants are sufficiently large. In particular, we show that the proposed procedure can make a better focus on true sources than its precedents in terms of peak segregation coefficient. Supplementary materials for this article are available online.
1. INTRODUCTION
When stimulus information is being processed and transmitted in the brain, electrical currents, reflecting neuronal response to a stimulus, will be produced and flow through the brain because of neuron firing, which in turn generates orthogonally oriented electromagnetic fields around them in accordance with Maxwell’s equations. The electrical currents are often approximated by neural dipoles. Each dipole is determined by its location, orientation, and time-varying amplitudes (called time-courses). The magnetic fields induced by the neuronal current flow can be measured at the scalp via noninvasive brain imaging devices such as magnetoencephalography (Hämäläinen et al. Citation1993). The magnitudes of these measured fields are directly related to neuronal current strength, allowing characterization of the amplitudes of electrical brain activity on a millisecond time scale. There are many uses for the magnetoencephalography (MEG), including assisting surgeons in localizing a pathology and assisting researchers in determining the function of various parts of the brain, among others. For example, Henson et al. (Citation2011) conducted a MEG-based experiment, where a healthy young adult undergoes a series of perception judgments on faces or scrambled faces. They aimed at localizing brain regions for human face-perception. While MEG offers a direct measurement of neural activity with very high temporal resolution, its spatial resolution is low, requiring to solve an ill-posed problem of source localization in which we reconstruct source dipoles that underpin the observed magnetic fields. The problem is challenging since the observed magnetic field could result from an infinite number of possible neuronal dipoles. The purpose of this article is to address the challenge within the context of adaptive spatial filtering and to improve the analysis of the above face-perception experiment.
Various approaches can be used to tackle the above challenge. These approaches roughly fall into two categories, namely (spatially and temporarily) global methods and local (i.e., spatially local but temporally global) methods. The former includes Bayesian parametric methods while the latter takes sensor covariance-based spatial filters as special cases. The local methods can be or not be data-adaptive. In nonadaptive settings, a regularized L2 estimator of the time-course at each time-instance is used. Examples of nonadaptive methods include minimum-norm estimator and its variations (Lin et al. Citation2006). They are not data-adaptive in the sense that they can be converted to sensor covariance-based spatial filters, where the sensor covariance matrix is estimated by a forward model alone without using the data. The data-adaptive filters are essentially projection-based filters, where the goal is to look for a set of weights that project the sensor data, subjected to the minimum variance constraints (van Veen et al. Citation1997; Robinson and Vrba Citation1998; Huang et al. Citation2004). By the construction, the minimum variance beamformers are scalable to big MEG data via parallel computing, in particular when multiple trials and multiple subjects are involved. Other advantages of the beamformer methods over global methods include that there are no priori assumptions about the number of the underlying sources and that no parametric assumptions are required about background noise distributions (Hillebrand et al. Citation2005; Friston et al. Citation2006). Minimum variance beamformers (including linearly constrained minimum variance (LCMV) and synthetic aperture magnetometry (SAM) as special cases) and minimum-norm estimator (MNE) have been widely used in source localization and implemented in main neuroimaging software. See Sekihara and Nagarajan (Citation2010) for a review.
Although a number of studies have shown that the minimum variance beamformers are very useful in practice (e.g., Brookes et al. Citation2011), the following practically important issues remain to be addressed. First, in the face-perception MEG experiment, the sensor measurements are often broken into distinct blocks (termed epochs), forming multiple trial data for each stimulus. This gives rise to two different approaches to estimating the sensor covariance: (i) using the covariance of the average sensor measurements, where we average sensor measurements over trials first and (ii) using the average trial covariance, where we calculate individual trial covariances first and then average them. The applicability of these two approaches depends on types of neuronal activities to be detected (Friston et al. Citation2006). Neuronal responses to stimuli can be categorized as evoked or induced. Evoked and induced responses differ in their phase-relationships to the stimulus. Evoked responses are phase locked to the stimulus, whereas induced responses are not. In the presence of induced responses, the first approach suffers from loss of signals due to averaging sensor measurements over trials as shown in Section 3. In this case, one prefers to calculate individual trial covariances first and then average them. Unfortunately, the resulting sensor covariance estimate is often contaminated by background noises, giving a spatially blurred map of neuronal activity as shown by the first two rows of the plots in , where we applied the SAM procedure to a face-perception dataset. The high noise level has obscured the distinction between sources and noises on the map. Second, most beamforming analysis is performed in terms of power (i.e., marginal variance of the projected MEG data) comparison. However, the power index can miss temporal-correlation patterns of source time-courses as pointed out by Gross et al. (Citation2001). In the presence of strong voxel-specific noises, the power index can also give a noise-contaminated map at scalp. Under certain regularity conditions, Zhang, Liu, and Green (Citation2014) showed that the SAM can make an error in discriminating the true source from the noisy voxel when the signal-to-noise ratio (SNR) is too small to be estimated accurately.
To tackle the above issues, we need to move away our focus from a simple power analysis to a nonpower analysis. Here, we present a family of temporal autocorrelation-based beamformers (short for TABs) as a complement of the SAM approach, and develop the related theory. We propose the use of Ljung–Box statistic as a tool for summarizing the temporal information at each voxel. The Ljung–Box statistic was originally developed for measuring the deviation of a time series from white noises (Ljung and Box Citation1978). The basic premise behind the new proposal is that any interesting source signal arising from stimulus-related neuronal activities is at least nonwhite. Therefore, a good neuronal activity index should be able to capture temporal deviation from white noises, while bypassing the interference of background noises. The proposed procedure aims at identifying neuronal responses with high autocorrelations. We demonstrate that the proposed procedure can perform favorably in terms of the focus on peaks in the face-perception MEG data analysis. In particular, we identify several new patterns for neuronal responses to face and scrambled-face stimuli. Simulation studies suggest that for multiple trial data, when there exist induced responses, the average-first covariance estimation scheme can substantially deteriorate the accuracy of beamforming. The studies also show that the proposed procedure can work very well even for moderate numbers of sensors and time-instances when the MEG data are noisy. The proposed approach gives better results, in terms of localization bias, compared to standard SAM, LCMV, high-order sensor covariance-based LCMV, and depth-weighted MNE. We carry out a theoretical comparison of the proposed index with the SAM index in terms of estimation consistency and segregation coefficient in the mapping, where the segregation coefficient of a neuronal activity index at voxel r is defined as the index ratio at r and at a peak. The smaller the segregation coefficient, the better resolution (i.e., separation between sources and nonsources) is provided. Our theoretical analysis presents a clear picture of how the spatial and temporal dimensions affect the performance of the proposed procedure. We show that the estimation of the new index is consistent as the numbers of sensors and time-instances, n and J are sufficiently large (say, n ⩾ 90, J ⩾ 500, and as demonstrated in the simulations). The large J provides a better estimate of covariance matrix of n sensors, while the large n entails a more accurate source mapping based on the estimated sensor covariance. The proposed index is immunized against noises as its value is mainly determined by the SNR at each voxel. Compared to the SAM map, the new activity map can have a better segregation coefficient in some regions of interest.
The article is organized as follows. The details of the proposed beamformer estimation are provided in Section 2. The simulation studies and real data applications are conducted in Section 3. A theoretical analysis of the proposed inference procedure is provided in the Appendix. The conclusions are made in Section 4. The proofs of the theoretical results and more results on the simulations and the data analysis can be found in the online supplementary materials.
2 METHODOLOGY
Let Yi(tj) be the measurement recorded by the MEG sensor i at time tj, and Y(tj) = (Y1(tj), …, Yn(tj))T be the measurements from all n sensors at time tj, where the time points tj = j/Δ, 1 ⩽ j ⩽ J, the number of the time instants J = bΔ is determined by the time window b and the sampling rate Δ per second, and the number of the sensors n is of order hundreds. Sarvas (Citation1987) showed that the contribution of an individual source to Y(tj) can be numerically calculated by the use of a Maxwell’s equation-based forward model and that the contributions of multiple sources can be summed up linearly. Accordingly, Y(tj) can be written as
(2.1)
(2.1) where Ω is the source space (i.e., the space inside the brain), β(r, tj) is the source magnitude at location r with unknown orientation η(r), and x(r) = l(r)η(r) is a linear function of the orientation
with l(r) being an n × 3 matrix (called lead field matrix) at location r. The columns lx(r), ly(r), and lz(r) in l(r) are the noiseless output of n sensors when a unit magnitude source at location r is directed in the directions of the x, y, and z axes, respectively. The lead field matrix is known in the sense that it can be calculated by solving a set of Maxwell’s equations (Sarvas Citation1987).
To simplify model (Equation2.1(2.1)
(2.1) ), we discretize the continuous source space by a grid {r1, …, rp}, which is distributed throughout the brain. We assume that the true sources are approximately located on the sieve when the sieve is sufficiently dense (i.e., p is sufficiently large). Let β(tj) = (β1(tj), …, βp(tj))T = (β(r1, tj), …, β(rp, tj))T be the magnitude vector of the candidate sources at {r1, …, rp} and {β(rk, tj): 1 ⩽ j ⩽ J} the source time-course at rk, where the superscript T indicates the matrix transpose. Letting X = ( x1, …, xp), the model (Equation2.1
(2.1)
(2.1) ) can be discretized as follows:
(2.2)
(2.2) where 1 ⩽ p < ∞, ϵ(tj) is the background noise vector of the n sensors at time tj. The strength of the signal in the time-course βk( · ) at voxel rk is often measured by its variability
(called source power), where
is a temporal average of time-course βk( · ). In practice, the number of sensors is of order hundreds while the number of candidate sources p, around a few thousands or more, is much larger than n. When p is much larger than n, the model estimation becomes challenging as there are a diverging number of candidate models that can fit to the data.
To localize unknown sources, we propose a family of beamformers by covariance thresholding and shrinkage, which are computed in the following two steps: We first work out a sensor autocovariance estimate by thresholding and shrinkage, and then decompose it and calculate the neuronal activity index. The proposed beamformers can be extended to the setting with two stimuli: we apply the procedure to the MEG data for each stimulus, followed by calculating a log-contrast (the logarithm of the ratio of the indices under two stimuli, an F-type statistic) at each voxel. This will create a log-contrast map. The global peak on the map indicates where the maximum of the log-index increase attains for one stimulus relative to the other. The details are given below.
2.1 Estimation of Sensor Autocovariances
The sensor autocovariance matrix is often estimated by the sample version,
where
is the sample mean { Y(tj)}. For simplicity, we denote
Let the time-course βk(tj) be decomposed to two uncorrelated parts, uncontaminated time-course αk(tj) and noise ek(tj). Then, under certain conditions, we can show that
with
(2.3)
(2.3) where J0 is the number of lags considered with a default value of 20, In is the n × n unit matrix, and
are the contaminated autocovariance of the kth time-source at lag l, the autocovariance of the source noises at lag l, and the autocovariance of the sensor noises at lag l, respectively.
It has been known that the sample covariance is not a good estimator of the population covariance if its dimension n is large or if the sample covariance is degenerate (Bickel and Levina Citation2008). In MEG neuroimaging, the sensor sample covariance matrices can be nearly singular due to collinearity between nearby voxels. Here, we apply the thresholding procedure of Bickel and Levina (Citation2008) to the sensor sample covariance , obtaining
where
and the threshold level τnJ is changing in n and J. Similarly, we define the thresholded autocovariance
for l ⩾ 1. The key assumption behind covariance thresholding is that many of off-diagonal entries are zeros and the number of nonzero off-diagonal entries is growing slowly as the matrix dimension is increasing. It can be seen from the proof of Lemma 2 in the online supplemental materials that the above choice of the thresholding level gives the optimal convergence rate of
. In the field of sensor array processing, people often adopt a shrinkage approach, that is, by artificially add noise to the data to improve the mapping (Sekihara and Nagarajan Citation2010). In light of this, like in the software FieldTrip, in our implementation, if the smallest eigenvalue of the sample sensor covariance is too small, then the thresholded covariance may not be positive definite. This can be corrected by adding a small amount of noise (determined by the smallest eigenvalue of the noise covariance matrix or by the Backus-Gibert regularization) to the data (i.e., adding ε × Ip to the sample sensor covariance) after thresholding. See Huang et al. (Citation2004) for the details.
Although we mainly focus on the thresholding approach, for a comparison, we also consider the optimal shrinkage covariance estimator of Ledoit and Wolf (Citation2004), which is defined as
where
and the trace operator < A, B > =tr(ABT)/n for any n × n matrices A and B. The idea behind the above shrinkage estimator is to find the optimal weighted average of the sample covariance matrix
and the identity matrix via minimizing the expected squared loss. Under certain conditions
converges to the true covariance C as n tends to infinity, implying that
can be degenerate if C is (Ledoit and Wolf Citation2004). The autocovariance of the time-course at each grid is estimated by the autocovariance of the projected data along the weighting vector derived from the
-based SAM.
2.2 Neuronal Activity Indices
We now describe the proposed beamformers in the following two steps: We first approximate the brain space by a regular three-dimensional grid and then work out a neuronal activity index at each grid point. The index distribution is overlaid on a structural image of the subject’s brain, creating a brain source map.
2.2.1 Projection Step
For any grid point r and orientation η, let l(r) be the n × 3 lead field matrix and x = l(r)η the composite lead field vector. Given η, we derive the weighting vector by minimizing the projected power
, subject to wT x = 1. This gives
and the estimated source time-course {w(r, η)T Y(tj): 1 ⩽ j ⩽ J} at r with the power
and SAM index
the estimated autocovariance
, and the estimated autocorrelation at lag l
Finally, the optimal orientation η(r) can be estimated via maximizing the SAM index, which is equivalent to calculating the eigenvector associated with the maximum eigenvalue of the matrix
relative to
The above maximum eigenvalue is taken as the value of the conventional SAM index
at r.
2.2.2 Mapping Step
The value of the TAB index at grid point r can be calculated by using the formula
where
is the autocorrelation at lag l, that is,
When r is running over the grid,
creates a map in the brain. The maximum peak of the map gives a location estimator of one of latent sources and the corresponding latent time-course at the peak can be estimated by projecting the sensor data along the optimal beamforming weight w(r, η). We also calculate the local peaks on the transverse slices of the brain, identifying multiple sources.
2.3 Choosing Tuning Constants
Note that the tuning constant J0 in the TAB index depends on the temporal structure of the underlying time-course at each voxel. If we impose certain parametric models on time-courses, then the Akaike information criterion can be used to determine the optimal J0. However, the computation would be very expensive when we run the order selection for thousands of voxels. Here, we simply choose a large J0 so that TAB can capture temporal patterns in time-courses. For evoked and induced response, we show by simulations that the performance of TAB is not sensitive to the choice of J0 when J0 ⩾ 20. See Figure S14 in the online supplemental materials for the details.
To choose the thresholding level, we first estimate the background noise level by using the data. In practice, the MEG imaging is often run on a subject first without stimulus and then with stimulus. This allows us to calculate the sample covariance for the MEG data under stimulus as well as the sample covariance
for the prestimulus data. The latter can provide an estimator of the background noise level σ20. In light of the convergence rate of the sensor covariance matrix estimator shown in the Appendix, we set the thresholding level
with c0 being optimized over a range of values. We threshold
by τnJ, where
is the minimum diagonal element in
. There are other estimators for σ20 such as the maximum and median diagonal elements. However, any scaling effects between these estimators will be compensated for by the rescaling of c0 as tnJ depends on c0 and
only through their product. When c0 = 0, the proposed covariance estimator reduces to the standard sample covariance implemented in the software FieldTrip. To optimize c0, for each value of c0, we apply the proposed procedure to the data and obtain the maximum SAM and TAB indices:
(2.4)
(2.4) In both simulations and a real data analysis, we will show that c0 ∈ D0 = {0, 0.5, 1, 1.5, 2} has covered its useful range. We choose c0 in which the corresponding index attains maximum or minimum, which are called ma and mi, respectively. By choosing c0, ma intends to increase the maximum index value, while mi tries to reduce source interference. In the two stimuli case, we choose c0 in which the corresponding log-contrast attains maximum or minimum. The similar schemes of ma and mi can be defined for other beamformers.
3 NUMERICAL RESULTS
We begin with the following notations. For any estimator of an source location r, let the localization bias be defined as
, where
is the L1 distance between
and r. Let the maximum coherence between two locations r1 and r2, ρmax be defined by
which is a measure of collinearity between r1 and r2. In this section, we will examine the performance of the proposed beamformers under various scenarios by simulations and a real data analysis. We will consider both the thresholding-based and the optimal shrinkage-based sensor covariance estimators in calculating the neuronal activity indices for the SAM, TAB, LCMV, LCMV4 (the LCMV based on the sensor covariance matrix of order 3), and the depth-weighted MNE with weight ||l(r)||− 1 at voxel r, where ||l(r)|| is the Forbenius norm of the leads field matrix at r. See Huang et al. (Citation2004) and Lin et al. (Citation2006) for the definitions of the LCMV, LCMV4, and depth-weighted MNE procedures. In simulation studies, we will compare the TAB to the procedures SAM, LCMV, LCMV4, and depth-weighted MNE in terms of localization biases of the peak locations to the underlying sources and demonstrate that the TAB is more robust to noises than the other four procedures. We will show that the accuracy of the localization is affected by source location coherence as well as temporal correlations between sources.
3.1 Simulated Data
In the following, we will focus on finite sample scenarios with moderate values of , while a theoretical analysis will be presented for large
in the Appendix. By simulations, we will answer the following questions arising in the analysis of the face-perception experiment:
Does the TAB procedure outperform the existing procedures when heavy noises are presented in the data?
Has the TAB procedure been improved by using thresholded or shrinkage covariance estimator?
To what extent will the performance of the proposed procedure deteriorate by source location coherence and source correlations?
In the presence of induced responses, to what extent will the performance of the proposed procedure be affected by averaging multiple trial data?
For this purpose, in the simulations we considered two head models (one was produced by a real human subject while the other was based on a mathematical model) with different numbers of MEG sensors and a broad range of sources. We compared the TAB to the SAM, LCMV, LCMV4, and depth-weighted MNE. We presented only the results for J = 500 and J = 1000 due to space limitation and that the results are similar when J = 2000, 3000, and 4000. We considered four settings as follows.
Setting 1 (Single Trial Data With Evoked Responses): We created a 184-sensor MEG system (CTF/VSM) using a real adult human subject head shape, which was approximated by multiple local spheres and downloaded at http://fieldtrip.fcdonders.nl/download (see Oostenveld et al. Citation2011). We constructed 2905 regular three-dimensional grid points of resolution 1 cm within the head. These candidate source positions were aligned with the axes of the head coordinate system. A lead field matrix L (with dimension 184 × 8715) between the sensors and the grid points was then calculated by using the open software FieldTrip.
We assumed that there were two nonzero sources θ1(t) and θ2(t) located at r1 = (5, −5, 6)T and r2 = (5, 5, 6) in the front lobe of the brain (which is known to be important for syntactic processing) with the dumping cosine patterns θ1(t) = η1β1(t) and θ2(t) = η2β2(t), respectively. The L1 distance and the maximum coherence between the two sources are equal to 10 and 0.2181, respectively. Here,
otherwise, where m0, mk and fk are two factors related to time-shifts and frequencies of the cosine waves, and zk(t) ∼ AR(1), that is, zk(t) = 0.2zk(t − 1) + e(t), {e(t)} is a source-specific (white) noise process with mean 0 and variance 0.12. We generated a pair of time-courses for each of the following combinations of m0, (m1, m2) and (f1, f2): (1) m0 = 250, (m1, m2) = m0 × (1/8, 1/4) and (f1, f2) = (1, 3); (2) m0 = 250, (m1, m2) = m0 × (1/8, 1/8) and (f1, f2) = (1, 1).
Setting 2 (Single Trial Data With Phase-Locked Oscillations): It is similar to Setting 1. The details can be found in the online supplemental materials.
Setting 3 (Multiple Trial Data With Randomly Phased Oscillations and 91 MEG Sensors): Motivated by Davies-Thompson and Andrews (Citation2012), we assumed that there were two nonzero sources θ1(t) and θ2(t) located at the precuneus region r1 = ( − 5, 5, 5)T and r2 = ( − 4, −4, 8) with the random-phased oscillatory patterns θ1(t) = η1β1(t) and θ2(t) = η2β2(t), respectively. We used the same head model as in Setting 2. The L1 distance and the maximum coherence between r1 and r2 are 13 and 0.0489, respectively. The two locations have been shown to be in a face-perception region of the brain (Zhang, Liu, and Green Citation2014). Here,
Setting 4 (Three Sources With 184 MEG Sensors): It is similar to Setting 1. The details can be found in the online supplemental materials.
The pairs of signal curves β1(t) and β2(t) in these settings were plotted in Figure S1 in the online supplemental materials. From the left to right in each row, the plots were made for Setting 1(1), Setting 1(2), Setting 2, Setting 3 with a single pair of randomly phased oscillatory functions, and Setting 3 with the average of 40 randomly phased oscillatory functions, respectively. The top and bottom rows were made for the sample rates J = 500 and J = 1000, respectively. In particular, the last two plots in each row show that after averaging, the amplitudes of randomly phased oscillatory functions were reduced by 85%. Note that the temporal correlation coefficients between the paired curves in the top row are, respectively, 0.066, 0.912, 1, 1, and 1 in the top row and 0.028, 0.912, 1, 1, and 1 in the bottom row. The 10 scenarios can be categorized in two groups in terms of their temporal correlation coefficients, namely, weakly temporally correlated group and strongly temporally correlated group.
In each of Settings 1, 2, and 3, we simulated the sensor measurements at t from the model
(3.1)
(3.1) where ϵ(t) is the sensor noise vector. In Setting 4, the model is
(3.2)
(3.2) The sensors were measured at the time instants tk = bk/J, k = 0, 1, 2, …, J − 1. The signal strength (SS) in the sensor space was defined by
For each k, we sampled Nnk from an n-dimensional standard Normal Nnk and set
We considered two values of SNR, 1/202 and 1/302 in Settings 1 and 4, 1/25 and 1/0.64 in Setting 2, and 1/102 and 1/152 in Setting 3.
In each scenario of Settings 1, 2, and 4, we generated 30 independent datasets of {Y(tk), 0 ⩽ k ⩽ J − 1} paired with {ϵ(tk), 0 ⩽ k ⩽ J − 1} by models (Equation3.1(3.1)
(3.1) ) and (Equation3.2
(3.2)
(3.2) ), respectively. In Setting 3, we generated 60 × 40 independent datasets of {Y(tk), 0 ⩽ k ⩽ J − 1} paired with {ϵ(tk), 0 ⩽ k ⩽ J − 1} by model (Equation3.1
(3.1)
(3.1) ), forming 60 multiple trial datasets, with 40 trials each. For the first 30 multiple trial datasets, we estimated the sensor covariances by the strategy of calculating individual trial covariances first, followed by an average (short for “first-covariance-then-average”). For the remaining 30 multiple trial datasets, we estimated the sensor covariances by averaging the sensor measurements over trials first and then calculating the covariance of the averaged data (short for “first-average-then-covariance”). Here, we imitated a practical scenario, where the MEG imaging was run on a subject first without stimulus and then with stimulus. The former provides an estimator of the background noise level. The width b of time-window for sampling is 2 in Setting 1 and 1 in Settings 2, 3, and 4.
For each dataset, we calculated the sample covariance of {Y(tk), 0 ⩽ k ⩽ J − 1} derived from the stimulus data and the corresponding sample covariance
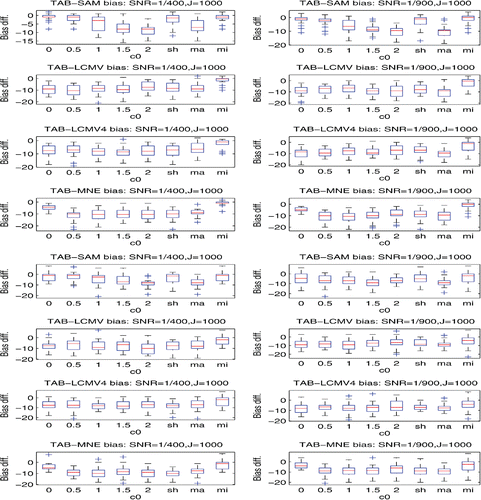
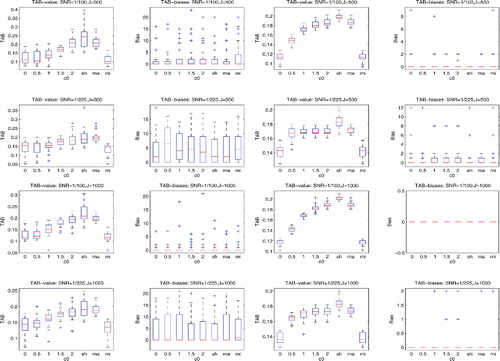
of the background noises derived from the prestimulus data. Then, for each of TAB, SAM, LCMV, LCMV4, and depth-weighted MNE, we calculated their sensor covariance estimates for each stimulus, which were indexed by c0 = 0, 0.5, 1, 1.5, 2, sh, ma, and mi. Note that, when c0 = 0, the resulting SAM, LCMV, and depth-weighted MNE reduce to their standard versions implemented in the FieldTrip. We applied the corresponding TAB, SAM, LCMV, LCMV4, and MNE procedures to each of the datasets, obtaining the TAB, SAM, LCMV, LCMV4, and MNE-based maximum location estimates, respectively. We then calculated the localization biases of these maximum location estimates to the nearest true sources over 30 datasets for these five procedures, respectively. The details of the results are displayed by the box-and-whisker plots in and , and in Figures S2– S13 in the online supplemental materials.
The results can be summarized as follows:
The results, which are displayed in the columns 2 and 4 of and also Figures S2, S5, and S11 in the online supplemental materials, demonstrate that using the sensor covariance estimators indexed by ma and sh in the TAB can offer superior source localization than that using the conventional sample covariance estimator. Similarly, ma (or mi) and sh can improve the performances of the conventional sample covariance estimator-based SAM, LCMV, LCMV4, and depth-weighted MNE. The details are omitted due to space limitations.
The results, which are shown in the right two columns of the above figures, confirm that the TAB procedure can outperform the SAM, LCMV, LCMV4, and depth-weighted MNE in terms of localization bias when the data are noisy. For instance, the first rows in show that compared to the SAM, the TAB can reduce the localization bias by around 85% when the scheme ma is used and by around 75% when the scheme sh is used.
The plots in Figures S3, S6, S8, and S12 in the online supplemental materials confirm that the source location coherence does have severe effects on localizing the true sources. For example, r2 was masked in Settings 1(1) and 1(2), whereas r1 was masked in Settings 2 and 3. The effects of source correlations are also visible. For instance, comparing the rows 2 and 4 in Figure S2 in the online supplemental materials, we can find that the localization biases are almost doubled when SNR= 1/900 and the source correlation coefficient changed from 0.066 to 0.912.
By comparing the localization bias plots in the columns 2 and 4 in , we reveal that for randomly phased multiple trial data, using the first-covariance-then-average strategy for sensor covariance estimation in the TAB can offer a less biased localization than using the first-average-then-covariance strategy. For instance, the plots at row 1 and column 2 and at row 1 and column 4 in show that the localization biases reduced to zeros when we changed the strategy from using the first-average-then-covariance to using the first-covariance-then-average.
Figure S10 in the online supplemental materials demonstrates that the TAB can perform better than the SAM, LCMV, LCMV4, and depth-weighted MNE even when adopting the first-average-then-covariance strategy in estimating sensor covariance matrix. This is not surprising because the TAB should be better than the SAM, LCMV, LCMV4, and depth-weighted MNE in detecting temporal deviation from background noises.
3.2 Face-Perception Data
We applied the proposed beamformers to six multiple trial MEG datasets acquired by Wakeman and Henson (Henson et al. Citation2011). The datasets were generated by six sessions with 146, 148, 150, 147, 148, and 148 face or scrambled face trials on a single subject, respectively. During each of the trials, a healthy young adult was presented with one exemplar of two types of visual stimuli: a face or a scrambled face. Each trial consisted of a central fixation cross (presented for a random duration of 400 to 600 ms), followed by a face or scrambled face (presented for a random duration of 800 to 1000 ms), followed by a central circle for 1700 ms. The subject used either his/her left or right index finger to report whether he/she thought the stimulus was symmetrical or asymmetrical vertically through its center. The MEG data were collected with a Neuromag VectorView system, containing a magnetometer and two orthogonal, planar gradiometers located at each of 102 positions within a hemispherical array situated in a light, magnetically shielded room. The sampling rate was 1100 Hz. Here, we analyzed the data from the 102 magnetometers only. We focused on identifying locations that showed activity increases for the faces relative to the scrambled faces.
To this end, we first created a grid system of 1 cm resolution with 1487 grid points, using the subject’s anatomical magnetic resonance imaging (MRI) data. Then, for each session we applied the neuroimaging software SPM8 to read and preprocess the recorded data, and to epoch the data for the face stimulus and the scrambled face stimulus, respectively. This gives rise to 146, 148, 150, 147, 148, and 148 epochs (i.e., trials) of 700 ms (770 time instants) with 200 ms prestimulus and 500 ms post-stimulus, which were corresponding to the six sessions, respectively. For each of the two stimuli, we calculated the averaged sample covariance over the trials by using the post-stimulus data and the corresponding averaged noise covariance
by using prestimulus data. We thresholded
by
, where n = 102, J = 551, and
is the minimum diagonal element in
. We also calculated the optimal shrinkage estimator. We reported the corresponding results to the sensor covariance estimates indexed by the three schemes c0 = 0, ma, and sh, respectively.
After the preprocessing, for each session, we applied both the TAB, SAM, LCMV, LCMV4, and depth-weighted MNE to the face dataset and the scrambled face dataset, respectively, followed by calculating the corresponding log-contrast for each of 1487 grid points. We interpolated and aligned the log-contrasts with the structural MRI of the subject. We also averaged the log-index ratios at each voxel over six sessions, interpolated, and relayed them on the structural MRI of the subject.
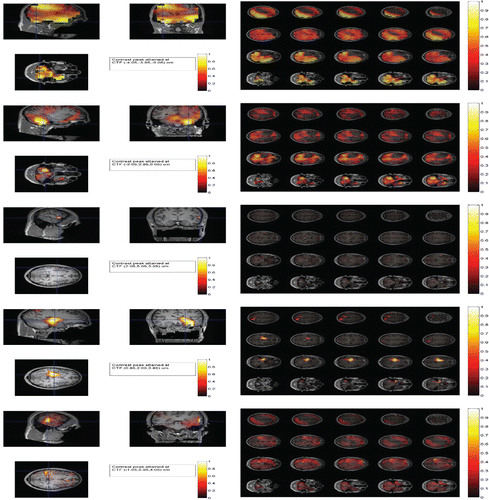
Taking Session 5 as an example, to compare the results derived from these procedures, we plotted the log-contrasts for each procedure on 20 traverse slices of the brain and on the three orthogonal slices through the peak location (i.e., maximum location estimate) in . The plots for other sessions can be found in the online supplementary materials. The plots in show a clear distinction between the SAM map (the first two rows) and the TAB map (the last two rows): The SAM gives rise to a blurred neuronal activity map due to contamination from noises, whereas the TAB produces a clean and more sensible neuronal activity map. The SAM attains the peak at the CTF coordinates ( − 4.05, −3.95, −0.05)cm, while the TAB attained the peak at the CTF coordinates ( − 1.05, 5.95, 4.05)cm. The TAB highlights much less activated areas (with light yellow colored) than does the SAM (with heavily yellow colored), suggesting a large part of the activated areas derived from the SAM may be artifacts generated by voxel-specified noises as their temporal autocorrelations are low. This agrees with the theoretical analysis in the next section. The SAM-derived global peak has failed in identifying a meaning location as the location ( − 4.05, −3.95, −0.05)cm is located in the cerebellum and not close to any known face-perception regions in the brain. In contrast, the TAB peak location ( − 1.05, 5.95, 4.05)cm is in the fusiform face area (FFA), which is well known to be a face-perception region. The LCMV4 is able to provide a focused map whereas the standard LCMV and depth-weighted MNE give slightly smeared maps. A similar phenomenon was observed in the median-nerve MEG response by Huang et al. (Citation2004). However, unlike the TAB, the LCMV4 may achieve its focus at the cost of its accuracy in terms of localization bias as implied by our simulations. See . The plots in Figures S17, S19, S21, S23, S25, S26 in the online supplemental materials show that the thresholding and shrinkage schemes perform similarly. So we focus only on the thresholding-based procedures below. To reveal the types of the estimated sources, in Figures S30– S35 in the online supplemental materials, we further estimated and plotted the time-courses at the first four local peaks by projecting the sensor measurements along the optimal beamforming vectors for the ma-based SAM and TAB, respectively. The TAB revealed that two evoked response patterns are different from those shown by the SAM. For example, for Session 5, at the location ( − 1.05, 6.95, 4.05)cm, the estimated time-course for the scrambled face is almost flat, whereas the one for the face has a dumping S-pattern in the time interval (100, 200). In particular, the TAB identified a monotone response patterns at location (7, 3, 3)cm. The time-courses derived from LCMV, LCMV4, and MNE are not presented here due to space limitations.
Similar conclusions can also be made for the other sessions by use of and its extension in the online supplemental materials. Interestingly, shows that the peak locations are varying across the sessions, due to a session-specific random effect. There are two possible explanations for the aforementioned phenomenon: i) there might be a dynamic network in the brain for face-perception. Only part of it would appear in each session and (ii) there might be a so-called habituation effect for the brain processing the stimuli, that is, in the first time when you saw a face, the brain responded in one way, but in the second, the third, or the fourth times, as you have seen the same face before, your brain lost interests and therefore responded differently. So there was a nonstationary response pattern over time, which increased the variance over sessions. However, the voxels unrelated to the network showed the same (low) level of variability over time.
Table 1 The peak locations and face-perception regions they belong to for the six runs and for the averaged log-index over the six runs. TABma and SAMma denote the TAB and the SAM when the thresholding scheme ma is used. By N/A we mean that the location is not close to any face-selective regions
Neuropsychological evidences supported that the face-perception process can involve multiple face-selective regions in human cortex such as the FFA, the occipital face area (OFA), the superior temporal sulcus (STS), the precuneus (PCu), and the amygdala (AMG) (e.g., Davies-Thompson and Andrews Citation2012). The process proceeds via a series of stages in which the OFA computes an early structural description of a face while higher-level face-selective regions such as the FFA and the anterior temporal lobe compute the invariant aspects of a face. From , we note that most of the peak locations derived from the TAB procedure are in one of these regions, whereas most of the peak locations derived from the SAM are not close to these regions. This indicates that the TAB can be a very useful tool to improve the SAM-based beamforming in practice. Compared to Henson et al. (Citation2011), we revealed several more locations with different responses to the face and the scrambled face stimuli, reflecting the neuropsychological fact that there is a dynamic network in the brain for the face-perception (Luckhoo et al. Citation2012).
4 DISCUSSION AND CONCLUSION
We have proposed a family of beamformers for inverting electromagnetic models and detecting temporally autocorrelated sources in MEG. These beamformers are local methods in the spatial domain but not in the temporal domain. The proposed neuronal activity index is different from a source stability index proposed by Hymers et al. (Citation2010), in which one needs to randomly split the source-courses into two datasets each containing half the epochs. One performs beamforming on each dataset and then checks the consistency of the results derived from the two datasets. Compared to the existing one, the new index is much easier for a theoretical analysis as it has skipped the random splitting step. The proposed beamformers are based on the thresholded sensor covariance estimator optimized over grid points , c0 = 0, 0.5, 1, 1, 1.5, 2. These points are derived from the asymptotic theory. In Figures S15 and S16 in the online supplemental materials, we have demonstrated that arbitrary chosen but dense grids perform very similar to and sometimes worse than the scheme
. This is because the grid points in
are chosen under the guidance of the theory.
In a standard beamforming analysis, active sources are often constrained to remain the same over the short time interval of interest (Gramfort et al. Citation2013). Here, to detect the evoked and induced responses, we have restricted our analysis in a short period. The implicit assumption is that the source is stationary in the analysis period. While this assumption is reasonable for the face-perception experiment, it is not a good model for nonstationary settings where multiple transient sources activate sequentially or simultaneously during a long time interval. In these settings, a varying index in time and frequency is required (Gramfort et al. Citation2013).
We have examined the performance of the proposed procedure by simulations and a real data analysis. We have also investigated the theoretical behavior of the proposed procedure in the Appendix. We have showed that the index estimation is consistent. Compared to its precedents, the proposed procedure has several advantages: It is more robust to voxel-specific noises, has a better segregation coefficient, can help reduce source localization bias, and is scalable to big MEG data. Our simulation studies have indicated that the proposed procedure can outperform the standard SAM, LCMV, high-order covariance-based procedure LCMV4, and depth-weighted MNE when the data are noisy. In particular, we have shown by using real MEG datasets that the proposed procedure can be a powerful tool for analyzing multiple trial MEG data. The main strength of TAB over traditional approaches lies in its robustness to background noises and its accuracy in detecting true sources. Unlike TAB, LCMV4 can be significantly biased to artifacts although it is robust to background noises.
There is a limitation in our theoretical analysis, where we assume the underlying sources are uncorrelated. Extending the current theory to a general setting along the lines discussed in Sekihara and Nagarajan (Citation2010) is possible but very tedious. It is beyond the scope of the current article.
The proposed methodology can be used to generate an F-type test for locations in the brain that segregates two stimulus conditions. The conventional way to estimate the null distributions is to shuffle two stimulus conditions randomly to generate a few hundred permuted datasets. We then apply the proposed procedure to each of them, calculating the corresponding permuted log-contrast at each location in the brain. At each location, we count the percentage of times that the permuted log-contrasts are larger than or equal to the observed log-contrast, which can be taken as the estimated p-values of these F-type tests. Taking Session 5 in the above face-perception experiment as an example, we obtained 500 permuted datasets by performing the Matlab command “randperm” on the stimuli of 148 trials. We applied the TAB procedure to these permuted datasets, obtaining an estimated p-value at each grid point. For instance, the estimated p-values at the first five peaks on the TAB map are 0.062, 0.072, 0.024, 0.114, and 0.044, respectively. To highlight the significant (1 − p)-values, we thresholded them by 0.9 and overlaid them on the anatomical MRI scan of the brain in Figure S36 in the online supplemental materials. The maximum (1 − p)-value 0.973 (thus the minimum p-value 0.017) attained at the location with CTF ( − 0.95, 4.95, 1.55)cm in the FFA region. An open issue with the permutation-derived null distribution is that it may be substantially biased when the face and scrambled face data were not drawn from the same distribution. This hampers multiple testing adjusting.
The proposed procedure can be thought as performing nonorthogonal principal component decomposition on the sensor covariance matrix by exploiting the second-order structure of the sample covariance space. If the sample covariance space is highly nonlinear itself, then neither orthogonal principal component analysis (PCA) nor nonorthogonal PCA is useful. However, the concept of nonlinear component decompositions such as independent component analysis (Hyvärinen, Karhunen, and Oja Citation2001) can be modified to meet the challenge.
Finally, we note that the source localization problem has arisen from other scientific research areas, including biomedicine, radar, sonar, and geophysics. See Morris et al. (Citation2011), Minsley, Sogade, and Morgan (Citation2007), and the references therein. The proposed procedure can be applicable to these areas after slight modifications.
SUPPLEMENTARY MATERIALS
The detailed proofs of the theoretical results can be found in the online supplementary materials.
Supplementary Materials
Download PDF (7.1 MB)Additional information
Notes on contributors
Jian Zhang
This is an Open Access article. Non-commercial re-use, distribution, and reproduction in any medium, provided the original work is properly attributed, cited, and is not altered, transformed, or built upon in any way, is permitted. The moral rights of the named author(s) have been asserted.Jian Zhang is Professor, School of Mathematics, Statistics and Actuarial Science, University of Kent, Canterbury, Kent CT2 7NF, United Kingdom (E-mail: [email protected]). Li Su is Senior Research Associate, Department of Psychiatry, School of Clinical Medicine, and Department of Psychology, University of Cambridge, Cambridge, UK (E-mail: [email protected]). The authors thank Professor Richard Henson, MRC Cognition and Brain Sciences Unit, Cambridge, for sharing the MEG neuroimaging data with them and for his comments on the earlier draft of the article. The authors are also grateful to the editor, an associate editor, and two reviewers for their constructive comments that have helped to improve a number of important issues. The participation of Dr. Li Su in this project was partly supported by the European Research Council under project code 230570-NEUROLEX, by Medical Research Council Cognition and Brain Sciences Unit (U.1055.04.002.00001.01), and by the NIHR Biomedical Research Centre and Biomedical Research Unit in Dementia based at Cambridge University Hospitals NHS Foundation Trust.
Li Su
This is an Open Access article. Non-commercial re-use, distribution, and reproduction in any medium, provided the original work is properly attributed, cited, and is not altered, transformed, or built upon in any way, is permitted. The moral rights of the named author(s) have been asserted.Jian Zhang is Professor, School of Mathematics, Statistics and Actuarial Science, University of Kent, Canterbury, Kent CT2 7NF, United Kingdom (E-mail: [email protected]). Li Su is Senior Research Associate, Department of Psychiatry, School of Clinical Medicine, and Department of Psychology, University of Cambridge, Cambridge, UK (E-mail: [email protected]). The authors thank Professor Richard Henson, MRC Cognition and Brain Sciences Unit, Cambridge, for sharing the MEG neuroimaging data with them and for his comments on the earlier draft of the article. The authors are also grateful to the editor, an associate editor, and two reviewers for their constructive comments that have helped to improve a number of important issues. The participation of Dr. Li Su in this project was partly supported by the European Research Council under project code 230570-NEUROLEX, by Medical Research Council Cognition and Brain Sciences Unit (U.1055.04.002.00001.01), and by the NIHR Biomedical Research Centre and Biomedical Research Unit in Dementia based at Cambridge University Hospitals NHS Foundation Trust.
Related Research Data
REFERENCES
- Barnes, G.R., and Hillebrand, A. (2003), “Statistical Flattening of MEG Beamformer Images,” Human Brain Mapping, 18, 1–12.
- Bickel, P., and Levina, E. (2008), “Covariance Regularization by Thresholding,” The Annals of Statistics, 36, 2577–2604.
- Brookes, M.J., Woolrich, M., Luckhoo, H., Price, D., Hale, J.R., Stephenson, M.C., Barnes, G.R., Smith, S.M., and Morris, P. (2011), “Investigating the Electrophysiological Basis of Resting State Networks Using Magnetoencephalography,” Proceedings of the National Academy of Sciences of the United States of America, 98, 694–699.
- Davies-Thompson, J., and Andrews, T.J. (2012), “Intra- and Interhemispheric Connectivity between Face-Selective Regions in the Human Brain,” Journal of Neurophysiology, 108, 3087--3095.
- Friston, K., Henson, R., Phillips, C., and Mattout, J. (2006), “Bayesian Estimation of Evoked and Induced Responses,” Human Brain Mapping, 27, 722–735.
- Goodnight, J.H. (1979), “A Tutorial on the SWEEP Operator,” The American Statistician, 33, 149–158.
- Gramfort, A., Strohmeier, D., Haueisen, J., Hämäläinen, M., and Kowalski, M. (2013), “Time-Frequency Mixed-Norm Estimates: Sparse M/EEG Imaging With NonStationary Source Activations,” NeuroImage, 70, 410–422.
- Gross, J., Kujala, J., Hämäläinen, M., Timmermann, L., Schnitzler, A., and Salmelin, R. (2001), “Dynamic Imaging of Coherent Sources: Studying Neural Interactions in the Human Brain,” Proceedings of the National Academy of Sciences of the United States of America, 98, 694–699.
- Hämäläinen, M., Hari, R., Ilmoniemi, R.J., Knuutila, J., and Lounasmaa, O.V. (1993), “Magnetoencephalography Theory, Instrumentation, and Applications to Noninvasive Studies of the Working Human Brain,” Review Modern Physics, 21, 413–460.
- Henson, R.N., Wakeman, D.G., Litvak, V., and Friston, K.J. (2011), “A Parametric Empirical Bayesian Framework for the EEG/MEG Inverse Problem: Generative Models for Multi-Subject and Multi-Modal Integration,” Frontiers in Human Neuroscience, 5, 1–16.
- Hillebrand, A., Sigh, K.D., Holliday, I.E., Furlong, P.L., and Barnes, G.R. (2005), “A New Approach to Neuroimaging With Magnetoencephalography,” Human Brain Mapping, 25, 199–211.
- Huang, M.X., Shih, J.J., Lee, R.R., Harrington, D.L., Thoma, R.J., Weisend, M.P., Hanlon, F., Paulson, K.M., Li, T., Martin, G.A., Miller, G.A., and Canive, J.M. (2004), “Commonalities and Differences Among Vectorized Beamformers in Electromagnetic Source Imaging,” Brain Topography, 16, 139–158.
- Hymers, M., Prendergast, G., Johnson, S.R., and Green, G. G.R. (2010), “Source Stability Index: A Novel Beamforming Based Localisation Metric,” NeuroImage, 49, 1385–1397.
- Hyvärinen, A., Karhunen, J., and Oja, E. (2001), Independent Component Analysis, New York: Wiley.
- Ledoit, O., and Wolf, M. (2004), “A Well-Conditioned Estimator for Large-Dimensional Covariance Matrices,” Journal of Multivariate Analysis, 88, 365–411.
- Lin, F., Witzel, T., Ahlfors, S.P., Stufflebeam, S.M., Belliveau, J.W., and Hämäläinen, M.S. (2006), “Assessing and Improving the Spatial Accuracy in MEG Source Localization by Depth-Weighted Minimum-Norm Estimates,” NeuroImage, 31, 160–171.
- Ljung, G.M., and Box, G. E.P. (1978), “On a Measure of a Lack of Fit in Time Series Models,” Biometrika, 65, 297–303.
- Luckhoo, H., Hale, J.R., Stokes, M.G., Nobre, A.C., Morris, P.G., Brookes, M.J., and Woolrich, M.W. (2012), “Inferring Task-Related Networks Using Independent Component Analysis in Magnetoencephalography,” NeuroImage, 62, 530–541.
- Minsley, B.J., Sogade, J., and Morgan, F.D. (2007), “Three-Dimensional Self-Potential Inversion for Subsurface DNAPL Contaminant Detection at the Savannah River Site, South Carolina,” Water Resources Research, 43, W04429.
- Morris, J.S., Baladandayuthapani, V., Herrick, R.C., Sanna, P., and Gutstein, H. (2011), “Automated Analysis of Quantitative Image Data Using Isomorphic Functional Mixed Models, With Application to Proteomics Data,” The Annals of Applied Statistics, 5, 894–923.
- Oostenveld, R., Fries, P., Maris, E., and Schoffelen, J.M. (2011), “FieldTrip: Open Source Software for Advanced Analysis of MEG, EEG, and Invasive Electrophysiological Data,” Computational Intelligence and Neuroscience, 2011, 1--9.
- Robinson, S., and Vrba, J. (1998), “Functional Neuroimaging by Synthetic Aperture Magnetometry,” in Recent Advances in Biomagnetism, eds. Yoshimoto, T., Kotani, M., Kuriki, S. Karibe, H., and Nakasato, N., Sendai, Japan: Tohoku University Press, pp. 302–305.
- Sarvas, J. (1987), “Basic Mathematical and Electromagnetic Concepts of the Biomagnetic Inverse Problem,” Physics in Medicine and Biology, 32, 11–22.
- Sekihara, K., and Nagarajan, S.S. (2010), Adaptive Spatial Filters for Electromagnetic Brain Imaging, Berlin: Springer-Verlag.
- Van Veen, B.D., Van Drongelen, W., Yuchtman, M., and Suzuki, A. (1997), “Localization of Brain Electrical Activity via Linearly Constrained Minimum Variance Spatial Filtering,” IEEE Transactions on Biomedical Engineering, 44, 867–880.
- Zhang, J., Liu, C., and Green, G. (2014), “Source Localization With MEG Data: A Beamforming Approach Based on Covariance Thresholding,” Biometrics, 70, 121–131.
APPENDIX: THEORETICAL ANALYSIS
In this Appendix, we present a theoretical analysis for the proposed beamformers when both n and J are large enough. Here, allowing n to tend to infinity is just an analytic device for finding the spatial factors that affect the performances of the proposed beamformers. We assume that there are q( ⩽ p) unknown true sources among p candidate sources in model (Equation2.2(2.2)
(2.2) ). We aim at screening for the true sources from the candidate sources by using the TAB. To make the model (Equation2.2
(2.2)
(2.2) ) identifiable, we assume the following condition:
(A1): The source processes β( · ) are temporally uncorrelated with the noise process ϵ(t). The trends α( · ) are temporally uncorrelated with the noise process e( · ) and the limits of and
exist in probability as J → ∞. The source time-courses at different voxels are asymptotically uncorrelated with each others. That is, for any fixed J0, as J → ∞,
and
exists in probability. Note that Sekihara and Nagarajan (Citation2010) gave a heuristic discussion on the performance of the SAM when the second equation does not hold.
We proceed in the following two steps. First, we consider the ideal situation where the sensor autocovariance matrices are known. Then, we investigate the asymptotic performance of the beamformer when the sensor autocovariance matrices are estimated based on the sensor measurements at J time instants. To simplify the derivation, we reparameterize the model (Equation2.2(2.2)
(2.2) ) as in Zhang, Liu, and Green (Citation2014). For the notation simplicity, we still let xk and βk( · ) stand for the lead field vector and the time-course after the reparameterization. Both the SAM index and the TAB index are invariant under this reparameterization. For any A⊆1: p = {1, 2, …, p}, define CA(l) = ∑k ∈ A xk xTkγk(l) + σ20(l)In,
. Let Ck(l) denote C1: k(l).
A.1 Beamforming With Known Sensor Autocovariances
When the sensor processes are observed over an infinite number of time instants, under the assumption (A1), the sensor autocovariance matrix Cp(l), 1 ⩽ l ⩽ h can be fully recovered. In this ideal situation, we perform beamforming directly on Cp(l), 1 ⩽ l ⩽ J0 and then reconstruct the unknown sources by using Equation (Equation2.3(2.3)
(2.3) ). For this purpose, for any grid point r in the brain, let x = x(r, η) denote
, the composite lead field vector at r with orientation η. For any two locations r and r1, define ρ( x(r, η), x1) = x(r, η)T x1/n = 1 − || x(r, η) − x1||2/(2n), which measures how close (r, η) is to (r1, η1). In fact, we can show that
where || x(r, η) − x1||2/n is the average of the squared coordinate Euclidean-distances between x(r, η) and x1. Let ρ( x, x1, y) = ρ( x, y) − ρ( x, x1)ρ( x1, x2) and LT(r) denote the theoretical TAB index at the voxel r
where γr(l) denotes the autocovariance function at r, γr = γr(0) and set γr(l)/γr = 0 when γr = 0. Note that γr(l), l ⩾ 1 are not affected by voxel-specific noises and that under condition (A1), power γr can be written as the uncontaminated power γr0 plus the voxel-specific noise level σ2e. We have
which implies that LT(r) depends on the voxel-specific SNR γr0/σ2e and that LT(r) tends to zero when σ2e is very large. This is in contrast to the SAM index, where the SAM index will tend to infinity when σ2e tends to infinity. In the following, to make the sources identifiable, we assume that
(A2): For any l(r) and l(r1) are linearly independent in the sense that for any orientations η and η1 and nonzero constant c1 with
, we have
.
A.1.1 Single Source
We first investigate the single source case (q = 1), in which a single source of nonzero power is located at r1 with orientation η1. Note that in this setting LT(r) = 0 when The following result shows that when the sensor covariance is known, the TAB-based source map can accurately recover the true source location and orientation, and the index estimation is consistent. In addition, the TAB-based map has a smaller segregation coefficient than does the SAM when n is sufficiently large.
Proposition A.1.
Under Conditions (A1) and (A2), TAB(r) attains the maximum uniquely at r1 and tends to zero in a rate of (n(1 − ρ( x(r, η(r)), x1)2))− 2 for . And for r = r1,
when n is large enough. Furthermore, the segregation coefficient at location r admits
Remark A.1.
When n(1 − ρ( x(r, η(r)), x1)2) is large, the segregation coefficient at r has the rate of O((n(1 − ρ( x(r, η(r)), x1)2))− 2). Note that Zhang, Liu, and Green (Citation2014) showed that the SAM index also attains the maximum at the true source location r1 with the segregation coefficient at location r,
In particular, when n(1 − ρ( x(r, η(r)), x1)2) is large, the corresponding segregation coefficient has the rate of O(1/n). Therefore, the TAB-based map can outperform the SAM in segregating the true source r1 from r when n(1 − ρ( x(r, η(r)), x1)2) is large enough. Furthermore, the SAM map is less smoother than the TAB map in terms of their full width half maximums (Barnes and Hillebrand Citation2003). In fact, the full width half maximums (FWHMs) around r1 for the SAM and the TAB can be, respectively, calculated by solving the equations SAM(r)/SAM(r1) = 1/2 and TAB(r)/TAB(r1) = 1/2, which are equivalent to solving
respectively. This proves that the SAM has a much smaller FWHM than does the TAB if we note that n(1 − ρ( x(r, η(r)), x1)2) is the squared distance between x(r, η(r)) and x1.
A.1.2 Multiple Sources
We assume that there exist q unknown sources located at rk, 1 ⩽ k ⩽ q with orientations ηk, 1 ⩽ k ⩽ q, respectively. We investigate the case where the underlying source locations are asymptotically separated in the so-called lead field distance. Let x and y denote the composite lead field vectors at locations rx and ry with orientation ηx and ηy, respectively. Let We define the notations of partial correlations of sources ayx|k, byx|k, cyx|k, 1 ⩽ k ⩽ q in the online supplemental materials and introduce a regularity condition for identifying the underlying sources below.
For any 1 ⩽ j ⩽ q, we rearrange the sequences ( x1, γ1), …, ( xq, γq) into a new order, namely, ( x1, γ1), …, ( xj − 1, γj − 1), ( xj + 1, γj + 1), …, ( xq, γq), ( xj, γj) and recalculate the corresponding values of aqq|(q − 1) and bqq|(q − 1) for this new sequence. These two new values are denoted by ajj|[ − j] and bjj|[ − j], respectively. When a(k + 1)(k + 1)|k’s are positive, ajj|[ − j] is also positive. We call ajj|[ − j] the correlation factor of the jth source with the remaining sources. Let anq = nmin 1 ⩽ k ⩽ q − 1a(k + 1)(k + 1)|k.
We say that the source locations (and orientations) are asymptotically separable if they satisfy the condition
It follows from the definition that byx|q = O(1) if max 2 ⩽ k ⩽ qakx|(k − 1)/akk|(k − 1) = O(1) and max 2 ⩽ k ⩽ qayk|(k − 1)/akk|(k − 1) = O(1) (i.e., given { x1, …, xk − 1}, the partial regression coefficients of x and y with respect to xk are bounded). In particular, if max 2 ⩽ k ⩽ qakk|(k − 1) is bounded below from zero as n tends to infinity, then the above partial regression coefficients are bounded and thus byx|q = O(1). Let km = 0 if anq → ∞ and km = min {1 ⩽ k ⩽ p − 1: na(k + 1)(k + 1)|k = O(1)} if anq = O(1). Under assumption (A3), we can show that cjj|q, 1 ⩽ j ⩽ q are bounded by the definition.
Imposing the condition that anq → ∞ as n → ∞ is equivalent to say that for any λ > 0, the maximum partial coherence of xk, 1 ⩽ k ⩽ p is bounded above by 1 − λ/n for a large n. Note that if anq → ∞, then all a(k + 1)(k + 1)|k are positive when n is large enough. Therefore, xk, 1 ⩽ k ⩽ q are linearly independent for a large n because the inverse of the matrix can be obtained by iteratively performing sweep operations (q − 1) times on the matrix. See Goodnight (Citation1979).
The following theorem shows that if max 1 ⩽ j ⩽ qmax 2 ⩽ k ⩽ qakj|(k − 1)/akk|(k − 1) = O(1) (i.e., the partial regression coefficients of { xj} are bounded), then anq → ∞ is sufficient for the theoretical TAB index to be consistently estimated. In particular, the estimation biases are of order (anq)− 1. We now describe our general mapping theorem as follows.
Theorem A.1.
Under assumption (A3), for 1 ⩽ j ⩽ q, the TAB index admits
In particular, when q = 2, we have
For any voxel rx, if LT(rx) = 0, then TAB(rx) = 0. Otherwise, if naxx|q → ∞ (i.e., x is asymptotically separable from the true sources), then
And the segregation coefficient at rx with respect to {rj: 1 ⩽ j ⩽ q},
Remark A.2.
The above theorem indicates that the proposed index estimation is consistent with the underlying index when n is large enough and can have a better segregation coefficient when min jna2xx|q/ajj|q → ∞ as n → ∞. The last point follows from the fact that under assumption (A3),
See Zhang, Liu, and Green (Citation2014).
A.2 Beamforming With Estimated Sensor Autocovariances
To derive a convergence result for as both n and J tend to infinity, we reformulate the model (Equation2.2
(2.2)
(2.2) ) as
By the definition, we have E[ zi(t)] = 0. Let
and
. Define the mixing coefficient
We need to impose more regularity conditions on the above model as follows.
(A4): For 1 ⩽ i ⩽ n, zi(t) is stationary and ergodic. There exist positive constants κ1 and τ1 such that for any u > 0,
(A5): For k ⩾ 0, .
(A6):
exists and
Conditions (A4) and (A5) are required to prove the uniform ergodic results for zi(t) and zi(t) zj(t). Condition (A6) can be verified when we take φi(t) as a trajectory sampled from a stationary process similar to the processes zi(t), 1 ⩽ i ⩽ n.
In the following theorem, we let γr(l) and γr denote the autocovariance function and variance at voxel r, respectively. We provide a convergence result for the estimation of the TAB index as follows. The result can be straightforwardly extended to the index-ratio.
Theorem A.2.
Under conditions (A1)∼(A6), if , then for 1 ⩽ j ⩽ q,
as n and J tend to infinity. For voxel rx with naxx|q → ∞,