Abstract
Background: Short-duration electroencephalography (EEG) recordings in horses are helpful in diagnosing intracranial disorders. Potentially, long-duration ambulatory EEG (AEEG) recordings in horses will enhance the chance of detecting abnormal brain activity independent of the presence of an insult.
Objective: The objective of this study was to test if AEEG recordings in unsedated horses can be acquired and benefit diagnosing abnormal brain activity.
Animals and methods: Recordings were taken from 8 adult control horses and 10 patients suspected of intracranial abnormalities. Self-adhesive electrodes and the ‘Porti-5’ recording system were used. Filter settings were 0.5 Hz high pass and 35 Hz low pass. The records were analysed offline at a 50–200 μV/division and 10 seconds/division scale. Abnormal activity was defined as a spike or sharp wave, a period of generalised slow wave rhythmical activity or a generalised fast rhythmical discharge. The recording time ranged from 5 to 49 hours.
Results: In the control group, one horse showed pathological activity. In the patient group, six out of nine horses showed abnormal activity during the recordings. Magnetic resonance imaging confirmed the presence of an intracranial mass in one patient. Long-term recordings of high quality can be obtained in unsedated horses by allowing daily activity using AEEG, resulting in a reasonable chance of recording (inter)ictal abnormal brain activity indicating epileptic or seizure-like activity in the absence of clinical signs or seizures.
Conclusions: It is concluded that abnormal behaviour can be expressed intermittently, and with the availability of AEEG a useful tool is added to the diagnostic scenario for horses.
1. Introduction
In horses, electroencephalography (EEG) has been applied for decades (Purohit et al. Citation1981; Mysinger et al. Citation1985) and is used to diagnose, locate and define possible intracranial abnormalities, for example, epilepsy (Lacombe et al. Citation2001; Kaplan Citation2004; Noachtar & Rémi Citation2009; Lacombe et al. Citation2011; Moeller et al. Citation2011; Seneviratne et al. Citation2012). A differentiation between partial (focal) and generalised epileptic seizures can be made and the effect of treatment can be monitored (Stern Citation2005; Noachtar & Rémi Citation2009). Finding interictal epileptiform discharges (IEDs) in EEG helps to differentiate between epileptic and other non-epileptic paroxysmal attacks (Noachtar & Rémi Citation2009).
EEG is performed routinely for diagnostic and pre-surgical procedures in human and veterinary patients suffering from epilepsy (Sheridan & Sato Citation1985; Binnie & Stefan Citation1999; De Lahunta Citation2001; Robinson et al. Citation2003; Noachtar & Rémi Citation2009), and AEEG has been available for decades (Ebersole Citation1987; Deeny et al. Citation2003; Brigo Citation2011; Kennett Citation2012). The improvement in modern technology facilitates continued recordings simultaneous with video registration of behaviour and optimises analysis (Deeny et al. Citation2003; Brigo Citation2011; Kennett Citation2012). The chances that (inter)ictal abnormal brain activity is detected are enhanced greatly (Ebersole Citation1985, Citation1987) if long-lasting recordings can be made while the patients express normal daily activity (Binnie & Stefan Citation1999; Overvliet et al. Citation2010; Brigo Citation2011; Moeller et al. Citation2011; Kennett Citation2012). It proved to be useful to rule out unrecognised seizures (Tatum IV Citation2001) or to detect an increase in slower frequency rhythms that can indicate a disruption of cortical thalamic connections as a result of brain injury (Moeller et al. Citation2011).
Since 2005, digital AEEG with simultaneous video has become routinely available (Binnie & Stefan Citation1999; Brigo Citation2011) enabling long-lasting recordings of up to 72 hours while the individual is able to express normal daily activity as well as sleep. It further enhances the capture of pathological activity (Binnie & Stefan Citation1999; Noachtar & Rémi Citation2009; Moeller et al. Citation2011).
The hypotheses tested in this study were as follows: (1) as in humans, this technique can be applied to horses and will generate recordings that can be interpreted and (2) abnormal brain activity in equine patients with abnormal behaviour can be identified that might suggest the presence of intracranial abnormalities and/or epilepsy.
2. Material and methods
2.1. Horses
The control group consisted of seven clinically healthy Royal Dutch Sport horse mares and one Friesian gelding; mean age: 12.1 ± 3.4 (SD) years (range: 7–17 years), belonging to the teaching herd of the Faculty of Veterinary Medicine of Utrecht University. The patient group () consisted of 10 horses, 6 mares and 4 geldings; mean age: 15.8 ± 6.9 years (range: 4–31 years). Inclusion criteria were absence of extracranial disease as judged by European College of Equine Internal Medicine (ECEIM) diplomates based on clinical examination, haematological and biochemical blood analysis together with abnormal behaviour of unknown origin or epileptic-like insults as judged by their veterinarian and European College of Equine Internal Medicine (ECEIM) diplomates. The abnormal behaviour was seen either on video or at the clinic. One patient was recorded at home since she had frequent and severe attacks of tonic–clonic convulsions and travelling was contraindicated. She walked freely in the riding arena during the recording period. Five horses were shaved using 0.25–0.5 ml Domosedan® i.v. (detomidine 10 mg/ml, Orion Pharma, Espoo, Finland) the day before the recordings started. During the recordings, the horses were stabled and allowed daily walking exercise. In two patients and one control horse, a magnetic resonance imaging (MRI) was made under generalised anaesthesia based on the EEG results, suggesting presence of intracranial abnormalities. In the other horses MRI was not performed because of costs involved.
Table 1. Patient details.
The study was approved by the Committee of Animal Welfare, Utrecht University.
2.2. Equipment
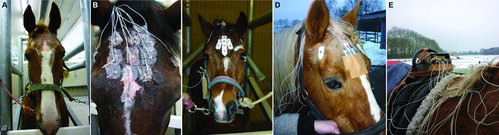
Shielded cables, reusable connector leads (Medi Factory BV, Nieuwkoop, the Netherlands) and disposable centre snap rectangle electrodes (Nicolet VIASYS healthcare, Madison, WI, USA) were attached to the horse's forehead and connected to a portable battery-operated ambulatory recording device ‘Porti-5’ (TMS International, Enschede, the Netherlands) and equipped with a memory card belonging to the system for recording and processing (). The card was initialised and programmed on a separate computer. After recording, the memory card was placed into a normal computer that converts the signals into continuous graphic recordings allowing for analysis of the recordings.
Figure 1. AEEG equipment. (a) Shaved forehead, (b) electrodes glued on with collodium, (c) electrode stickers placed on the forehead and (d) on the temporal bone and (e) recording box underneath the metal protection bar. The cables are braided through the manes and loosely connected to the box to enable free movement of head and neck without pulling on the cables.
2.3. System settings and electrode combinations
A composition was made from 13 electrodes as shown in . Several electrode combinations were made in order to localise abnormalities. The sampling rate was 100 Hz. The electrical differences between two electrodes were graphically visualised on the computer screen. The high-pass filter was 0.5 Hz, whereas the low-pass filter was 35 Hz according to the instructions of the Leiden University Hospital. The reference electrode was unipolar.
Table 2. Compositions used in the controls and patients.
2.4. Electrode positioning
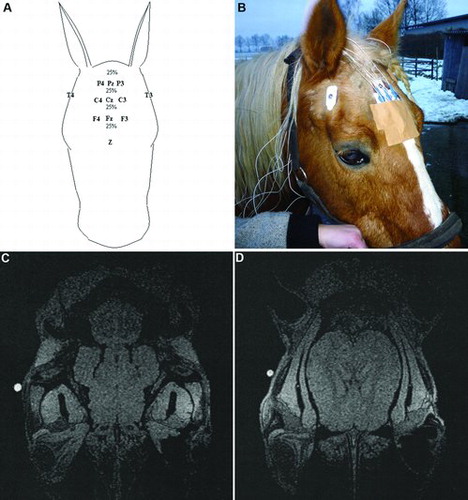
EEG electrodes are named after anatomical location on the skull ( and (a)). The electrodes on the right hemisphere have even numbers, the ones on the left hemisphere have odd numbers and the middle electrodes have the subscript ‘z’. To optimise the electrode position on the scalp in relation to the anatomical position of the brain, a post-mortem MRI scan of a horse's head was made ((c) and (d)). Nine radio-opaque gelatine capsules were glued to the scalp on anatomical positions that should, according to the literature, correlate with brain positioning (Nickel et al. Citation1975; Konig & Liebich Citation2007). The distance of the top of the forehead to the supraorbital bone was measured and divided into four parts of 25% each. All capsules were placed in rows between the ears on the positions F4, F3, C4, C3, P4 and P3. Seen from the lateral view, two capsules were placed on the midline between the ears and eyes. One capsule was placed on the crista frontalis and the other on the processus zygomaticus of the os temporalis (). The latter appeared to be projected above the cerebellum and was therefore not used in the recordings. The MRI scan of the head showed that all other electrode positions were located on the scalp above the cerebrum (Nickel et al. Citation1975) ((c) and (d)). Equipment and electrodes were placed while the horses were in the stocks (). Due to interference with electromyography (EMG) activity after measuring three horses, P3 and P4 were excluded from further recordings.
Figure 2. Normal beta wave brain activity in a control horse showing the channels indicating the location of the electrodes. The electrical activity recorded on each electrode was compared to the indifferent one. Electrical difference between electrode sets are graphically visualised on the computer screen. F = frontal, C = central, P = parietal and T = temporal. The electrodes on the left side of the horse's head are odd numbered, on the right side even numbered and those on the midline are named ‘z’. Scale: 50 μV/division and 1 second/division.
Figure 3. Electrode position based on MRI scan. (a, b) The electrodes are named as follows: F = frontal, C = central, P = parietal and T = temporal. The electrodes on the left side of the horse's head are odd numbered, on the right side even numbered and those on the midline are named ‘z’. The distance between the horizontal electrode rows on the forehead is 25% of the total length. Electrodes F3 and F4 are placed just inside the edges of the location of the brain. (c) Longitudinal view indicating that the capsule (white spot) placed on the processus zygomaticus of the os temporalis was not projected above the cerebrum. (d) Capsule placement on the crista frontalis of the os temporalis projected above the cerebrum.
In the first three control horses and the first two patients, concave electrodes filled with electrode paste (TD-246 Skin Conductance Electrode Paste, Discount Disposables, St. Albans, VT, USA) were glued on the horse's head using a small gauze covering the electrode that was glued with collodium 4% (40 mg/ml pyroxiline, LUMC pharmacy, Leiden, the Netherlands) onto the skin ((b)). In all other horses, self-adhesive snap electrodes (Cutisoft 10 × 10 cm BSN Medical GmbH, Homburg, Germany) were used for practical and safety reasons ((c) and ). The forehead and the upper part of both temporal bones were shaved until the skin was hairless ((a)). The skin was cleaned with water and soap and defatted with alcohol 70%. The electrode's position was marked with a waterproof pencil dividing the head into four equal parts of the area between the top of the forehead, the ears and the margin of the supraorbital bone. Just below the lower margin of the supraorbital bone, the ground electrode Z was placed. Seen from a lateral view the temporal electrodes were placed at the middle of the distance between the ears and the eyes on the dorsal ridge of the temporal bone ((d) and (b)). The skin was smoothened using water-resistant sandpaper P600 to reduce skin resistance. The electrode stickers were cut to the right size and shape ((c) and (b)). The shielded cables were attached to the electrodes and the resistance was measured (XI-1 electrode impedance tester, Oxford, UK). Electrodes were adjusted until the impedances were below 5 kΩ. Leucoplast (5 × 9.2 cm, BSN Medical, Hamburg, Germany) was taped over the electrodes. The electrodes were protected against rubbing using a trotter's cap, a bandage or an eye protection cap. The cables were braided into the manes and connected to the recording box ((d) and (e)).
2.5. Fixation of the recording box
The recording box was protected in a home-made metal cover box and placed underneath the metal anti-roll band of the girdle ((e)). Tie ribs (280 × 4.8 mm) and leucoplast attached the metal box to the girdle. Extra padding with a commercial gel pad and woollen blanket on the wither and on the ventral thorax was provided in order to compensate for the rather tight fixation of the belt. During the recordings the horse and equipment were checked hourly and activities of the horse and visitors to the stable were recorded in a logbook to enable correlation of signals to behaviour.
2.6. Interpretation
The records were analysed offline at an amplitude of 50 or 200 μV/division and 10 seconds/division scale by visual inspection. The signals were interpreted by and under the supervision of the EEG technician of the LUMC. Based on human and equine EEG literature (Aminoff et al. Citation1988; Lewin & Tönhardt Citation1998; Binnie & Stefan Citation1999; Lacombe et al. Citation2001; Kaplan Citation2004; Stern Citation2005; Aleman et al. Citation2006; Tatum et al. Citation2006; Benbadis & Lin Citation2008; Williams et al. Citation2008; Overvliet et al. Citation2010; Kaplan & Rossetti Citation2011; Kovach et al. Citation2011; Lacombe et al. Citation2011; McMenamin et al. Citation2011; Moeller et al. Citation2011; Seneviratne et al. Citation2012), EEG signals were interpreted.
2.7. Definitions of pathological activity in humans (see also van der Ree & Wijnberg Citation2012 for definitions of normal patterns)
Ictal abnormalities: repetitive EEG discharges with relative abrupt onset and termination and characteristic pattern of evolution lasting several seconds on disorganised and slow background activity or on normal background activity.
IEDs: spikes, sharp waves or spike–wave complexes occurring isolated or in bursts lasting a few seconds in the absence of a clinical seizure.
Partial seizure: focal fast activity changing into spike–wave activity or rhythmical shape waveforms increasing in amplitude and diminishing in frequency and then slowing down to 1 per second and becoming more irregular before cessation.
Focal Spike: solitary or multiple IEDs of a sharp focal spike of <70 ms duration.
Sharp wave: solitary or multiple IED activity of 70–200 ms duration.
Intermittent rhythmical delta activity: burst of rhythmic, sinusoidal <4 Hz delta activity around 50–100 μV.
Rhythmical discharges: long period of about 50 seconds or longer comprising similar waves with a frequency of 1–1.5 Hz and an amplitude of 30–150 μV consisting of slow waves, sharp wave–slow wave complexes or spike–wave complexes.
Fast rhythmical discharges or multi-spikes: a short period of 0.5–2 seconds with a frequency of 4–30 Hz and an amplitude >100 μV.
Tonic seizures: low voltage activity starting in the beta or mid-alpha range and slowing and increasing in amplitude during the attack.
3. Results
The recording time ranged from 5 to 48.5 hours. The mean recording time of the control horses was 26 ± 5.4 (SD) hours, whereas for the first seven patients it was 20.9 ± 13.5 hours. Two patients had recording times of 5 and 6 hours, respectively, since abnormal brain activity was recognised early. The mean recording time was 23 ± 10 hours. The time taken to achieve these recording periods was longer than the actual recording time due to unsolvable technical flaws of the equipment: some periods were missing from the recordings for unknown reasons. Also, three horses developed bruises on the wither due to the prolonged period of carrying a tight belt. After this experience, the maximum continuous carrying time of the belt was 10 hours per day. During the night, the belt was taken off. The collodium glue did not result in irritations of the skin.
Most horses started eating when stabled, which prevented diagnosing abnormal brain activity within the first 30 minutes. In all horses, normal brain activity was predominant (). Alpha waves were not present at all. Sleep stages could be recognised during the day by periods of theta waves of 7–10 seconds, 5–6 Hz and an amplitude of 10–40 μV ((a)) or sleep spindles (single waves of 10–12 Hz and amplitude of 30–60 μV [(b)]). Periods of the recordings were masked with EMG artefacts while eating ((a)). Eye movements ((b)) induced artefacts but could easily be identified as such. Other than the normal EEG activity (van der Ree & Wijnberg Citation2012), a 15-year-old control mare showed two episodes of abnormal brain activity on all electrodes. However, she did not show clinical signs of abnormal behaviour. The frequency was 1–2 Hz, amplitude 30–70 μV and duration 54–68 seconds. It faded away showing increased amplitude and an irregular pattern and met the criteria of interictal epileptiform activity. In all horses the logbook was compared with the recordings. No relation with activities in the stable could be demonstrated.
Figure 4. EEG recording during drowsiness or sleep in a horse. (a) Theta waves (indicated between → and ←) seen during a period of drowsiness: irregular waves of 5–6 Hz and amplitude 10–40 μV. The waves occurred for a period of approximately 7 seconds. Scale: amplitude 50 μV/division and 1 second/division. (b) Sleep spindles indicated by * are seen as single waves of 10–12 Hz with an amplitude of 30–60 μV. Scale: amplitude 50 μV/division and 1 second/division.
Figure 5. Normal rhythmical EEG recordings of a horse. (a) Masking EMG artefacts while chewing in an eating normal horse. Scale: 200 μV/division and 1 second/division. (b) The waves marked with * are eye movements and the smaller waves marked with ← are the result of blinking the eyelid. Scale: amplitude 50 μV/cm and 10 seconds/division.
In 7 out of 10 patients (), abnormal EEG activity was recorded like intermittent rhythmical discharges in waxing and waning amplitude often with chaotic extinction (n = 5), spikes (n = 2), burst activity of sharp waves ((a)) and intermittent rhythmical delta waves ((b) and (e)) (n = 3) of 1 or 3–4 Hz in an awake situation. Of the patient group, 66% showed abnormal brain activity. In 56% of the patients, the EEG showed activity with characteristics of epileptiform activity. In five out of seven recordings, the activity was interpreted as (interictal) epileptic activity. In detail, patients 1, 2 and 6 did not show abnormal activity. Patients 3, 4, 7 and 8 showed spikes of 70–200 ms, whereas patients 4, 5 and 7–10 also showed high-amplitude intermittent rhythmical discharges of 4–11 Hz, and up to 520 μV amplitude suggestive of pathological, generalised burst activity. Horses 5, 8 and 10 showed intermittent generalised rhythmical discharge activity lasting up to 20 seconds. Horses 5, 9 and 10 also showed recurrent episodes of slow delta waves in frequency and amplitude waxing and waning lasting up to 31 seconds.
Figure 6. EEG recordings showing pathological activity in horses. (a) Generalised spike burst activity of 4–5 Hz and <520 μV amplitude indicative of interictal epileptiform activity in a patient with clinical epilepsy (patient 7). Scale: amplitude 200 μV/division and 1 second/division. (b) Intermittent rhythmical delta activity of 3–4 Hz (duration 3 seconds) followed by generalised large irregular and uncoordinated activity (patient 10). Scale: amplitude 50 μV/cm and 1 second/division. (c) Spikes located on F4-T4, C4-T4, P4-T4 and Tz-Pz (patient 3) identified as sharp waves (amplitude 20–120 μV and duration 80 ms). Scale: amplitude 50 μV, 1 second/division. (d) Generalised high-voltage rhythmical spike discharge (patient 9) (amplitude 600–800 μV and frequency 3–4 Hz lasting 31 seconds with chaotic extinction). Scale: amplitude 200 μV/division and 1 second/division. (e) Intermittent generalised rhythmical slow delta waves of 1 Hz (amplitude of 20–100 μV and 14 seconds duration with chaotic extinction) (patient 10). Scale: amplitude 50 μV/division and 10 seconds/division.
The abnormal activity often involved the temporal regions. Spikes ((c)) lasted 70–200 ms with an amplitude of 20–130 μV. They occurred randomly and repeatedly with a maximum of 3–4 or 10 spikes per minute. Intermittent rhythmical discharges of burst of spikes of 4–7 Hz ((a) and (d)) were recorded randomly throughout the recordings with a maximum of 2 or 11 series per minute lasting around 1.6 seconds. They were recorded at all electrodes with amplitudes up to 600–800 μV in three patients. Intermittent rhythmical slow delta waves of 1 Hz and amplitude of 20–100 μV lasting 5–31 seconds were recorded at all electrodes in three horses ((e)).
The MRI of patient 10 and the control horse with abnormal brain activity showed no morphological abnormalities. The abnormal dullness in patient 10 gradually disappeared and the horse returned to normal work without complaints after almost a year of rest. Patient 5 was suspected of an intracranial mass based on the clinical history of recurrent fever, leucocytosis and EEG findings (slow delta wave with extinction [(a)]). MRI was performed post-mortem and confirmed the space-occupying mass as an abscess in the cerebrum ((b)).
Figure 7. EEG showing generalised slow delta waves. MRI showed a left-sided space-occupying mass identified as an abscess. (a) Generalised rhythmical slow delta waves (1 Hz and amplitude of 20–100 μV) (between arrows) suggestive of an intracranial space-occupying mass (patient 5). Scale: amplitude 50 μV/division and 1 second/division. (b) B1 – space-occupying mass indicative of abscess (grey circle on the upper right part of the figure) in the dorsal view of the left hemisphere of the cerebrum; B2 – caudal view; B3 – expansion of the mass between the eyes in the caudal view.
4. Discussion
The aim of this study was to test if AEEG was applicable in horses. Once it was proven that good-quality recordings could be made in healthy horses, we tested if abnormalities could be identified in equine patients suspected of either epilepsy or intracranial abnormalities using AEEG equipment derived from a human hospital. AEEG appears to be a suitable diagnostic tool for horses. The ambulatory system makes it more convenient to register EEG recordings since horses can walk around in their stable or can be hand-walked. Theoretically, this will increase the likelihood of recording abnormalities (Binnie & Stefan Citation1999; Moeller et al. Citation2011; Seneviratne et al. Citation2012). Since in humans many pathological events occur during certain phases of sleep (Binnie & Stefan Citation1999; Overvliet et al. Citation2010), it seems advantageous that the horses showed a surprisingly frequent-occurring sleep pattern during the day, which might be beneficial for capturing abnormal recordings. Sedation or even anaesthesia, which is known to influence the recordings and is sometimes used in conventional equine EEG recordings (Purohit et al. Citation1981; Mysinger et al. Citation1985), is not needed during AEEG recordings (Lewin & Tönhardt Citation1998). The complications of bruising withers and loss of data were related to the home-made materials and will not occur if modern commercial AEEG equipment is used. Simultaneous video recordings will facilitate interpretation of the data.
We found EEG signals suggestive of IEDs, or discharges suggesting an intracranial space-occupying mass or brain abnormality (Lacombe et al. Citation2001; Stern Citation2005; Moeller et al. Citation2011; Seneviratne et al. Citation2012). In a cohort of over 13,000 normal humans, IEDs were found in 0.5% of the cases (Noachtar & Rémi Citation2009) and the chance that healthy persons with IED would develop epilepsy was 2%–3% (Noachtar & Rémi Citation2009; Brigo Citation2011). In humans suffering from absence epilepsy, staring or change of facial expression occurs in 94% of the patients (Binnie & Stefan Citation1999), which resembles the clinical findings of patient 8 that showed rhythmical discharges indicating generalised IEDs. The finding of rhythmical slow delta waves in patient 5, in which an intracranial mass was found on MRI, is in agreement with the equine literature (Lacombe et al. Citation2001; Lacombe et al. Citation2011). The current study showed that it is possible to acquire high-quality tracings in awake ambulatory horses in contrast to the opinions of other researchers (Lacombe et al. Citation2001). The brief rhythmical 4–7 Hz interictal spike wave activity EEG recordings found in several of our patients showed the characteristics of idiopathic generalised epilepsy in the absence of the status epilepticus commonly seen in humans (Seneviratne et al. Citation2012) indicating the absence of signs of a grand mal. The finding that epileptiform spikes or burst discharges were frequently recorded in the temporal location is in correspondence with the human literature (Seneviratne et al. Citation2012) but is not in accord to some equine studies (Lacombe et al. Citation2001; Aleman et al. Citation2006). This might be explained by the different patient categories selected (Aleman et al. Citation2006) or the fact that the temporal electrodes were not placed on an identical position. To enhance the chance of capturing EEG tracings indicative of abnormal brain activity, recording within 3 days after an observed incident is preferred (Binnie & Stefan Citation1999; Seneviratne et al. Citation2012). However, for logistic reasons this was not always possible. The fact that in 6 out of 10 equine patients pathological activity was still detected is promising. Since 1985, reports have been published on the use of EEG in horses (De Lahunta Citation2001; Lacombe et al. Citation2001; Robinson et al. Citation2003; Schwarz & Van den Hoven Citation2011). Although Lewin and Tönhardt Citation(1998), amongst others, described the materials and methods of EEG in detail, a precise description of the characteristics of the abnormal waves encountered (Lacombe et al. Citation2011; Schwarz & Van den Hoven Citation2011) is sometimes less clear. This impairs development of an increasing learning curve for the interested beginner. Complicating factors are the existence of epileptiform-like, normal waveforms in humans, potentially implying the risk of over-interpretation (Tatum et al. Citation2006; Benbadis & Lin Citation2008; McMenamin et al. Citation2011), which might have been the case in the control horse. Adding simultaneous video recordings to the system would greatly facilitate the interpretation of behaviour and clinical signs that coincide with pathological activity (Noachtar & Rémi Citation2009; Kennett Citation2012). On the other hand, EEG is easily over-appreciated in neurological workup while the benefit of a good clinical examination might be overlooked (Binnie & Stefan Citation1999; Benbadis & Lin Citation2008). Obtaining more AEEG recordings of horses with proven intracranial anatomical abnormalities would facilitate an objective discussion on the usefulness of the technique in equine clinics. However, it should be realised that in many cases of epileptic insults anatomical lesions are absent in various other species (Seneviratne et al. Citation2012).
5. Conclusion
In our experience, the AEEG application in horses is a welcome asset to the neurological diagnostic workup. In the near future, the authors will still need to cooperate with human experts in order to minimise the risk of under- or over-diagnosing intracranial pathology based on (A)EEG recordings only.
Conflict of interest statement
None of the authors of this paper has a financial or personal relationship with other people or organisations that could inappropriately influence or bias the content of the paper.
Acknowledgements
Cor Kramer (Leiden University Medical Centre, The Netherlands), Ab van Dijk (Department of Equine Sciences, University Equine Clinic, Utrecht University, The Netherlands) and Joop Fama (Department of MultiMedia, Faculty of Veterinary Medicine, Utrecht University, The Netherlands) are acknowledged for their technical support.
References
- Aleman M, Gray LC, Williams DC, Holliday TA, Madigan JE, LeCouteur RA, Magdesian KG. 2006. Juvenile idiopathic epilepsy in Egyptian Arabian foals: 22 Cases (1985–2005). J Vet Intern Med. 20:1443–1449.
- Aminoff MJ, Goodin DS, Berg BO, Comptom MN. 1988. Ambulatory EEG recordings in epileptic and nonepileptic children. Neurology. 38:558–562.
- Benbadis SR, Lin K. 2008. Errors in EEG interpretation and misdiagnosis of epilepsy: which EEG patterns are over-read? Eur Neurol. 59:267–271.
- Binnie CD, Stefan H. 1999. Modern electroencephalography: its role in epilepsy management. Clin Neurophysiol. 110:1671–1697.
- Brigo F. 2011. An evidence-based approach to proper diagnostic use of the electroencephalogram for suspected seizures. Epilepsy Behav. 21:219–222.
- De Lahunta A. 2001. Seizures-convulsions. In: De Lahunta A, editor. Anonymous veterinary neuranatomy and clinical neurology. Philadelphia (PA): W.B. Saunders Company; p. 326–332.
- Deeny SP, Hillman CH, Janelle CM, Hatfield BD. 2003. Cortico-cortical communication and superior performance in skilled marksmen: an EEG coherence analysis. J Sport Exercise Psy. 25:188–204.
- Ebersole JS. 1985. Ambulatory cassette EEG. J Clin Neurophysiol. 2:397–418.
- Ebersole JS. 1987. Ambulatory cassette EEG in epilepsy diagnosis. Yale J Biol Med. 60:85–91.
- Kaplan PW. 2004. The EEG in metabolic encephalopathy and coma. J Clin Neurophysiol. 21:307–318.
- Kaplan PW, Rossetti AO. 2011. EEG patterns and imaging correlations in encephalopathy: encephalopathy part II. J Clin Neurophysiol. 28:233–251.
- Kennett R. 2012. Modern electroencephalography. J Neurol. 259:783–789.
- Konig HE, Liebich H. 2007. Axial skeleton. In: Konig HE, Liebich H, editors. Veterinary anatomy of domestic mammals. Stuttgart: Schattauer; p. 50–58.
- Kovach CK, Tsuchiya N, Kawasaki H, Oya H, Howard MA, Adolphs R. 2011. Manifestation of ocular-muscle EMG contamination in human intracranial recordings. Neuroimage. 54:213–233.
- Lacombe VA, Mayes M, Mosseri S, Reed SM, Fenner WR, Ou HT. 2011. Epilepsy in horses: aetiological classification and predictive factors. Equine Vet J. 44:646–651.
- Lacombe VA, Podell M, Furr M, Reed SM, Oglesbee MJ, Hinchcliff KW, Kohn CW. 2001. Diagnostic validity of electroencephalography in equine intracranial disorders. J Vet Intern Med. 15:385–393.
- Lewin W, Tönhardt H. 1998. Non-invasive EEG-leading in the awake standing horse. Pferdeheilkunde. 14:285–294.
- McMenamin BW, Shackman AJ, Greischar LL, Davidson RJ. 2011. Electromyogenic artifacts and electroencephalographic inferences revisited. Neuroimage. 54:4–9.
- Moeller JJ, Tu B, Bazil CW. 2011. Quantitative and qualitative analysis of ambulatory electroencephalography during mild traumatic brain injury. Arch Neurol. 68:1595–1598.
- Mysinger W, Redding RW, Vaughan JT. 1985. Electroencephalographic patterns of clinically normal, sedated, and tranquilized newborn foals and adult horses. Am J Vet Res. 46:36–41.
- Nickel R, Schummer A, Seiferle E. 1975. Zentralnervensystem [Central nervous system]. In: Nickel R, Schummer A, Seferle E, editors. Lehrbuch der anatomie der haustiere IV [Study book anatomy of companion animals IV]. Berlin: Felgentreff & Goebel; p. 53–142.
- Noachtar S, Rémi J. 2009. The role of EEG in epilepsy: a critical review. Epilepsy Behav. 15:22–33.
- Overvliet GM, Besseling RMH, Vles JSH, Hofman PAM, Backes WH, van Hall MHJA, Klinkenberg S, Hendriksen J, Aldenkamp AP. 2010. Nocturnal epileptiform EEG discharges, nocturnal epileptic seizures, and language impairments in children: review of the literature. Epilepsy Behav. 19:550–558.
- Purohit RC, Mysinger PW, Redding RW. 1981. Effects of xylazine and ketamine hydrochloride on the electroencephalogram and the electrocardiogram in the horse. Am J Vet Res. 42:615–619.
- Robinson NE, Wilson RM, Trogdon HM. 2003. Changes in mentation, seizures and narcolepsy. In: Robinson NE, editor. Current therapy in equine medicine. Philadephia (PA): W.B. Saunders Company; p. 764–771.
- Schwarz B, Van den Hoven R. 2011. Seizures in an Arabian foal due to suspected prolonged transient neonatal hypoparathyroidism. Equine Vet Educ. 24:225–232.
- Seneviratne U, Cook M, D’Souza W. 2012. The electroencephalogram of idiopathic generalized epilepsy. Epilepsia. 53:234–248.
- Sheridan PH, Sato S. 1985. Applications of intensive monitoring in epilepsy. J Clin Neurophysiol. 2:221–229.
- Stern JM. 2005. Ictal epileptiform patterns. In: Jerome EJE, editor. Atlas of EEG patterns. Philadelphia (PA): Lippincott Williams & Wilkins; p. 143–161.
- Tatum IV WO. 2001. Long-term EEG monitoring: a clinical approach to electrophysiology. J Clin Neurophysiol. 18:442–455.
- Tatum WO, Husain AM, Benbadis SR, Kaplan PW. 2006. Normal adult EEG and patterns of uncertain significance. J Clin Neurophysiol. 23:194–207.
- van der Ree M, Wijnberg ID. 2012. A review on epilepsy in the horse and the potential of ambulatory EEG as a diagnostic tool. Vet Quart. 32:159–167.
- Williams D, Aleman M, Holliday T, Fletcher D, Tharp B, Kass P, Steffey E, Le Couteur R. 2008. Qualitative and quantitative characteristics of the electroencephalogram in normal horses during spontaneous drowsiness and sleep. J Vet Intern Med. 22:630–638.