
Abstract
Background: Milk fever (MF) is a common calcium metabolism disorder in perinatal cows. Currently, information regarding the detailed metabolism in cows suffering from MF is scant.
Objective: The purpose was to study the metabolic profiling of serum samples from cows with MF in comparison to control cows, and thereby exploring other underlying pathological mechanisms of this disease.
Animals and methods: In the current study, we compared the serum metabolomic profile of dairy cows with MF (n = 8) to that of healthy dairy cows (n = 24) using a 500-MHz digital 1H-nuclear magnetic resonance (1H-NMR) spectrometer. Based on their clinical presentation and serum calcium concentration, cows were assigned either to the control group (no MF symptoms and serum calcium concentration >2.5 mmol/L) or to the MF group (MF symptoms and serum calcium concentration <1.4 mmol/L). For statistical analysis, a one-way analysis of variance was performed.
Results: We identified differences regarding nine metabolites between the two groups, among which glucose, alanine, glycerol, phosphocreatine, and gamma-aminobutyrate decreased, and β-hydroxybutyrate, acetone, pyruvate, and lysine increased in cows with MF. Most of these were carbohydrates and amino acids involved in various energy metabolism pathways.
Conclusion: The different metabolites in cows with MF reflected the pathological features of negative energy balance and fat mobilization, suggesting that MF is associated with altered energy metabolism.
Clinical importance: The 1H-NMR spectroscopy can be used to understand the pathogenesis of MF and identify biomarkers of the disease.
1. Introduction
Milk fever (MF), also known as postparturient hypocalcemia or parturient paresis, is a common calcium metabolism disorder in perinatal cows that is characterized by hypocalcemia, muscle weakness, paralysis of the limbs, and depression, with coma occurring in severe cases. In general, the incidence of MF is less than 10%. However, it may exceed 25% at parturition, with a higher incidence among high-yield dairy cows. Previous studies have shown that the incidence of MF in cows was 0.60%–5.0%, and that 14%–50% of cows were affected by subclinical hypocalcemia at calving (Oetzel & Miller Citation2012; Goff et al. Citation2014). MF is associated with mastitis and endometritis, and causes reductions in milk yield and quality that result in substantial economic losses to the dairy industry.
MF has long been thought to be the result of postpartum reductions in blood calcium caused by increased milk production, intestinal calcium absorption, and renal calcium absorption combined with a decreased ability to mobilize bone calcium in perinatal cows. However, recent studies have shown that the dietary cation–anion difference (DCAD) per kilogram of dry matter (kg DM), which is defined as mEq [(Na+ + K+) − (Cl−+ S2−)]/kg DM, is an important risk factor for MF. The DCAD affects blood pH and overall acid–base balance in body tissues. Increased anions in the diet reduce blood pH, and excess dietary cations increase blood pH.
Increased blood pH stimulates calcium mobilization (Raisz Citation1965) and decreases serum ionized calcium level. A recent study showed that high DCAD diets caused significant decreases in serum calcium levels in cows, and were associated with metabolic alkalosis, which is associated with hypocalcemia and MF (Goff, Liesegang and Horst Citation2014).
Decreasing the prenatal DCAD and administering postpartum calcium supplements are often effective in preventing MF. Information regarding the detailed metabolism in cows with MF is scant. Therefore, we used 1H-nuclear magnetic resonance (NMR) spectroscopy to identify metabolites in cows with MF, and performed a multivariate statistical analysis of the metabolomic profiles of cows with and without MF to clarify the relationship between these metabolites and MF.
2. Materials and methods
2.1. Animals
All the animal experiments were performed in strict accordance with the recommendations in the guide for the Care and Use of Laboratory Animals of the National Institutes of Health (USA). Thirty-two Holstein cows (day 0 postpartum) with parities of three to six, body condition scores of approximately 3.25, and an average milk yield of about 30 kg were selected. The cows were maintained in free-stall housing in Heilongjiang, China. Production data were generated using the complete dairy management software system (Dairy Comp 305, © 2011 Valley Agricultural Software, ALTA-AGRICORP, Beijing). Based on their clinical presentation and serum calcium concentration, 24 healthy cows were assigned to the control group (no MF symptoms and serum calcium concentration >2.5 mmol/L), and 8 cows were assigned to the MF group (MF symptoms and serum calcium concentration <1.4 mmol/L). All of our animal experiments were approved by the Animal Welfare and Research Ethics Committee of Heilongjiang Bayi Agricultural University.
2.2. Sample collection and analysis
An amount of 10 mL of blood from all 32 cows was collected from the jugular vein within 12 hours after calving, and placed in a stationary tube for 30 min at room temperature. The blood samples were centrifuged at 1500 × g for 20 min at 4 °C. The serum was transferred to 1.5 mL microcentrifuge tubes, and stored at −80 °C.
Calcium concentration in the serum of all the 32 cows was measured by a colorimetric method using commercial kits (ACCU-CHEK, Roche, Germany) in an automatic biochemical analyzer (HITACHI 7600, Japan).
2.3. Sample preparation
All serum samples were thawed at room temperature, and 400 μL of each sample was combined with 200 μL of buffered salt solution (pH 7.0) containing 0.2 M Na2HPO4, 0.2 M NaH2PO4, and 0.05% (w/v) sodium 3-(trimethylsilyl) propionate-2,2,3,3-d4 (TSP) in 99.8% deuterated water. The samples were centrifuged at 12,000 × g for 20 min at 4 °C, and 550 μL of the supernatant was loaded in a 5-mm NMR tube.
2.4. 1H-NMR spectroscopy
All samples were placed under the signal acquisition probe of an Avance III 500-MHz Digital NMR Spectrometer (Bruker, Ettlingen, Germany), and the NMR spectra were recorded using a Call–Purcell–Meiboom–Gill (CPMG) sequence (90 [τ-180-τ] n-acquisition) with 64 timed scans and a 10-ms total relaxation period (transverse relaxation and longitudinal relaxation) to inhibit the protein signal. The free induction decay (FID) signal was measured following transverse relaxation, and the FID signals were Fourier transformed to obtain the 1H NMR spectra.
2.5. Preprocessing of 1H-NMR spectra
The 1H-NMR spectra were imported into the Topspin 3.0 software (Bruker, Ettlingen, Germany), and were manually corrected, based on the baseline phase and TSP reference (δ = 0 ppm). The spectra were transformed into ASCII files using the MestReNova, version 8.0.1, software (Mestrelab Research, Santiago de Compostela, Spain), and saved in plain text format, which included the chemical shift data for each NMR spectral peak. The residual water peaks between 4.2 and 5.7 ppm were removed, and the one-dimensional spectra between 0.7 and 9.4 ppm with 0.025 ppm automatic segmentation were included in the statistical analysis.
2.6. Identification of compounds
The 1H-NMR spectral data were imported into the Chenomx NMR, version 7.5, software suite (Chenomx, Edmonton, Canada) for automatic compound identification by comparison with the compound library of the Chenomx software. The compounds with library matches were also compared with the Human Metabolome Database (http://www.hmdb.ca), the Madison-Qingdao Metabolomics Consortium Database (http://mmcd.nmrfam.wisc.edu/), and the Kyoto Encyclopedia of Genes and Genomes (http://www.kegg.jp).
2.7. Multivariate statistical analysis
The NMR data in plain text format were entered into an Excel worksheet, and imported into the SIMCA-P, version 13.0, software (Umetrics, Umeå, Sweden). The multivariate analysis included an unsupervised principal-component analysis (PCA) and a supervised partial-least-squares discriminant analysis (PLS-DA) with orthogonal signal correction (OSC). The PCA was used to assess the overall level of the sample by describing the largest variance with the least number of components (Sun et al. Citation2012). When the differences in the variables between the groups could not be determined in the PCA, such as when the contribution rate of the main component was lower and the clustering effect was suboptimal, the OSC-PLS-DA was performed. The PLS-DA was performed to analyze the repeated variables between the groups, and to highlight the differences between the groups (Verwaest et al. Citation2011). The OSC was performed to remove those components which displayed no significant grouping and maximize the differences between the groups (Rezaei-Tavirani et al. Citation2012). Seven times-cross validations and 200 times-arrangement verifications were performed to determine the stability of the OSC-PLS-DA model, and five OSCs were conducted to maximize the differences between groups.
2.8. Statistical identification of differentially expressed metabolites
A one-way analysis of variance was performed using the Statistic Package for Social Science (SPSS) statistical software (IBM, Armonk, NY, USA). The level of statistical significance was set at P < 0.05 for the identification of differentially expressed metabolites. In the OSC plot, data points to the left (MF group) of the vertical axis were negative, and those to the right side (control group) were positive. In the loading plot, the data points above the horizontal axis were positive, and those under the horizontal axis were negative. Therefore, if a positive or negative shift occurred in the loading plot for a metabolite in the MF group, the metabolite was considered to decrease or increase, respectively, compared to the metabolite in the control group.
3. Results
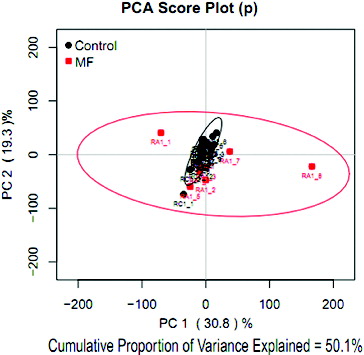
The PCA-score plot () showed that all samples were within the 95% confidence interval. The data-sets had a cumulative proportion of variance of 50.1% (PC1 = 30.8%, PC2 = 19.3%), which indicated that the two groups were significantly different overall.
Figure 1. PCA score plot based on the CPMG of the 1H NMR spectra of serum samples obtained from cows with or without MF. On the score plot, each point represents an individual sample, with the red box representing the MF group, and the black dot representing the control group. The abscissa and ordinate represent the variance associated with components 1 and 2, respectively.
As shown in (a), the OSC-PLS-DA model was created with principal components 1 and 2, and used five OSC to maximize the intergroup differences. Combined with the loading plot ((b)), the different metabolites between the control group and the MF group were identified.
Figure 2. (a) OSCs PLS-DA score plot. The abscissa and ordinate represent components 1 and 2, respectively, for modeling. Every data point represents a sample. The left side (MF group) of the vertical axis is negative, and the right side (control group) is positive (OSC: orthogonal signal correction, LVs: latent variances). (b) Loading plots obtained from serum. The abscissa and ordinate axis represent, respectively, chemical shift (ppm) and correlation coefficients of metabolites. Blue: lowest, no statistically significant difference between the two groups; red: highest, statistically significant. The data points above the horizontal axis are positive, and those under the horizontal axis are negative.
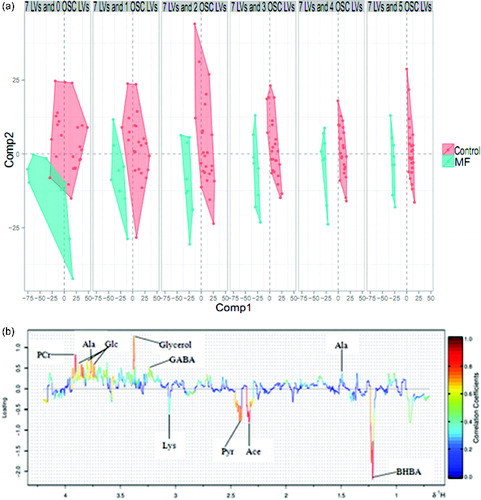
As shown in , nine metabolites showed significant differences in the MF group, compared with the control group. Glucose, alanine, glycerol, phosphocreatine, and gamma-aminobutyrate (GABA) were decreased, whereas β-hydroxybutyrate (BHBA), acetone, pyruvate, and lysine were increased in cows with MF.
Table 1. Metabolites present at significantly different levels in the serum of dairy cows with milk fever.
4. Discussion
Glucose is the primary energy source in vivo, and is produced in animals via gluconeogenesis and glycogenolysis. Alanine is a nonessential amino acid, derived from the conversion of pyruvate or the hydrolysis of proteins and polypeptides. A previous study found that alanine is involved in the regulation of glucose metabolism, and that the serum level of alanine was proportional with that of glucose in both diabetes and hypoglycemia (Felig Citation1973). Glycerol is an important precursor for the synthesis of glucose via gluconeogenesis. When energy consumption is high, the breakdown of body fat via lipolysis is increased, releasing glycerol and fatty acids into the blood. In the liver, glycerol is converted into glucose to provide energy for cell metabolism. In our study, we found that the levels of blood glucose, glycerol and alanine decreased in perinatal cows with MF. These results indicate that the levels of glycerol and alanine generated for the production of glucose via gluconeogenesis were insufficient to meet the energy needs of the cows with MF.
Pyruvate is an important intermediate in glucose, fat, and protein metabolism (Liu Citation2003), and is mainly derived from glycolysis and lactate oxidation in skeletal muscle (Lam et al. Citation2005). Thus, pyruvate is a crucial link between various major metabolic pathways. In the current study, we found that the levels of glucose, glycerol, and alanine decreased in perinatal cows with MF, and that the levels of pyruvate and ketone bodies (BHBA and acetone) increased, compared with those of healthy cows, indicating that the catabolism of carbohydrates, fat, and amino acids was enhanced in cows with MF. Pyruvate also provides energy via the tricarboxylic acid (TCA) cycle. However, reduced levels of glucose inhibit the conversion of pyruvate to acetyl-CoA for the TCA cycle. Thus, pyruvate will produce more ketones to supply energy for extrahepatic tissues. The reduced consumption of pyruvate can cause the accumulation of ketone bodies in the blood, leading to ketosis.
In addition, 60%–70% of creatine is stored in the form of phosphocreatine in skeletal muscle. Phosphocreatine serves as a direct source of energy for muscle activity, providing enough adenosine triphosphate (ATP) for myofibrils to maintain muscle contractility (Feldman Citation1999). Elevated pyruvate inhibits the activity of creatine-pyruvate kinase, decreasing the production of phosphocreatine (Kalapos Citation1999). In the current study, phosphocreatine significantly decreased in serum from cows with MF compared to cows without MF, suggesting that the reduced level of phosphocreatine in cows with MF caused a reduction in ATP production in muscles, contributing to the paresis, ataxia, and paralysis associated with MF. Future investigations are warranted to determine whether increased pyruvate inhibits phosphocreatine-based ATP production in the muscles of cows with MF.
Lysine is an essential amino acid. Lysine metabolism requires many nutrients, including niacin, riboflavin, and pyridoxine. A high protein diet and a lack of lysine may lead to the loss of large amounts of calcium in the urine because lysine promotes calcium absorption, and lysine is used to enhance treatments for osteoporosis (Civitelli et al. Citation1989, Citation1991). In our study, the serum level of calcium was lower, and lysine increased in the cows with MF, compared with those of the control cows. These results indicate that MF is not caused by a lack of lysine in the diet. Because lysine is an essential amino acid, the increase in lysine concentration in cows with MF might be related to a metabolic disorder.
GABA is an inhibitory neurotransmitter found in the nervous system of many animals. A reduced level of GABA is associated with a variety of encephalopathies (Kalueff & Nutt Citation2007). A previous study in humans showed that severe depression is associated with a reduced level of GABA in the blood, and that GABA is an important factor in controlling stress and overcoming emotional disorders. A number of medications currently used to treat depression are designed to alleviate GABA deficiency (Luscher et al. Citation2011). In the current study, GABA decreased in the cows with MF compared to the healthy cows. Thus, GABA deficiency may contribute to the neurological symptoms associated with MF, including depression and coma. Future studies are warranted to determine the relationships between the serum level of GABA and the neurological manifestations of MF in cows.
5. Conclusion
In summary, our 1H-NMR metabolomic analysis of serum revealed that glucose, glycerol, alanine, GABA, and phosphocreatine decreased in cows with MF, whereas pyruvate, ketones, and lysine increased, compared with these metabolites in healthy cows. Our results indicate that MF is an energy metabolism disorder in which pathways related to glucose, fat, and protein metabolism are altered. Future studies on the relationship between these metabolic changes are warranted to determine the underlying cause of MF in cows.
Acknowledgements
This work was financially supported by the Chinese National Science and Technology Project (grant nos. 2013BAD21B01-2, 2012BAD12B05-2, and 2012BAD12B03-2).
References
- Civitelli R, Fedde K, Harter J, Halstead L, Gennari C, Avioli L. 1989. Effect of L-lysine on cytosolic calcium homeostasis in cultured human normal fibroblasts. Calcified Tissue Int. 45:193–197.
- Civitelli R, Villareal D, Agnusdei D, Nardi P, Avioli L, Gennari C. 1991. Dietary L-lysine and calcium metabolism in humans. Nutrition. 8:400–405.
- Feldman EB. 1999. Creatine: a dietary supplement and ergogenic aid. Nutr Rev. 57:45–50.
- Felig P. 1973. The glucose-alanine cycle. Metabolism. 22:179–207.
- Goff J, Liesegang A, Horst R. 2014. Diet-induced pseudohypoparathyroidism: a hypocalcemia and milk fever risk factor. J Dairy Sci. 97:1520–1528.
- Kalapos M. 1999. Possible physiological roles of acetone metabolism in humans. Med Hypotheses. 53:236–242.
- Kalueff AV, Nutt DJ. 2007. Role of GABA in anxiety and depression. Depression Anxiety. 24:495–517.
- Lam TK, Gutierrez-Juarez R, Pocai A, Rossetti L. 2005. Regulation of blood glucose by hypothalamic pyruvate metabolism. Science. 309:943–947.
- Liu S-Q. 2003. Practical implications of lactate and pyruvate metabolism by lactic acid bacteria in food and beverage fermentations. Int J Food Microbiol. 83:115–131.
- Luscher B, Shen Q, Sahir N. 2011. The GABAergic deficit hypothesis of major depressive disorder. Mol Psychiatry. 16:383–406.
- Oetzel G, Miller B. 2012. Effect of oral calcium bolus supplementation on early-lactation health and milk yield in commercial dairy herds. J Dairy Sci. 95:7051–7065.
- Raisz LG. 1965. Bone resorption in tissue culture. Factors influencing the response to parathyroid hormone. J Clin Investig. 44:103–116.
- Rezaei-Tavirani M, Fathi F, Darvizeh F, Zali MR, Nejad MR, Rostami K, Tafazzoli M. 2012. Advantage of applying OSC to 1H NMR-based metabonomic data of celiac disease. Int J Endocrinol Metab. 10:548–552.
- Sun Y, Lian Z, Jiang C, Wang Y, Zhu H. 2012. Beneficial metabolic effects of 2′,3′,5′-tri-acetyl-N6-(3-Hydroxylaniline)adenosine in the liver and plasma of hyperlipidemic hamsters. PloS One. 7:e32115.
- Verwaest KA, Vu TN, Laukens K, Clemens LE, Nguyen HP, Van Gasse B, Martins JC, Van Der Linden A, Dommisse R. 2011. 1H NMR based metabolomics of CSF and blood serum: a metabolic profile for a transgenic rat model of Huntington disease. Biochim Biophys Acta. 1812:1371–1379.