
Abstract
Substrains of the C57BL/6 inbred mouse are widely used in genetic, behavioral and physiological research, as well as models for human disease. Throughout, the choice of the respective substrain can have a large influence on experimental results. Likewise, the conditions under which experiments are performed, such as the light regime, can significantly affect the outcome of an experiment, especially when aiming at experimental behavior. Here, two commonly used mouse substrains, C57BL/6JOlaHsd and C57BL/6NCrl, were housed under either a conventional or a reverse light regime and were tested in either the light phase or the dark phase, respectively. All animals were exposed to three unconditioned anxiety-related behavior set-ups: the modified Hole Board test, the light-dark box and the elevated plus maze. Significant substrain and light regime effects were found in all three behavioral tests, with some of the latter being substrain and test specific. This signifies the importance of the choice of substrain used in for example, a mouse knockout experiment studying behavior, also in relation to light regime under which the animals are tested.
Introduction
The importance of substrain research is mentioned by Cook et al. (Citation2002) and Bryant et al. (Citation2008) showing the diversity of substrains from the 129 and C57BL/6 mouse strains in various behavioral set-ups and by Mekada et al. (Citation2009) who reported on the genetic differences between a number of substrains of C57BL/6. Previous studies have revealed that substrains C57BL/6JOlaHsd and C57BL/6NCrl exhibit deviant behavior compared to one another (especially in fear conditioning studies), and it has been found that they genetically differ in at least the expression of α-synuclein (Bryant et al., Citation2008; Siegmund et al., Citation2005; Specht & Schoepfer, Citation2001; Stiedl et al., Citation1999). Zurita et al. (Citation2011) have studied genetic polymorphism between C57BL/6 substrains. In their study, nine polymorphic single nucleotide polymorphisms (SNPs) were identified between C57BL/6JOlaHsd and C57BL/6NCrl, indicating genetic divergence between these two substrains. In a recent study comparing phenotypic and genomic analysis of C57BL/6J and C57BL/6N substrains, 15 structural variants differentiating C57BL/6J and C57BL/6N were identified encompassing genic regions, as well as 34 SNPs and 2 indels that distinguish these two twin strains (Simon et al., Citation2013). Which substrain is used (and from which breeding colony the animals originate) can have an influence on the behavioral data acquired (Beck et al., Citation2000; Cook et al., Citation2002; Müller et al., Citation2009; Zurita et al., Citation2011).
Many tests for unconditioned anxiety-related behavior in mice have been developed. Most tests act upon the ‘approach-avoidance conflict’ where the animals have an innate aversion for novel/well-lit, open environments, but simultaneously have the tendency to explore (Lister, Citation1990; Montgomery, Citation1955; Ohl, Citation2005). The data collected from these set-ups are highly influenced by apparatus, procedural variables and laboratory factors (O’Leary et al., Citation2013). At the same time, it has been suggested that the light regime under which the animals are tested has influence on behavioral results. Testing animals in the dark phase (i.e. their active phase) was, for example, found to result in superior outcomes when it comes to experiments aimed at strain discrimination (Hossain et al., Citation2004). Also, testing in the light phase has been reported to result in behavioral inhibition and impaired cognitive performance in DBA/2N mice (Roedel et al., Citation2006). Although light regime influences have been detected, there are few studies performed on the effect of light regime in various behavioral domains (Crawley, Citation2007).
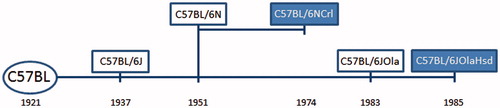
It has not yet been investigated whether the substrains of the C57BL/6 inbred mouse lineage tested here (i.e. C57BL/6JOlaHsd and C57BL/6NCrl) respond differently to the effect of light regime. In this study, behavioral profiles of the two substrains are presented. The history of these substrains can be found in . The animals of both substrains were housed under either the conventional or reverse light regime and were behaviorally tested using three unconditioned behavioral tests (the modified Hole Board – ‘mHB’, the light-dark box – ‘LD’ and the elevated plus maze – ‘EPM’), with a week between the tests to minimize the effect of multiple testing (McIlwain et al., Citation2001; Paylor et al., Citation2006). The evaluation of substrain and light regime effects was primarily focused on the anxiety-indicating behavioral dimensions such as ‘avoidance’ and ‘risk assessment’, but also controlled for potentially confounding dimensions such as ‘arousal’, ‘exploration’ and ‘locomotion’.
Figure 1. Timeline of the history of the two C57BL/6 substrains used in this experiment (timeline not to scale). The C57 black subline (C57BL) was established by Clarence Little in 1921 and in 1937 the line was separated into subline 6 (and subline 10), and was maintained at the Jackson Laboratories (‘J’) resulting in the name C57BL/6J (Sacca et al., Citation2013). The C57BL/6N subline diverged in 1951 from C57BL/6J and was maintained at the NIH (‘N’). In 1974 that subline was sent to Charles River Laboratory (‘Crl’), resulting in C57BL/6NCrl (Charles River, Citation2011; Sacca et al., Citation2013). In 1974, a subline of C57BL/6J was sent to the Laboratory Animal Centre in the UK and subsequently moved to OLAC (‘Ola’) in 1983 and was finally taken over by Harlan Sprague Dawley (‘Hsd’, now Harlan Laboratories) resulting in the substrain C57BL/6JOlaHsd (Harlan Laboratories, Citation2013). See Zurita et al. (Citation2011) for a more extensive overview of the lineage of C57BL/6 substrains.
Methods
Ethical note
The protocol of the study was approved by the Ethics Committee for Animal Experiments of the University Medical Center Utrecht and Utrecht University, Utrecht, the Netherlands (approval number: 2010.I.11.241). The animal experiment followed the Dutch ‘Code on Laboratory Animal Care and Welfare’. The present animal study is reported in accordance with the so-called ARRIVE guidelines (http://www.nc3rs.org.uk/arrive-guidelines).
Animals
In this study, n = 23 male C57BL/6JOlaHsd (hereafter referred to as B6J; Harlan Laboratories BV, Horst, the Netherlands) and n = 23 male C57BL/6NCrl (abbreviated to B6N; Charles River Laboratories, Saint-Germain-sur-l’Arbresle, France) mice were housed under a 12 h conventional (i.e. lights on at 7:00AM) light-dark regime. Additionally, n = 23 B6J and n = 24 B6N were housed under a 12 h reversed (i.e. lights on at 7:00PM) light-dark regime. The animals were 4–6 weeks upon arrival and they were individually housed in wire-topped Euro-standard Type II L cage (Tecniplast, Buguggiate, Italy) with a shelter and tissues as cage enrichment. The animals had ad libitum access to food (Diet # 98341, Harlan Teklad, Madison, WI) and demineralized water. The animals from this study were control animals in an experiment studying the effect of magnesium deficiency on anxiety-related behavior (Labots et al., Citation2016). As part of the experimental protocol blood samples were taken via tail incision 2 days before behavior testing in order to determine the plasma magnesium level. Since this is a mild invasive procedure and all animals underwent this action, it is not expected that it disturbed the behavioral outcome.
Experimental protocol
The animals were habituated for 2 weeks after arrival to adjust to the housing conditions. In these 2 weeks, the experimenter handled the animals four times a week for a few minutes. Handling consisted of picking the animal up by the base of the tail, restraining it briefly and placing it on the arm. The animals were weighed on a weekly basis. In weeks 4, 5 and 6 after arrival, the animals were tested in three behavioral tests (described below; ). All behavioral tests were performed between 10:00AM and 2:00PM. For obvious reason, it was impossible to do the behavioral testing blind with respect to the factor ‘light regime’. Furthermore, the trained behavioral observers were also not blind to the ‘mouse substrain’. However, due to the large number of behaviors observed and the absence of specific predictions regarding substrain and/or light regime effects, we feel that – although the observers were not blind to the experimental conditions – it seems unlikely that any consequential bias was introduced. Blood samples were taken via tail incision after 2 weeks of habituation and 2 days before each behavioral test in order to determine the magnesium concentration in plasma (Labots et al., Citation2016). An incision was made in the tail vein and the blood was collected dropwise (Dürschlag et al., Citation1996).
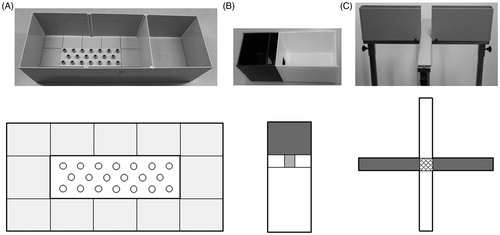
Figure 2. Pictures and schematic overviews of the behavioral set-ups used in this experiment. A: the modified Hole Board (mHB), B: the light-dark box (LD) and C: the elevated plus maze (EPM). The (light) grey areas represent the dark/’protected’ area and the white areas represent the light compartment/sections in the behavioral test set-ups. The grid lines represent the center of the EPM.
Modified hole board
The mHB is an unconditioned behavioral test in which a broad behavioral spectrum can be measured in one single test (, panel A). This multidimensional set-up combines features from the open field (OF; measuring thigmotaxis), the LD (measuring the avoidance of a well-lit area) and a traditional hole board. A detailed description can be found in Labots et al. (Citation2015). A stage light above the mHB induces a difference in light intensity between the box (protected area) and the board (unprotected area). In the conventional light regime part of the study, the light intensity difference was ∼300 lx (box: ∼150 lx and board: ∼450 lx), where it was ∼115 lx in the reversed light regime part of the study (box: ∼0–5 lx and board: ∼120 lx). Variables describing anxiety-related behavior, exploration and locomotion were scored by a trained observer using Observer 5.0 (Noldus Information Technology, Wageningen, the Netherlands) and the list of variables measured is shown in Supplementary Table S1. The animals had 5 min to freely move around and the apparatus was cleaned with tap water between each trial.
Light-dark box
The LD apparatus is made completely out of Plexiglas and consists of a dark compartment (15 × 20 × 25 cm, l × w × h), light compartment (30 × 20 × 25 cm) and a tunnel (5.5 × 6 × 9.5 cm) connecting these compartments (, panel B). The apparatus is without a ceiling and the light compartment is illuminated by a stage light to ∼650 lx. The light intensity of the dark compartment was ∼5 lx. The animals were placed in the dark compartment facing away from the tunnel as a starting position. The animals were allowed to freely explore the compartments for 5 min. Supplementary Table S1 contains a list of variables that were measured and all behavior was scored using Observer 5.0 (Noldus Information Technology, Wageningen, the Netherlands). The apparatus was cleaned with tap water between each trial.
Elevated plus maze
The EPM apparatus is made from grey PVC and consists of a central platform (6 × 6 cm), two open arms (28 × 6 cm) and two enclosed arms with side and end walls (28 × 6 × 16 cm). This plus-shaped figure is elevated to 84 cm from the floor (, panel C). The light intensity in the conventional light regime is ∼75 lx and 1–5 lx in the reversed light regime. The animal was placed on the central platform facing the closed arm as a starting point and was allowed to explore the apparatus for 5 min. An overview of the behavioral variables measured is listed in Supplementary Table S1 and the behavior is scored using Observer 5.0 (Noldus Information Technology, Wageningen, the Netherlands). The apparatus was cleaned with tap water between each trial.
Statistics
All statistical analyses were carried out using an IBM SPSS Statistics for Windows, version 22 (IBM Corp., Armonk, NY) computer program and according to Field (Citation2009). The assumptions that underlie the various statistical procedures were taken into account. Two-sided, exact (i.e. for the nonparametric tests) probabilities were estimated throughout. Continuous numerical data (latency and relative duration of behavioral variables) were described by means and standard error of the mean (SEM). Discrete numerical data (frequency of behavioral variables) were presented as medians with the interquartile range. The Kolmogorov–Smirnov one-sample test was used to check normality of the continuous numerical data. This was done per group and led to the conclusion that several variables were not normally distributed; these variables were rank-transformed (Conover & Iman, Citation1981).
Untransformed (normally distributed) behavioral continuous numerical data (except latencies) were tested for significant differences by two-way analysis of variance (ANOVA) with main between-subject factors substrain (S) and light regime (L). For these ANOVAs, homoscedasticity was tested by the Levene’s test, which is a powerful and robust test based on the F-statistic. If the variances were unequal, the continuous variable in question was rank-transformed. Discrete numerical data (frequencies) were rank-transformed. Rank-transformed behavioral (continuous and discrete) numerical data were subjected to a two-way ANOVA. An ANOVA performed on ranked data is also known as the Scheirer-Ray-Hare extension of the Kruskal–Wallis test (Scheirer et al., Citation1976). Group means of the continuous behavioral variables (except latencies) were additionally compared with the unpaired Student’s t-test for normally distributed data and the Wilcoxon–Mann–Whitney test for non-normally distributed data. When the separate variance estimates were unequal in the Student’s t-test (tested with the Levene’s test), the Welch–Satterthwaite correction was used. Post hoc comparisons of the discrete numerical data were made with the Wilcoxon–Mann–Whitney test. Latency of the behavioral variables is a time to an event variable and therefore it was analyzed as survival data with Cox proportional hazards regression. In the Cox proportional hazards regression S, L and S × L were considered as possible covariates. Post hoc comparisons were also made with Cox proportional hazards regression, but now with group (subpopulation) as covariate.
Between anxiety-, exploration- and locomotion-related behavioral variables, the Spearmans’ coefficient of rank correlation (RS) was calculated. The significance was assessed by a two-tailed test based on the t-statistic.
Since avoidance variables can be activity-dependent, an analysis of covariance (ANCOVA) was performed with substrain and light regime as main factors and ‘Latency until first-line crossing’ for the avoidance variables in the mHB as covariate and ‘Total number of closed arm entries’ as covariate for the EPM avoidance variables. Similar to the two-way ANOVA, the variables were rank-transformed when the variances were unequal. Post hoc comparisons of the behavioral data were performed as ANCOVAs between the groups (subpopulations) in order to incorporate the covariates in the analysis.
To take the greater probability of a Type I error due to multiple hypotheses into account, a more stringent criterion should be used for statistical significance (i.e. for the ANOVA, ANCOVA, Cox proportional hazards regression, unpaired Student’s t-test and Wilcoxon–Mann–Whitney test). We approached this problem by calculating for each behavioral dimension separate so-called Dunn–Šidák corrections (AN(C)OVAs and Cox proportional hazards regressions, comparing four groups: α = 1 − [1 − 0.05]1/γ; γ = number of variables per behavioral dimension; unpaired Student’s t-test, Wilcoxon–Mann–Whitney test, ANCOVA and Cox proportional hazards regressions, comparing two groups: α = 1 − [1 − 0.05]1/λ; λ = number of variables per behavioral dimension multiplied by the number of times a group is used for a comparison). We did not use a highly conservative overall Bonferroni correction because of the large numbers of tests. In Supplementary Tables S2 and S3, the relevant (corrected) thresholds are indicated per behavioral dimension.
Calculating numerous correlations also increase the risk of a Type I error. To avoid this, the level of statistical significance of the Spearmans’ correlation coefficients (RS) was adjusted by also using the Dunn–Šidák method (α = 1 − [1 − 0.05]1/κ; κ = total number of behavioral variables = 45). In all other cases, the probability of a Type I error <0.05 was taken as the criterion of significance.
In this study, 45 behavioral variables were measured with a variable to sample size ratio of 1:2.1. It is therefore not possible to perform a principal component analysis (PCA) or factor analysis (FA), due to the assumptions underlying the analyses (Budaev, Citation2010) stating that this ratio is too low.
Results
shows the selection of the behavioral variables measured in the three behavior tests. It contains one variable per behavioral dimension per test. The remaining behavioral results are presented in Supplementary Tables S2 and S3.
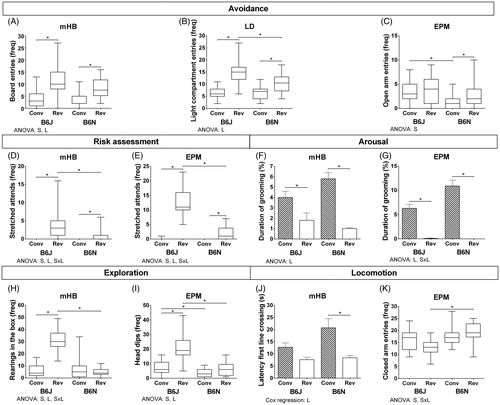
Figure 3. Selection of behavioral variables for each behavioral dimension measured in the mHB, LD and EPM. The remaining outcomes are presented in Supplementary Table S2. The frequencies of the variables are presented as medians with their IQR and the continuous data as means and SEM. Significant between-subject factors substrain (S) and light regime (L) and their interaction (S × L) resulting from the two-way ANOVA are presented below each graph and significant post hoc effects are indicated by *. Significance thresholds from the statistical analyses are presented in Supplementary Tables S2 and S3. The values are based on B6J conventional n = 23, B6J reversed n = 23, B6N conventional n = 23, B6N reversed n = 24.
Avoidance (, panels A–C; Supplementary Tables S2 and S3, Supplementary Figure S1)
All avoidance variables in the mHB (panel A) were influenced by the light regime (frequency board entries: F(1,89) = 72.07, p < .0000; latency board entries: HR = 3.66, 95% CI = 2.23–6.00, p = .0005; duration board entries: F(1,89) = 41.43, p < .0000), where both substrains under the reversed light regime had a higher total number of board entries (B6J: U = 61.5, z = −4.49, p < .0000; B6N: U = 59.0, z = −4.64, p < .0000), a shorter latency until board entrance (B6J: HR = 2.97, 95% CI = 1.51–5.86, p = .0022; B6N: HR = 5.15, 95% CI = 2.30–11.50, p = .0001) and a higher relative duration on the board (B6J: t(44) = −4.11, p = .0002; B6N: t(45) = −5.08, p < .0000) compared to their counterparts under the conventional light regime. The survival plot of the significant effect in the latency variable is shown in Supplementary Figure S1. The ANOVA resulted in a significant substrain effect in the frequency of board entries (F(1,89) = 6.32, p = .0137).
Both substrains in the LD (panel B) had a higher frequency and longer duration of light compartment entries when housed under a reversed light regime (frequency: B6J: U = 32.5, z = −5.11, p < .000; B6N: U = 108.5, z = −3.58, p < .000; duration: B6J: t(44) = −6.50, p < .000; B6N: t(36.9) = −4.92, p < .000 (Welch–Satterthwaite correction)). In addition, the two-way ANOVA revealed a substrain effect in relative duration of light compartment entries (F(1,89) = 7.56, p = .0072). The post hoc comparisons determined that the B6J showed a higher frequency of light compartment entries compared to the B6N housed under a reversed light regime (U = 138.5, z = −2.94, p = .0028).
B6N mice in the EPM (panel C) housed in the reversed light regime showed a higher frequency in the open arm compared to B6N animals in the conventional light regime (U = 152.0, z = −2.71, p = .0061). A substrain effect became evident under the conventional light regime for the frequency and relative duration of the open-arm entries (frequency: F(1,89) = 13.02, p = .0005; duration: F(1,89) = 15.64, p = .0002, where the B6J mice showed significantly more and longer entries to the open arm compared to B6N (frequency: U = 106.5, z = −3.54, p = .0003; duration: U = 111.5, z = −3.40, p = .0005).
Risk assessment (, panels D and E; Supplementary Tables S2 and S3, Supplementary Figure S2)
Analysis (ANOVA and post hoc) of the total number of stretched attends in the mHB (panel D) showed for both substrains significant differences between light regimes (substrain: F(1,89) = 17.32, p = .0001; light regime: F(1,89) = 67.91, p < .0000; interaction: F(1,89) = 17.32, p = .0001): there were more stretched attends under the reversed light regime (B6J: U = 57.5, z = −5.17, p = .0001; B6N: U = 195.5, z = −2.77, p = .0094). In the reverse light regime, B6J mice showed more stretched attends and had a shorter latency until the first stretched attend compared to B6N mice (frequency: U = 112.0, z = −3.70, p = .0001; latency: HR = 0.222, 95% CI = 0.092–0.535, p = .0008). Similarly, the ANOVA resulted in significant substrain (F(1,89) = 56.52, p < .0000), light regime (F(1,89) = 329.57, p < .0000) and their interaction (F(1,89) = 47.82, p < .0000) differences in the total number of stretched attends in the EPM (panel E). B6J mice showed more stretched attends in the EPM than B6N mice under the reversed light regime (U = 8.5, z = −5.72, p < .0000) and their conventional regime counterparts (U = 0.0, z = −6.17, p < .0000). The survival plot of the significant effect in the latency variable is shown in Supplementary Figure S2.
Arousal (, panels F and G; Supplementary Tables S2 and S3, Supplementary Figures S1 and S2)
Self-grooming as an indication for arousal in the mHB (panel F) was also affected by the light regime (frequency: F(1,89) = 15.65, p = .0002; latency: HR = 0.34, 95% CI = 0.22–0.53, p < .0000; duration: F(1,89) = 92.74, p < .0000), where B6N shows less frequency of grooming (U = 66.0, z = −4.65, p < .0000) and both substrains a higher latency (B6J: HR = 0.39, 95% CI = 0.21–0.73, p = .0031; B6N: HR = 0.27, 95% CI = 0.14–0.50, p < .0000) and a lower relative duration (B6J: U = 73.0, z = −4.21, p < .0000; B6N: U = 31.5, z = −5.21, p < .0000) in grooming under the reversed compared to conventional light regime. A substrain × light regime was found in the frequency of grooming (F(1,89) = 13.77, p = .0004). A substrain difference was revealed in the defecation (F(1,89) = 14.20, p = .0003) and urination (F(1,89) = 5.56, p = .0205) variables, with a substrain × light regime interaction in the total number of urinations (F(1,89) = 12.94, p = .0005). The B6N mice showed more excretion (boli: U = 104.5, z = −4.01, p < .0000 and urinations: U = 126.0, z = −3.53, p = .0003) and a shorter latency until first bolus or urination compared to the B6J mice under the conventional light regime (defecation: HR = 13.12, 95% CI = 3.00–57.49, p = .0006; urination: HR = 6.53, 95% CI = 1.87–22.86, p = .0033). The survival plots of the significant effects in the latency variables are shown in Supplementary Figure S1.
A light regime effect was found in all grooming variables in the EPM (panel G; frequency: F(1,89) = 475.20, p < .0000; latency: HR=.01, 95% CI = 0.002–0.044, p < .0000; duration: F(1,89) = 512.33, p < .0000) and the substrain × light regime interaction (frequency: F(1,89) = 8.58, p = .0043; duration: F(1,89) = 10.65, p = .0016), where both substrains show a significantly higher frequency (B6J: U = 4.50, z = −5.99, p < .0000; B6N: U = 0.50, z = −6.26, p < .0000), lower latency (B6J: HR = 0.029, 95% CI = 0.006–0.132, p < .0000; B6N: HR = 0.003, 95% CI = 0.000–0.149, p = .0036) and spent more time self-grooming (B6J: U = 1.00, z = −6.04, p < .0000; B6N: U = 0.00, z = −6.25, p < .0000) in the conventional light regime. The frequency of the excretion variables was significantly influenced by substrain (defecation: F(1,89) = 12.09, p = .0008; urination: F(1,89) = 7.55, p = .0072), light regime (defecation: F(1,89) = 11.20, p = .0012; urination: F(1,89) = 7.55, p < .0072) and their interaction (defecation: F(1,89) = 13.34, p = .0004; urination: F(1,89) = 27.78, p < .0000). B6N mice excreted more feces and urine under the conventional light regime when compared to their B6J counterparts (defecation: U = 125.0, z = −3.56, p = .0003; urination: U = 126.5, z = −3.95, p = .0001) or their reversed light regime counterparts (defecation: U = 120.0, z = −3.83, p = .0001; urination: U = 132.0, z = −4.02, p < .0000). The survival plots of the significant effects in the latency variables are shown in Supplementary Figure S2.
Exploration (, panels H and I; Supplementary Tables S2 and S3, Supplementary Figures S1 and S2)
Substrain, light regime effects and their interaction were also revealed in the exploration-related variables in the mHB (panel H; Supplementary Table S2). In addition, the B6J housed under the reversed light regime showed more rearings in the box (U = 0.00, z = −5.88, p < .0000) and on the board (U = 154.5, z = −2.91, p = .0029) compared to their B6N counterparts. Also, the B6J housed under the reversed light regime showed more rearings in the box (U = 1.50, z = −5.78, p < .0000) and on the board (U = 101.0, z = −4.27, p < .0000) compared to their conventional light regime counterparts. The survival plots of the significant effects in the latency variables are shown in Supplementary Figure S1.
In the EPM (panel I), a light regime (F(1,89) = 30.02, p < .0000) and S × L interaction (F(1,89) = 10.56, p = .0016) was found in the frequency of rearing in the open arm. B6N medians (frequency) for rearings in the open arms were higher under the conventional light regime compared to the B6N housed under the reverse light regime (U = 96.0, z = −4.63, p < .0000). For the total number of head dips, there were significant substrain (F(1,89) = 61.64, p < .0000) and light regime effects (F(1,89) = 37.26, p < .0000). The frequency and latency of head dips were higher and lower, respectively, for B6J mice under the reversed light regime (frequency: U = 33.5, z = −5.17, p < .0000; latency: HR = 0.26, 95% CI = 0.12–0.53, p = .0002). The survival plots of the significant effects in the latency variables are shown in Supplementary Figure S2.
Locomotion (, panels J and K; Supplementary Tables S2 and S3, Supplementary Figure S1)
The B6N animals in the reversed light regime in the mHB (panel J) exhibited higher group medians for the number of line crossings (U = 79.0, z = −4.20, p < .0000) and lower group means for latency until first-line crossing (HR = 3.24, 95% CI = 1.69–6.21, p = .0004) compared to their counterparts in the conventional light regime. Additionally, the ANOVA resulted in a significant S × L interaction effect in the total number of light crossings (F(1,89) = 7.96, p = .0059). The survival plot of the significant effect in the latency variable is shown in Supplementary Figure S1. The ANOVA resulted in significant S × L interaction in the total number of arm visits (F(1,89) = 5.81, p = .0180) and total number of closed arm visits (F(1,89) = 6.16, p = .0149) in the EPM (panel K), B6N compared to B6J mice showed more arm entries (U = 145.5, z = −2.78, p = .0047) and closed arm entries (U = 81.0, z = −4.16, p < .0000) in the reversed light regime.
Inter-test correlations (Supplementary Tables S4–S6)
There were a number of significant correlations (p < .001139) of the variables of the behavioral dimensions between the three tests (for a complete overview, see Supplementary Tables S4–S6). The avoidance variables of the mHB were all significantly correlated with the frequency (RS = 0.665, RS = −0.494, RS = 0.566) and relative duration (RS = 0.652, RS = −0.496, RS = 0.563) of the avoidance variables of the LD, but not with the avoidance variables of the EPM. However, the mHB avoidance variables were significantly correlated with the risk assessment (frequency: RS = 0.599, RS = −0.362, RS = 0.526, latency: RS = −0.572, RS = 0.334, RS = −0.521) and grooming (frequency: RS = −0.581, RS = 0.410, RS = −0.518; latency: RS = 0.554, RS = −0.375, RS = 0.499; duration: RS = −0.571, RS = 0.377, RS = −0.524) variables in the EPM. The frequency and relative duration of the avoidance variables of the LD were positively correlated with the total open-arm entries in the EPM (RS = 0.342, RS = 0.345, respectively). The frequency and latency of the stretched attends were highly correlated between mHB and EPM (frequency: RS =0.599, RS = −0.362; latency: RS = −0.572, RS = 0.334). All grooming variables in the mHB were correlated with the grooming variables in the EPM (frequency: RS =0.395, RS = −0.555, RS =0.693; latency: RS = −0.342, RS =0.514, RS = −0.650; duration: RS =0.374, RS = −0.546, RS =0.668). The urination variables in the mHB were correlated with the excretion variables in the EPM (boli frequency: RS = 0.381, −0.409; latency: RS = −0.377, RS =0.413; urination frequency: RS =0.466, RS = −0.494; latency: RS = −0.488, RS = 0.472). Notably, the number and latency of hole explorations in the mHB were significantly correlated with all risk assessment (frequency: RS =0.646, RS = −0.518; latency: RS = −0.644, RS =0.502) and grooming (frequency: RS = −0.590, RS =0.577; latency: RS =0.584, RS = −0.567; duration: RS = −0.610, RS =0.590) variables in the EPM. Finally, the locomotor variables measured in the mHB were not significantly correlated with the number of (closed) arm visits in the EPM.
ANCOVA (; Supplementary Table S7)
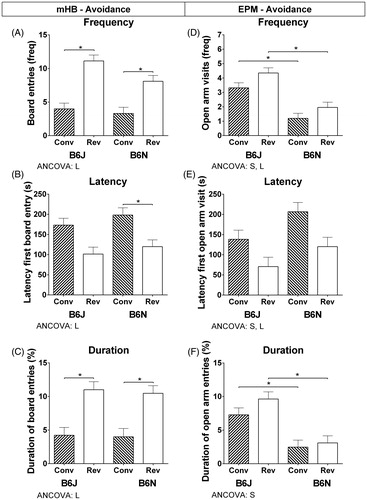
Besides the inter-test correlations in Supplementary Tables S4–S6, the correlations also reveal a correlation between the locomotion variable ‘Latency until the first-line crossing’ in the mHB and the three avoidance variables in the mHB (RS = −0.416; RS = 0.372; RS = −0.366). In addition, the locomotion variable ‘Total number of closed arm visits’ in the EPM was correlated with the frequency and duration of open-arm visits in the EPM (RS = 0.500; RS = 0.432). Since avoidance parameters can be activity dependent, an ANCOVA was performed with ‘Latency until first-line crossing’ as a covariate for the mHB avoidance variables and ‘Total number of closed arm visits’ as a covariate for the EPM avoidance variables. The adjusted values resulting from the ANCOVA are presented in (and Supplementary Table S7). In the mHB, the light regime effect has remained (frequency: F(1,88) = 50.26, p < .0000; latency: F(1,88) = 13.33, p = .0004; duration: F(1,88) = 28.33, p < .0000), where the substrain effect as shown in , panel A has disappeared. The substrains show a significantly higher frequency (B6J: F(1,43) = 19.73, p = .0001; B6N: F(1,44) = 24.81, p < .0000) and duration (B6J: F(1,43) = 11.31, p = .0116; B6N: F(1,43) = 20.80, p < .0000), and lower latency (except for B6J) (B6N: F(1,44) = 8.66, p = .0052) in the reversed light regime. On the other hand, the ANCOVA on the variables of the EPM showed besides the light regime effects (frequency: F(1,88) = 6.58, p = .0120; latency: F(1,88) = 11.64, p = .0010) also substrain differences (frequency: F(1,88) = 39.60, p < .0000; latency: F(1,88) = 6.46, p = .0128; duration: F(1,88) = 28.75, p < .0000). The post hoc comparisons resulted in a lower frequency (conventional: F(1,43) = 22.06, p < .0000; reversed: F(1,44) = 24.02, p < .0000) and duration of the open-arm entries (conventional: F(1,43) = 12.85, p = .0009; reversed: F(1,44) = 19.82, p = .0001) of the B6N compared to B6J.
Figure 4. ANCOVA results for avoidance variables in the mHB and EPM. Adjusted means and SEMs resulting from the ANCOVA with ‘Latency until first-line crossing’ as covariate for the mHB avoidance variables (A–C) and ‘Total number of closed-arm entries’ as a covariate for the EPM avoidance variables (D–F). Significant (p < .016952) between-subject factors substrain (S) and light regime (L) and their interaction (S × L) are presented below each graph and significant post hoc effects (p < .008512) are indicated by *. The values are based on B6J conventional n = 23, B6J reversed n = 23, B6N conventional n = 23, B6N reversed n = 24.
Discussion
This study shows that B6J and B6N, two substrains from C57BL/6 mouse strain, housed under different light regimes and tested on unconditioned behavior in three tests, respond differently to distinct light regimes in certain behavioral dimensions ( and ).
A number of studies comparing substrains from the C57BL/6 inbred mouse strain have been performed and an overview can be found in Bryant et al. (Citation2008). Confirming earlier findings that behavior is greatly influenced by small genetic differences (Kiselycznyk & Holmes, Citation2011; Matsuo et al., Citation2010; Zurita et al., Citation2011), this study showed various effects of substrain in the three behavior tests used. Although many substrain studies have been performed, only a few studies have compared the specific substrains featured in this study for behavioral analyses (Müller et al., Citation2009; Siegmund & Wotjak Citation2007; Siegmund et al., Citation2005, Citation2009; Stiedl et al., Citation1999). An overview of the findings is found in . Siegmund et al. (Citation2009) showed substrain effects in the number of board entries in the mHB, where B6J revealed more board entries compared to the B6N. These findings are in accordance with the results of this study, which showed substrain effects in the frequency of board entries in the mHB (, panel A), the duration in light compartment entries in the LD (Supplementary Table S2) and in frequency and duration of open-arm entries in the EPM (, panel C and Supplementary Table S2), indicating that an overall effect of substrain was observed in avoidance behavior (i.e. B6J show lower avoidance behavior compared to B6N). One of the structural variants that distinguish B6J and B6N is the intronic deletion in the Csmd1 (CUB and Sushi multiple domains 1; located on mouse chromosome 8) gene (Simon et al., Citation2013). Interestingly, Steen et al. (Citation2013) generated a Csmd1 knockout by deleting a 1 kb sequence from exon/intron1; these mice developed an anxiety-like phenotype in the OF and EPM. Another interesting structural variant that differs between the two twin strains is a deletion in the Pde4b (phosphodiesterase 4B, cAMP specific; located on mouse chromosome 4) gene (Simon et al., Citation2013). Pde4b knockout mice show anxiogenic-like behavior in the hole board, LD and OF tests (Zhang et al., Citation2008). In contrast, however, Siegmund et al. (Citation2005), Siegmund and Wotjak (Citation2007) and Müller et al. (Citation2009) found no substrain differences in the LD, mHB and LD, and OF, respectively. These differences may be explained by confounding effects of general locomotory activity, in that the present study found B6N to have a higher locomotion in the EPM as compared to B6J animals when tested under reversed light regime, whereas both Siegmund and Wotjak (Citation2007) and Siegmund et al. (Citation2009) found B6J to exhibit more horizontal locomotion/line crossings compared to B6N. When locomotion variables were incorporated in the statistical analysis as covariates, the substrain effect disappeared in the avoidance variables of the mHB (), indicating that locomotion indeed has an influence on avoidance in the mHB. The substrain effects in the avoidance variables of the EPM, however, were not confounded by locomotor activity, since those effects remain after the incorporation of the covariate.
Table 1. Overview substrain differences other studies.
Another possible explanation for the inconsistencies between studies can be influences of environmental background (Crabbe et al., Citation1999). Although the order of testing, procedural handling and the dimensions of the apparatus were standardized, certain non-standardized factors such as breeding environment and date/season of testing can have an effect on behavioral outcomes. Müller et al. (Citation2009) compared substrains from the same supplier, but originating from a different barrier, resulting in significant differences in sensitivity to pilocarpine within a substrain between barriers. It may be hypothesized that differences found between studies can be influenced – in addition to the above-mentioned environmental influences – by the barrier the animals are originating from at the supplier (Crabbe et al., Citation1999; Müller et al., Citation2009). In addition to the originating barrier, mouse behavior can be influenced by the type of handling at the supplier (Miller & Leach, Citation2016), the mode of transport to the research facility (Swallow et al., Citation2005) and acclimatization period (Obernier & Baldwin, Citation2006).
Alongside the substrain effects as such, it became apparent that the light regime under which the experiments were executed are of a large effect on the behavioral results. Most variables in the mHB, LD and EPM revealed significant differences between the two light regimes although this effect appeared more prominently in some tests compared to others. For instance, the light regime effect on avoidance variables recorded from the mHB and LD tests was stronger than that resulting from the EPM. The effect of light regime confirmed earlier studies on the activity, the increased discrimination between genetically distinct mice and the affected cognition of the animals (Hossain et al., Citation2004; Roedel et al., Citation2006). Mice are nocturnal animals and therefore show a higher activity in the dark as numerous studies have shown (e.g. Hossain et al., Citation2004; Smith et al., Citation2015). Similarly, the animals in this study also showed higher locomotion in the mHB when housed under reversed light regime. Again, this effect on locomotion did not come forward in the EPM. Furthermore, the animals showed more anxiety-related behavior in the conventional light regime in the mHB even when locomotion was taken as a covariate in the analysis. Thus, when selecting the experimental set-up (i.e. light conditions) and behavior test, it is important to note that the light regime had a larger effect on avoidance behavior and locomotion in the mHB as compared to the EPM.
These findings are further underlined by inter-test correlations which resulted in a number of significant correlations between the behavioral variables of the three tests. Comparable to the PCA and correlations in O’Leary et al. (Citation2013), avoidance variables measured in the mHB and LD test turn out to be correlated, which is not the case for avoidance variables resulting from EPM testing. This, indeed, would be in line with considerations by Milner and Crabbe (Citation2008), who hypothesized that avoidance variables as measured in the Elevated Zero Maze (EZM) may describe a different aspect of avoidance behavior than LD and OF test actually do. Accordingly, results in the present study show that EPM variables may be assessing a different component of avoidance behavior than the mHB and LD test, for example, acrophobia (fear due to height; Kalueff et al., Citation2008) induced avoidance/anxiety. Other indications of anxiety-related EPM behavior (i.e. grooming and risk assessment); however, significantly correlated with mHB avoidance variables, a correlation between behavioral tests that is in line with literature findings (O’Leary et al., Citation2013). However, Milner and Crabbe (Citation2008) interpreted some locomotion-related variables (of the LD and EZM) to be bound to the same factor, whereas variables obtained from OF-testing (‘line crosses from periphery to center’ and ‘line crosses in center’) were arranged in a different category.
Besides the aforementioned test-related differences, it appeared that the effect of light regime was substrain specific for certain behavioral variables of most behavioral dimensions in all three tests (except for the avoidance variables in the mHB). In conclusion, and confirming earlier findings, both substrain and light regime can have a large effect on behavioral performance in mice. Extending on these results, the present study reports that the effect of light regime is, at least in part, both substrain- and test-specific. Since B6J and B6N are widely used in mouse knockout studies, the present phenotypic substrain differences have the potential to impact upon penetrance and expressivity of mutational effects on behavior in the these twin strains.
Labots_et_al_supplemental_content.docx
Download MS Word (584.4 KB)Acknowledgements
We wish to thank Anne-Marie Baars, José Lozeman-van’t Klooster, Marla Lavrijsen, Peter Hesseling and Susanne Kirchhoff for their help with the animal procedures and lab assistance. Additionally, we would like to thank Anne-Marie Baars for photographing and editing the images of the behavioral test set-ups. The authors are grateful to two anonymous reviewers for their valuable comments on the manuscript, which has undoubtedly helped the authors to improve the article. We also thank prof. dr. Louk Vanderschuren for comments on an earlier version of this manuscript.
Disclosure statement
The authors declare that they have no conflict of interest.
Funding
This study was funded by the Faculty of Veterinary Medicine, Utrecht University, the Netherlands. The funder had no influence on the study design, execution, analyses and publication.
Related Research Data
References
- Beck, J.A., Lloyd, S., Hafezparast, M., Lennon-Pierce, M., Eppig, J.T., Festing, M.F., & Fisher, E.M. (2000). Genealogies of mouse inbred strains. Nature Genetics, 24, 23–25. doi: 10.1038/71641.
- Bryant, C.D., Zhang, N.N., Sokoloff, G., Fanselow, M.S., Ennes, H.S., Palmer, A.A., & McRoberts, J.A. (2008). Behavioral differences among C57BL/6 substrains: Implications for transgenic and knockout studies. Journal of Neurogenetics, 22, 315–331. doi: 10.1080/01677060802357388.
- Budaev, S.V. (2010). Using principal components and factor analysis in animal behaviour research: Caveats and guidelines. Ethology, 116, 472–480. doi: 10.1111/j.1439-0310.2010.01758.x.
- Charles River. (2011). Research Models C57BL/6 Mice. Retrieved October 7, 2015, from http://www.criver.com/files/pdfs/rms/c57bl6/rm_rm_d_c57bl6n_mouse.aspx.
- Conover, W., & Iman, R. (1981). Rank transformations as a bridge between parametric and nonparametric statistics. American Statistician, 35, 124–129. doi: 10.2307/2683975.
- Cook, M.N., Bolivar, V.J., McFadyen, M.P., & Flaherty, L. (2002). Behavioral differences among 129 substrains: Implications for knockout and transgenic mice. Behavior in Neuroscience, 116, 600–611. doi: 10.1037/0735-7044.116.4.600.
- Crabbe, J.C., Wahlsten, D., & Dudek, B.C. (1999). Genetics of mouse behavior: Interactions with laboratory environment. Science, 284, 1670–1672. doi: 10.1126/science.284.5420.1670.
- Crawley, J.N. (2007). What’s wrong with my mouse? Behavioral phenotyping of transgenic and knockout mice. 2nd ed. Hoboken, NJ: John Wiley & Sons.
- Dürschlag, M., Würbel, H., Stauffacher, M., & von Holst, D. (1996). Repeated blood collection in the laboratory mouse by tail incision-modification of an old technique. Physiological Behavior, 60, 1565–1568. doi: 10.1016/S0031-9384(96)00307-1.
- Field, A. (2009). Discovering statistics using SPSS. 3rd ed. London: Sage.
- Harlan Laboratories. (2013). Harlan Laboratories Substrain Information C57BL/6. Retrieved October 7, 2015, from http://www.harlan.com/education_and_resources/literature/research_model_data_sheets.hl.
- Hossain, S., Wong, B., & Simpson, E. (2004). The dark phase improves genetic discrimination for some high throughput mouse behavioral phenotyping. Genes, Brain and Behavior, 3, 167–177. doi: 10.1111/j.1601-183x.2004.00069.x.
- Kalueff, A.V., Ishikawa, K., & Griffith, A.J. (2008). Anxiety and otovestibular disorders: Linking behavioral phenotypes in men and mice. Behavior Brain Research, 186, 1–11. doi: 10.1016/j.bbr.2007.07.032.
- Kiselycznyk, C., & Holmes, A. (2011). All (C57BL/6) mice are not created equal. Frontiers in Neuroscience, 5, 10. doi: 10.3389/fnins.2011.00010.
- Labots, M., van Lith, H.A., Ohl, F., & Arndt, S.S. (2015). The modified hole board – Measuring behavior, cognition and social interaction in mice and rats. Journal of Visualized Experiments, 98, e52529. doi: 10.3791/52529.
- Labots, M., Zheng, X., Moattari, G., Lozeman-van’t Klooster, J.G., Baars, J.M., Hesseling, P., … van Lith, H.A. (2016). Substrain and light regime effects on integrated anxiety-related behavioral z-scores in male C57BL/6 mice – Hypomagnesaemia has only a small effect on avoidance behavior. Behavioral Brain Research, 306, 71–83. doi: 10.1016/j.bbr.2016.01.060.
- Lister, R.G. (1990). Ethologically-based animal models of anxiety disorders. Pharmacological Therapy, 46, 321–340. doi: 10.1016/0163-7258(90)90021-S.
- Matsuo, N., Takao, K., Nakanishi, K., Yamasaki, N., Tanda, K., & Miyakawa, T. (2010). Behavioral profiles of three C57BL/6 substrains. Frontiers in Behavioral Neuroscience, 4, 29. doi: 10.3389/fnbeh.2010.00029.
- McIlwain, K.L., Merriweather, M.Y., Yuva-Paylor, L.A., & Paylor, R. (2001). The use of behavioral test batteries: Effects of training history. Physiological Behavior, 73, 705–717. doi: 10.1016/S0031-9384(01)00528-5.
- Mekada, K., Abe, K., Murakami, A., Nakamura, S., Nakata, H., Moriwaki, K., … Yoshiki, A. (2009). Genetic differences among C57BL/6 substrains. Experimental Animals, 58, 141–149. doi: JST.JSTAGE/expanim/58.141.
- Miller, A.L., & Leach, M.C. (2016). The effect of handling method on the mouse grimace scale in two strains of laboratory mice. Laboratory Animals, 50, 305–307. doi: 10.1177/0023677215622144.
- Milner, L.C., & Crabbe, J.C. (2008). Three murine anxiety models: Results from multiple inbred strain comparisons. Genes, Brain and Behavior, 7, 496–505. doi: 10.1111/j.1601-183X.2007.00385.x.
- Montgomery, K.C. (1955). The relation between fear induced by novel stimulation and exploratory behavior. Journal of Comparative and Physiological Psychology, 48, 254–260. doi: 10.1037/h0043788.
- Müller, C.J., Gröticke, I., Hoffmann, K., Schughart, K., & Löscher, W. (2009). Differences in sensitivity to the convulsant pilocarpine in substrains and sublines of C57BL/6 mice. Genes, Brain and Behavior, 8, 481–492. doi: 10.1111/j.1601-183X.2009.00490.x.
- Obernier, J.A., & Baldwin, R.L. (2006). Establishing an appropriate period of acclimatization following transportation of laboratory animals. ILAR Journal, 47, 364–369. doi: 10.1093/ilar.47.4.364.
- Ohl, F. (2005). Animal models of anxiety. Handbook of Experimental Pharmacology, 169, 35–69. doi: 10.1007/3-540-28082-0_2.
- O’Leary, T.P., Gunn, R.K., & Brown, R.E. (2013). What are we measuring when we test strain differences in anxiety in mice? Behavior Genetics, 43, 34–50. doi: 10.1007/s10519-012-9572-8.
- Paylor, R., Spencer, C.M., Yuva-Paylor, L.A., & Pieke-Dahl, S. (2006). The use of behavioral test batteries, II: Effect of test interval. Physiological Behavior, 87, 95–102. doi: 10.1016/j.physbeh.2005.09.002.
- Roedel, A., Storch, C., Holsboer, F., & Ohl, F. (2006). Effects of light or dark phase testing on behavioural and cognitive performance in DBA mice. Laboratory Animals, 40, 371–381. doi: 10.1258/002367706778476343.
- Sacca, R., Elder, B., & Wasson, K. (2013). The C57BL/6 Mouse: The Role of the C57BL/6N Mouse in the Creation of Future Genetically Engineered Models. Charles River Laboratories International Inc. Retrieved October 7, 2015, from http://www.criver.com/files/pdfs/rms/c57bl6/rm_rm_r_c57bl6_white_paper.aspx.
- Scheirer, C.J., Ray, W.S., & Hare, N. (1976). The analysis of ranked data derived from completely randomized factorial designs. Biometrics, 32, 429–434. doi: 10.2307/2529511.
- Siegmund, A., Dahlhoff, M., Habersetzer, U., Mederer, A., Wolf, E., Holsboer, F., & Wotjak, C.T. (2009). Maternal inexperience as a risk factor of innate fear and PTSD-like symptoms in mice. Journal of Psychiatric Research, 43, 1156–1165. doi: 10.1016/j.jpsychires.2009.02.003.
- Siegmund, A., Langnaese, K., & Wotjak, C.T. (2005). Differences in extinction of conditioned fear in C57BL/6 substrains are unrelated to expression of alpha-synuclein. Behavioral Brain Research, 157, 291–298. doi: 10.1016/j.bbr.2004.07.007.
- Siegmund, A., & Wotjak, C.T. (2007). A mouse model of posttraumatic stress disorder that distinguishes between conditioned and sensitised fear. Journal of Psychiatric Research, 41, 848–860. doi: 10.1016/j.jpsychires.2006.07.017.
- Simon, M.M., Greenaway, S., White, J.K., Fuchs, H., Gailus-Durner, V., Wells, S., … Cartwright, E.J. (2013). A comparative phenotypic and genomic analysis of C57BL/6J and C57BL/6N mouse strains. Genome Biology, 14, 1–22. doi: 10.1186/gb-2013-14-7-r82.
- Smith, V.M., Jeffers, R.T., McAllister, B.B., Basu, P., Dyck, R.H., & Antle, M.C. (2015). Effects of lighting condition on circadian behavior in 5-HT1A receptor knockout mice. Physiological Behavior, 139, 136–144. doi: 10.1016/j.physbeh.2014.11.005.
- Specht, C.G., & Schoepfer, R. (2001). Deletion of the alpha-synuclein locus in a subpopulation of C57BL/6J inbred mice. BMC Neuroscience, 2, 11. doi: 10.1186/1471-2202-2-11.
- Steen, V.M., Nepal, C., Ersland, K.M., Holdhus, R., Nævdal, M., Ratvik, S.M., … Håvik, B. (2013). Neuropsychological deficits in mice depleted of the schizophrenia susceptibility gene CSMD1. PLoS One, 8, e79501. doi: 10.1371/journal.pone.0079501.
- Stiedl, O., Radulovic, J., Lohmann, R., Birkenfeld, K., Palve, M., Kammermeier, J., … Spiess, J. (1999). Strain and substrain differences in context- and tone-dependent fear conditioning of inbred mice. Behavioral Brain Research, 104, 1–12. doi: 10.1016/S0166-4328(99)00047-9.
- Swallow, J., Anderson, D., Buckwell, A.C., Harris, T., Hawkins, P., Kirkwood, J., … Thompson, K. (2005). Guidance on the transport of laboratory animals. Laboratory Animals, 1–39. doi: 10.1258/0023677052886493.
- Zhang, H., Huang, Y., Masood, A., Stolinski, L.R., Li, Y., Zhang, L., … O’Donnell, J.M. (2008). Anxiogenic-like behavioral phenotype of mice deficient in phosphodiesterase 4B (PDE4B). Neuropsychopharmacology, 33, 1611–1623. doi: 10.1038/sj.npp.13011537.
- Zurita, E., Chagoyen, M., Cantero, M., Alonso, R., Gonzalez-Neira, A., Lopez-Jimenez, A., … Montoliu, L. (2011). Genetic polymorphisms among C57BL/6 mouse inbred strains. Transgenic Research, 20, 481–489. doi: 10.1007/s11248-010-9403-8.