
Abstract
Purpose: Airway epithelial barrier leak and the involvement of proinflammatory cytokines play a key role in a variety of diseases. This study evaluates barrier compromise by the inflammatory mediator Tumor Necrosis Factor-α (TNF-α) in the human airway epithelial Calu-3 model. Methods: We examined the effects of TNF-α on barrier function in Calu-3 cell layers using Transepithelial Electrical Resistance (TER) and transepithelial diffusion of radiolabeled probe molecules. Western immunoblot analyses of tight junctional (TJ) proteins in detergent soluble fractions were performed. Results: TNF-α dramatically reduced TER and increased paracellular permeability of both 14C-D-mannitol and the larger 5 kDa probe, 14C-inulin. A time course of the effects shows two separate actions on barrier function. An initial compromise of barrier function occurs 2-4 hours after TNF-α exposure, followed by complete recovery of barrier function by 24 hrs. Beginning 48 hrs. post-exposure, a second more sustained barrier compromise ensues, in which leakiness persists through 144 hrs. There were no changes in TJ proteins observed at 3 hrs. post exposure, but significant increases in claudins-2, -3, -4, and -5, as well as a decrease in occludin were seen at 72 hrs. post TNF-α exposure. Both the 2-4 hr. and the 72 hr. TNF-α induced leaks are shown to be mediated by the ERK signaling pathway. Conclusion: TNF-α induced a multiphasic transepithelial leak in Calu-3 cell layers that was shown to be ERK mediated, as well as involve changes in the TJ complex. The micronutrients, retinoic acid and calcitriol, were effective at reducing this barrier compromise caused by TNF-α. The significance of these results for airway disease and for COVID-19 specifically are discussed.
Introduction
Proinflammatory cytokines such as TNF-α have been observed to compromise epithelial barrier function in epithelial barriers as diverse as intestine,Citation1–3 kidney,Citation4 bronchi,Citation5,Citation6 choroid plexus,Citation7 gingiva,Citation8,Citation9 cornea,Citation10 and retina.Citation11 This action is among the most biomedically problematic effects of TNF-α and is responsible for a great deal of clinical morbidity in conditions as diverse as cancer and dust mite rhinitis, to name only two.Citation12 Understanding how TNF-α and other cytokines produce barrier leak on a molecular, cellular and tissue level and the pathophysiological implications of such leak have become a highly active research area.Citation13–15 Recently, the primary targeting of airway epithelia by the SARS-CoV-2 virus has resulted in renewed interest on the effects of microbial pathogens and secondarily, proinflammatory proteins, on the airways and their barrier properties.Citation16–20
The Calu-3 human airway epithelial cell culture provides a polar, differentiated model with well-described barrier and membrane transport properties. This includes the presence of tight junctional (TJ) complexes and a functional, apically localized CFTR chloride channel.Citation21–23 Calu-3 cells have been used extensively in airway epithelial barrier function studies in a number of respiratory disease scenarios.Citation24–26 This current study represents an investigation of TNF-α induced compromise of barrier function in specifically this airway epithelial barrier model, its mediation by ERK signaling, its related TJ protein changes, and its partial inhibition by two well-known micronutrients. A very curious and previously unreported multiphasic response of barrier function to TNF-α is described here, with significant compromises of the Calu-3 barrier separated in time by 24–48 hr. The results obtained have relevance to airway disease generally but specifically to the state of airway epithelial barrier function in inflammatory “cytokine storm” environments as seen notably in COVID-19 patients.
The central role of epithelial barrier compromise and resultant lung water accumulation in a variety of airway diseases, including COVID-19, make a compelling need for well-described models of this pathophysiology.Citation27–29 In the past 2 years, a great deal has been written of a clinical nature concerning the interplay of “cytokine storm,” lung water and epithelial barrier compromise in the COVID patient.Citation30,Citation31 The ability to discover new therapeutic interventions in this disease and other related airway diseases makes an improved understanding of airway epithelial barrier compromise by proinflammatory cytokines in a high throughput model such as Calu-3, highly compelling.
Materials and methods
Cell culture
The Calu-3 cell culture, an epithelial cell line derived from human lung adenocarcinoma, was obtained from ATCC (Manassas, VA) and used for 20 weeks before returning to frozen cell stocks. Upon confluence, cells were passaged on a weekly basis by trypsinization [0.25% trypsin, 2.2 mmol/L EDTA (Corning Cellgro, Manassas, VA)]. Cells were seeded at 3.5 × 10⁶ cells/Falcon 75-cm2 culture flask with 25 mL of MEM (Corning Cellgro, Manassas, VA) supplemented with 2 mmol/L L-Glutamine and 10% fetal bovine serum (Seradigm, VMR, Inc., Radnor, PA). Cultures were incubated at 37 °C in 95% air-5% CO2 atmosphere.
Transepithelial electrophysiology and permeability measurements
Cells were seeded into sterile Millicell polycarbonate (PCF) cell culture inserts (12 mm diameter with 0.4 µm pore size [EMD Millipore, Burlington, MA]) on day 0 at a seeding density of 1.5 × 10⁵ cells/insert. PCF inserts were placed in 24 well cell culture plates. On day 1, all cell layers were refed (0.4 ml apical, 0.6 ml basal-lateral) with control medium containing 50 U/ml penicillin and 50 µg/ml streptomycin (Corning Cellgro, Manassas, VA). The same refeed procedure was performed on days 4 and 7. Treatments with TNF-α, U0126, retinoic acid, and/or calcitriol began on day 8 post-seeding (when the cell layer barrier was established).
Cell layers were refed with control medium or treatment medium on the day of experiments and allowed to incubate at 37 °C for 90 minutes prior to electrophysiological readings. Transepithelial electrical resistance (TER) was measured using an epithelial voltohmmeter (EVOM2) with STX2 “chopstick” electrodes (World Precision Instruments, LLC, Sarasota, FL). Resistance of a blank PCF insert was subtracted from each experimental value. These corrected resistances were multiplied by area (0.6cm2) to achieve ohms × cm2.
Following TER measurements, the basal-lateral medium was removed and replaced with 0.6 ml of medium containing 0.1 mM, 0.25µCi/ml 14C-D-mannitol (Perkin-Elmer, Boston, MA) or 10 µM, 0.1µCi/ml Carboxyl-14C-inulin (Perkin-Elmer, Boston, MA) and incubated at 37 °C. Triplicate 50 µl samples were taken from the basolateral medium to determine the specific activity via liquid scintillation counting (LSC). 150 µl samples were taken from the apical medium at either 60 or 90 minutes for LSC to determine transepithelial flux rates. The flux rate (in picomoles/min/cm2) was calculated for the aforementioned probes diffusing across the cell layer.
Treatment with TNF-α, U0126, retinoic acid, and calcitriol
Recombinant human TNF-α (Peprotech, Inc., Rocky Hill, NJ) was prepared as a stock solution (100 ng/µl) in culture medium and then added to culture medium to a final concentration of 150 ng/ml. TNF-α stocks were kept frozen at −80 °C and thawed only once. U0126 (Cell Signaling, Danvers, MA) was dissolved in DMSO to make a 50 mM stock and then diluted directly into culture medium for the appropriate concentration of 100 µM. Retinoic acid (Sigma Aldrich) was dissolved in ethanol to make a 33.3 mM stock and then diluted to 50 µM in culture medium, requiring heating at a temperature of 37–40 °C until completely solubilized. Calcitriol (Enzo Life Sciences, Farmingdale, NY and Sigma Aldrich) was dissolved in ethanol to make a 50 µM stock and then diluted in culture medium to 100 nM. Treatments were applied to the apical and basal-lateral cell surfaces. Appropriate vehicle controls were used.
PAGE and Western immunoblots
Cell layers were harvested from Millicell PCF inserts after washing five times in cold saline. For analyzing TJ proteins in subcellular fractions, 600 ul of Buffer A with protease and phosphatase inhibitors (but without detergent) were added. The cell layer was physically scraped off the filter at 4 °C. The resulting suspension was collected, flash-frozen, and stored at −80 °C. Sonication was performed with the Fisher Scientific Sonic Dismembrator (Model 100), Setting 3. Ultracentrifugation was performed in a Beckman Model L-80 with a Ti-70 rotor at 39,000 rpm (106,009 g) for 1 hour at 4oC, followed by solubilization of the pellet (membrane/cytoskeletal fraction) in lysis buffer for separate PAGE analysis. Precision Plus Kaleidoscope Protein Standards (Bio-Rad, Inc., Hercules, CA) were included on each gel. Proteins were transferred at 30 V for 1 hour from the gel to a nitrocellulose membrane. The membranes were then washed three times with PBS-T (0.3% Tween-20) for 10 min and blocked with 5% milk/PBS-T at RT for 1 hour. Membranes were incubated with the specific primary antibody (anti-rabbit claudins-3 and -7, tricellulin, or occludin; anti-mouse claudins-1, -4 and -5 [Thermo Fisher Scientific]; anti-rabbit claudin-2 [Abcam, Cambridge, MA]), at 0.5 μg/mL in 5% milk/PBS overnight at 4 °C. (In each instance, a 1:1,000 dilution of each primary antibody was used to probe the immunoblot and obtain the final images shown [each with different exposure times]). The membranes were again washed three times, 10 min each, with PBS-T, and then incubated with the secondary antibody (rabbit anti-mouse- or goat anti-rabbit-IgG antibody labeled with horseradish peroxidase [Southern Biotech, Birmingham, AL]) for 1 hour at RT. The membranes were then again washed four times, 10 min each, with PBS-T, and treated for 10- to 60-seconds with Western Lightning Plus-ECL chemiluminescence reagents (PerkinElmer). The membranes’ protein band densities were quantified using the BioRad ChemiDoc Imaging System. The band densities of the experimentally treated cell samples were compared to averages of corresponding control cell samples.
Statistics
All data are expressed as the mean ± standard error of the mean with the number of replicates provided for each set of studies. Determination of statistical significance in these studies was performed by two-sided Student’s t tests. Significance was claimed when P < 0.05.
Results
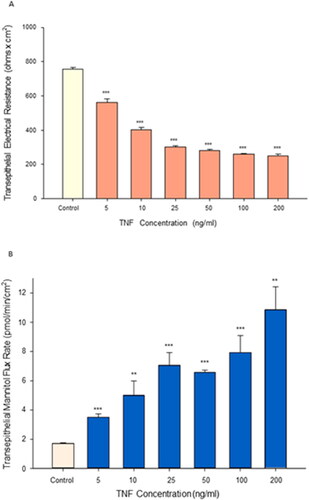
Tumor necrosis factor-α (TNF-α) exposure for 72 hr resulted in significant impairment of barrier function of the airway model, Calu-3. An over 70% reduction in transepithelial electrical resistance was observed () coinciding with approximately a 6-fold increase in permeability to mannitol (). This induced leakiness was additionally reflected in a change in confluent cell layer morphology. As shown in , “hemicysts” or “domes” can be observed across confluent Calu-3 cell layers. This is a characteristic indicative of a polar epithelial cell layer with an effective tight junctional barrier that correlates with overall cell layer barrier function. 24 hr exposure of TNF-α to the cell layer induced a collapse of these domes throughout the cell layer (). As shown in and , a dose dependency of the TNF-α effect on TER and Jm was observed.
Figure 1. The effect of tumor necrosis factor-α on Calu-3 transepithelial electrical resistance and transepithelial flux of 14C-D-mannitol. (A) 8-day post confluent Calu-3 cell layers on polycarbonate filters were refed in control medium or medium containing 150 ng/ml tumor necrosis factor-α (TNF-α) in the apical and basal-lateral compartments 72 hr prior to electrical measurements. Data shown represent resistance expressed as the mean ± SE of 6 cell layers per condition. (B) After electrical measurements, radiotracer flux studies with 14C-D-mannitol were performed, as described in Materials and Methods. Data shown represent transepithelial mannitol flux rate expressed as the mean ± SE of 12 cell layers per condition. ***P < 0.001 vs. control (Student’s t-test, two-tailed).
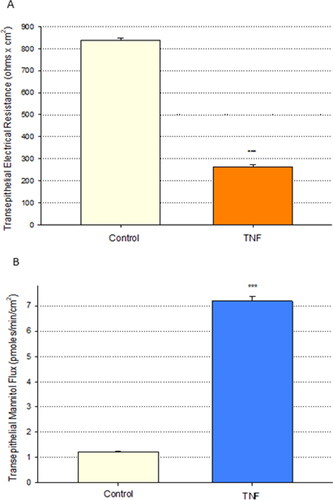
Figure 2. The effect of tumor necrosis factor-α on Calu-3 domes. Phase contrast image of (A) control cell layers and (B) collapse of domes in cell layers treated with 150 ng/ml TNF-α for 24 hr. Black arrows indicate domes. Calu-3 cell layers were seeded onto round 1.5 cm diameter glass coverslips and photographed at 100X magnification using a Nikon Diaphot inverted phase contrast microscope. Bar = 50 µm.
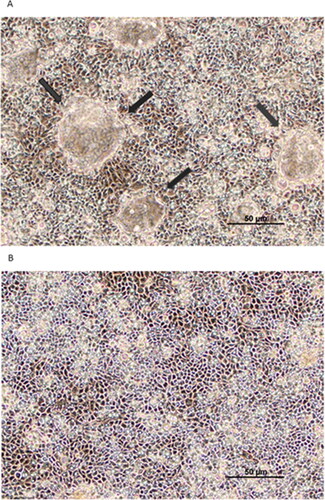
Figure 3. The effect of increasing concentrations of tumor necrosis factor-α on Calu-3 transepithelial electrical resistance and transepithelial flux of 14C-D-mannitol. (A) 8-day post-seeding Calu-3 cell layers on PCFs were refed in control or medium containing 1–200 ng/ml TNF-α in the apical and B/L compartments 72 hr prior to electrical measurements. Data shown represent resistance expressed as the mean ± SE of 6 cell layers per condition. (B) Radiotracer flux studies with 14C-D-mannitol were performed on these cell layers. Data shown represent transepithelial mannitol flux rate expressed as the mean ± SE of 6 cell layers for the 5 ng/ml, 25 ng/ml, 50 ng/ml, 100 ng/ml TNF-α conditions; 12 cell layers for the control condition; 5 cell layers for the 10 ng/ml TNF-α condition; 4 cell layers for the 200 ng/ml TNF-α condition. NS indicates non significance vs. control. **P < 0.01 vs. control. ***P < 0.001 vs. control (Student’s t-test, two-tailed).
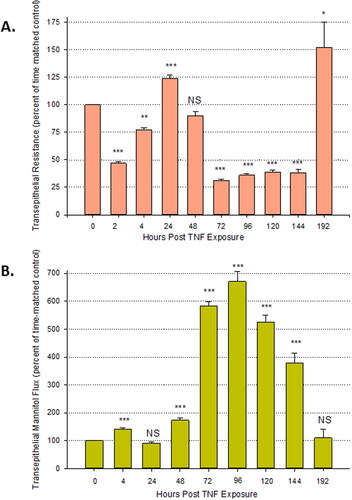
The time course of changes in TER and mannitol flux resulting from TNF-α exposure was seen to be multiphasic (). There is a significant reduction in TER as early as 2 hr post treatment and observed through 4 hr at which time there was a simultaneous increase in Jm. After 24 hr post exposure, there is a complete recovery of TER, as well as Jm. The second, larger increase in transepithelial leak started at 48 hr post-treatment, hitting a peak at 72–96 hr. This effect persisted until day six after initial TNF-α exposure to both the apical and basal-lateral sides. This occurred despite no additional application of TNF-α beyond that at 0 hr. Barrier function again completely recovered by day eight post exposure.
Figure 4. The time course of changes in transepithelial electrical resistance and transepithelial flux of 14C-D-mannitol resulting from TNF-α exposure. (A) 8-day post confluent Calu-3 cell layers on PCFs were refed in control medium or medium containing 150 ng/ml TNF-α and transepithelial electrical resistance was recorded at 2, 4, 24, 48, 72, 96, 120, 144, and 192 hr (different cell layers were used for each designated time point). After 72 hr exposure to TNF-α, all cell layers were maintained in control medium. Data shown represent the percentage of time-matched control resistance and are expressed as the mean ± SE of 6 cell layers per condition with the exception of the 192nd hr condition which contains an n of 5. (B) Radiotracer flux studies with 14C-D-mannitol were performed on these cell layers. Data shown represent the percentage of time-matched control mannitol flux rate and are expressed as the mean ± SE. NS indicates non significance; *P < 0.05; **P < 0.01; ***P < 0.001 vs. control (two tailed Student’s t test vs. time-matched control cell layers).
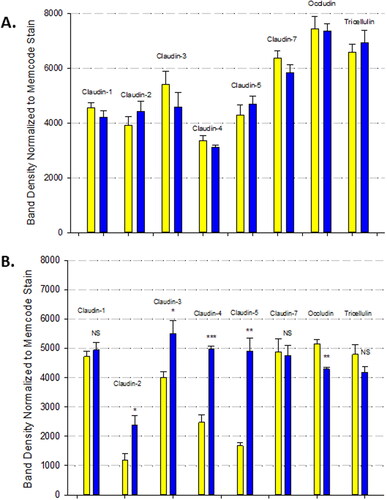
The Calu-3 barrier compromise as evidenced by both the decrease in TER and increase in Jm in response to 72 hr of TNF-α, correlated with changes in specific tight junctional proteins in detergent soluble fractions (). TNF-α induced increases in claudins-2, -3, -4, and -5 as well as a decrease in occludin. There was no effect observed on tricellulin or claudins-1 and -7. There was no effect observed in TJ protein abundance as a result of 3 hr of TNF-α ().
Figure 5. The effect of TNF-α on Calu-3 tight junctional proteins. Confluent cell layers were treated for 3 hours (A) and 72 hours (B) with TNF-α, harvested, lysed and Western immunoblots were performed for specifically detergent soluble fractions as described in Material and Methods. Data are represented as mean ± standard error for n = 6 cell layers for each 3 hr condition and an n = 3 cell layers for each 72 hr condition. Yellow bars indicate control, blue bars indicate TNF-α. NS indicates non significance vs. control. *P < 0.05 vs. control. **P < 0.01 vs. control. ***P < 0.001 vs. control (Student’s t-test, two-tailed).
We investigated the role that the ERK signaling pathway plays in both baseline Calu-3 barrier function, as well as the TNF-α induced barrier impairment. The involvement of this pathway was initially demonstrated morphologically. Calu-3 cell layers treated for 24 hr with U0126, an ERK inhibitor, exhibited an increase in both “dome” size and number (). Additionally, 2 hr of U0126 improved Calu-3 basal barrier function as shown by a two-fold increase in TER and a greater than 50 percent decrease in mannitol flux (). This effect is not observed with 72 hr of U0126 ().
Figure 6. The effect of U0126 on dome formation in Calu-3 cell layers. Phase contrast image of (A) control cell layers and (B) cell layers treated with 100 µM U0126 for 24 hr. Black arrows indicate domes.
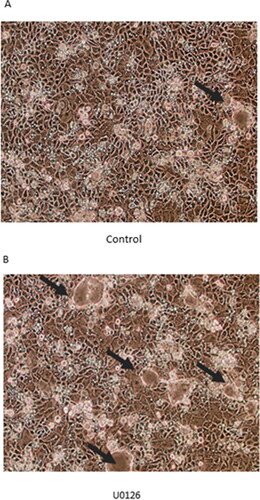
Figure 7. The effect of the ERK inhibitor, U0126, on Calu-3 barrier function and TNF-α induced barrier leak. (A + C) 8-day post-confluent Calu-3 cell layers on PCF filters were treated with 100 µM U0126 and exposed to TNF-α for 2 hr or 72 hr as described in the Materials and Methods. Data shown represent resistance expressed as the mean ± SE of 6 cell layers per condition. (B + D) After electrical measurements, radiotracer flux studies with 14C-D-mannitol were performed on the same Calu-3 cell layers used for resistance studies. Data shown represent transepithelial mannitol flux rate expressed as the mean ± SE of 6 cell layers per condition. **P < 0.01 vs. control. ***P < 0.001 vs. control. ##P < 0.01 vs. TNF-α. ###P < 0.001 vs. TNF-α (Student’s t-test, two-tailed).
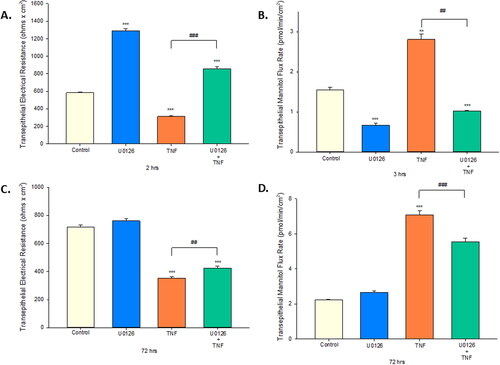
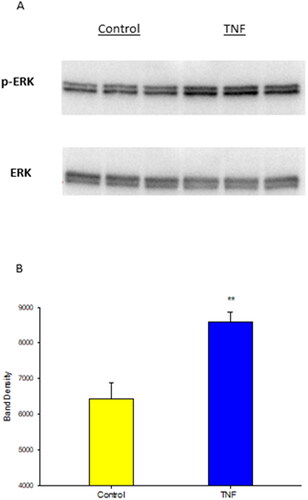
Prior reports have demonstrated the involvement of ERK signaling in inducing paracellular leak of Calu-3 cell layers.Citation32 As shown in , TNF-α exposure resulted in a significant increase in p-ERK levels without affecting total ERK levels. Using U0126 treatment along with TNF, we established involvement of the ERK signaling pathway in both the 3 hr and 72 hr TNF-α exposures. U0126 blunted TNF-α induced barrier leak in both significantly reducing the increased mannitol flux rate, as well as, attenuating the decline in resistance caused by TNF-α. The effect seen was greater in the 3 hr exposure, where improvement went beyond control levels ().
Figure 8. The effect of TNF-α on phosphorylated ERK 1,2 expression in Calu-3 cell layers. Confluent cell layers were treated with TNF-α for 30 minutes and then harvested as described in Materials and Methods. Western immunoblot images of p-ERK and MAPK-ERK are shown (A). Data shown represent optical densities of p-ERK expressed as the mean ± SE of 3 cell layers. **P < 0.01 vs. control (Student’s t-test, two-tailed).
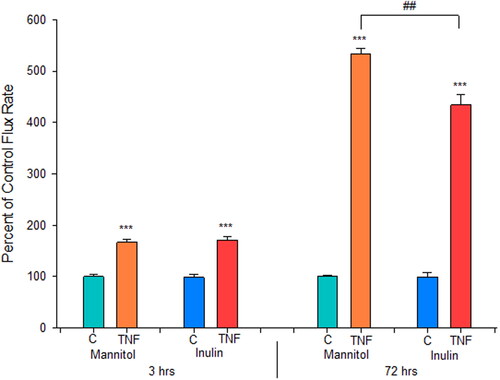
Further investigation into the effect of TNF-α on Calu-3 paracellular permeability showed that the leak produced allowed for an increase in transepithelial flux of the polysaccharide inulin, molecular weight 5 kDa (). TNF-α is inducing leak to inulin at both 3 hr and 72 hr. Inulin flux increased by 1.7-fold at 3 hr and 5-fold at 72 hr post TNF-α, compared to control.
Figure 9. The effect of TNF-α on transepithelial flux of 14C-D-mannitol and 14C-inulin across Calu-3 cell layers. 8-day post-confluent Calu-3 cell layers on PCF filters were refed in control medium or medium containing 150 ng/ml TNF-α for a 3 hr or 72 hr exposure. Radiotracer flux studies with 14C-D-mannitol and 14C-inulin were performed, as described in Materials and Methods. Data shown represent the percent of control flux rate and is expressed as the mean ± SE of 6 cell layers per condition with the exception of the 3 hr TNF inulin flux condition which contains an n of 5. ***P < 0.001 vs. respective control. ##P < 0.01 72 hr TNF Jmannitol vs. Jinulin (Student’s t-test, two-tailed).
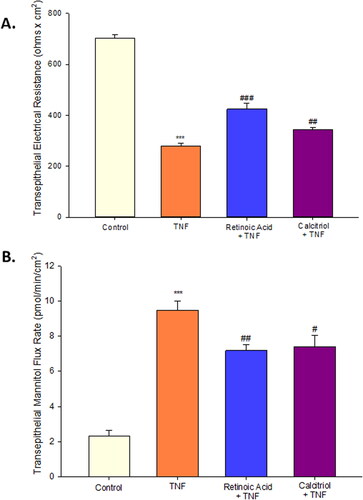
In this study, we evaluated retinoic acid as well as calcitriol as potential therapeutic agents. Both flavonoids were able to attenuate the barrier compromise caused by TNF-α in Calu-3 cell layers. In , we observed that simultaneous 72 hr treatment of TNF-α with either retinoic acid or calcitriol significantly reduced the resistance decrease caused by TNF-α. The effect seen with calcitriol was less robust than what we observed for retinoic acid. Additionally, both retinoic acid and calcitriol significantly reduced the permeability increase to mannitol caused by TNF-α ().
Figure 10. The effect of retinoic acid and calcitriol on TNF-α induced leak of Calu-3 cell layers. (A) 8-day-post-confluent Calu-3 cell layers on PCF filters were treated with 50 µM retinoic acid or 100 nM calcitriol and simultaneously exposed to 150 ng/ml TNF-α for 72 hr as described in Materials and Methods. Data shown represent resistance expressed as the mean ± SE of 6 cell layers per condition. (B) After electrical measurements, radiotracer flux studies with 14C-D-mannitol were performed on the same Calu-3 cell layers used for resistance studies. Data shown represent transepithelial mannitol flux rate expressed as the mean ± SE of cell layers per condition. ***P < 0.001 vs. control. #P < 0.05 vs. TNF-α. ##P < 0.01 vs. TNF-α. ###P < 0.001 vs. TNF-α (Student’s t-test, two-tailed).
Discussion
The ability of proinflammatory cytokines including TNF-α to induce transepithelial leakiness in Calu-3 epithelial cell layers has been well documented.Citation32,Citation33 The results shown in agree with these findings, showing leakiness in the form of both statistically significant reduction of TER by over 70% and simultaneous increase in Jm by almost 6-fold, at 72 hr post TNF-α exposure. As shown in this is a dose-dependent phenomenon that reaches a plateau at approximately 50 ng/ml TNF-α for the TER decrease, as would be expected for a well-described receptor-mediated phenomenon.Citation34 This effect of TNF-α on Calu-3 cell layers has been reported for a wide variety of other epithelial cell models derived from a diverse variety of tissues.Citation2,Citation4,Citation35
We show for the first time that the time course of TNF-α induced leak in Calu-3 cell layers is actually multiphasic, with not one but two statistically significant compromises in barrier function in the 72 hr time frame. An initial significant reduction of TER (and simultaneous increase in Jm) occurs at 2–4 hr after TNF-α exposure, followed by a complete recovery of barrier function at 24 hr post-exposure, in the continued presence of the cytokine. A second, more dramatic transepithelial leak can be then seen to begin by 48 hr, maximizing at 72 hr and persisting out to 144 hr before a second complete recovery of barrier function occurs by 192 hr (). This second barrier compromise is “programmed in” in the sense that it is occurring in the absence of additional exogenously administered TNF-α. In these experiments, TNF-α was applied to both apical and basal-lateral cell surfaces for 72 hr followed by refeeding in control culture media at 72 hr and then control medium refeeds every 2–3 days for 8 days post-exposure. A similar but only biphasic effect of TNF-α on TER has been reported in renal tubular epithelial cell layers, though with a different profile and time course.Citation4,Citation36
Induction of leak at 48–72 hr post-TNF-α exposure is quite common in a variety of epithelial models.Citation5,Citation37 However, leak induction after only 2–4 hr has not been widely reported. Transepithelial leak induction by TNF-α at such an early time point has been observed previously for the LLC-PK1 renal epithelial cell layer model, a leak which was also observed to reverse to complete recovery by 4–6 hr.Citation4 In the 16HBE human airway epithelial model, leak was observed at 5 hours, and persisted through 48 hours.Citation6 With Calu-3 cell layers, we have observed however a multiphasic induction of leak at 2–4 hr and again at 72 hr in over 7 independent experiments, with full recovery of barrier function in between.
Whereas reduction of TER signifies increased transepithelial diffusion of only (relatively small) Na+ and Cl- ions, and induced mannitol leak is only to a solute of 180 daltons, we observed that TNF-α is inducing leak in Calu-3 cell layers to at least 5 kDa solutes as shown by increased transepithelial diffusion of the polysaccharide, 14C-inulin. This occurs at the 2–4 hr leak and at the greater 72 hr leak (). This inulin leak is biomedically significant because it implies that both induced leaks would allow for larger molecules such as peptides and small proteins to cross the TNF-α exposed epithelial barrier at dramatically increased rates. At 3 hr post-TNF-α, mannitol and inulin leak both increased 1.70-fold. At 72 hr post-TNF-α, mannitol and inulin leak both increased 5-fold. This TNF-α induced paracellular leak to larger molecules is not limited to Calu-3 as it had been earlier seen for renal and intestinal epithelia.Citation38,Citation39
The radiotracer flux data is also informing us however that the control Calu-3 cell layer is itself quite leaky. Despite a robust typical TER of over 500 ohms × cm2, the control cell layers exhibited significant transepithelial leak to both D-mannitol and inulin (1 to 2 pmoles/min/cm2 for 0.1 mM mannitol and 0.003 to 0.005 pmoles/min/cm2 for 0.01 mM inulin). Given the lack of known affinity of these carbohydrates for cellular transport proteins, one is left to assume either a very active but nonspecific transcytotic pathway or a paracellular leak in control cell layers that admits of molecules at least as large as 5 kDa. The transcytotic pathway would have to be operative in a basal-lateral to apical direction (the direction of our flux measurements). Otherwise, one is left to assume that inulin leak is occurring at tricellular points on the cell layer (where tricellulin is concentrated)Citation40 or actual paracellular “holes” on the order of nano to micrometers exist in the control cell layers, as could occur with cell death and extrusion. The exact nature of this leak in control Calu-3 cell layers is the subject of ongoing investigation by our group.
The effect of TNF-α on the monolayer “blisterings” (when cells are cultured on solid subsurfaces) that are termed “domes” or “hemicysts” () is a morphological correlate to what TNF-α is doing to TER and the radiotracer fluxes. Domes were first described in depth in the MDCK renal epithelial cell culture model.Citation41 Their existence is due to the innate polarity of the confluent cell monolayer making it possible for vectorial transepithelial transport. In the case of Calu-3 that means transport of sodium and other sodium-coupled transport substrates from the apical fluid compartment (the culture medium) to the space between the confluent cell layer and the plastic or glass surface on which the cell layer is situated. With tight junctional seals preventing back diffusion to the culture medium, and water moving osmotically into the space between cell layer and culture dish, the cell layer literally blisters-up in discrete locations as “domes.” Domes rise until shearing stress ruptures cell-cell connections, then the cell layer settles, realigns and domes begin forming at nearby sites with the whole cell layer looking like boiling oatmeal in time lapse, low magnification cinematography.Citation42,Citation43 In addition to TNF-α induced dome collapse simply confirming the TNF-α induced barrier compromise on a morphological level, the TNF-α action on domes () is also suggesting that TNF-α is producing a homogeneous effect across the entire cell layer.
The role of the ERK signaling pathway in the regulation of Calu-3 barrier function and the TNF-α induced compromise of that barrier function can be seen first in the effect of the ERK inhibitor, U0126, on dome frequency and size. As shown in , U0126 treatment causes a substantial increase in dome size and number suggesting that ERK signaling may lead to paracellular leak and that inhibition of ERK signaling leads to Calu-3 barrier/junctional tightening. Indeed, the induction of paracellular transepithelial leak in Calu-3 cell layers by ERK signaling has already been substantiated.Citation32,Citation44,Citation45 Our results expand on those earlier findings by showing the involvement of ERK signaling in both the 3 hr and the 72 hr (post-TNF-α exposure) transepithelial leak, by the U0126 reduction of TNF-α effects on both TER and 14C-D-mannitol diffusion (). Although, at 3 hr, it is possible that the effect of U0126 alone on TER is responsible for the significant increase in resistance of the U0126 + TNF condition. The substantial increase in TER caused by U0126 on control cell layers is potentially the reason that the apparent TER decrease is less in the U0126 + TNF condition versus the TNF condition (). This is not the case at 72 hr given U0126 does not cause significant effects on TER on its own at this time point; however, there is still a positive effect in the U0126 + TNF condition versus the TNF condition. Furthermore, direct evidence for TNF-α activation of the ERK signaling pathway in Calu-3 cell layers is shown by the TNF-α induced increase in p-ERK levels ().
The induction of Calu-3 TJ remodeling as the reason for barrier compromise by TNF-α was suggested by the uniform TNF-α induced dome collapse across the cell layer, but it is substantiated by the observed changes of TJ barrier proteins in response to TNF-α. 72 hr after TNF-α exposure, we observed no change in tricellulin or claudins-1 or -7 in detergent soluble fractions (). However, TNF-α induced statistically significant increases in claudins-2, -3, -4, and -5, as well as a decrease in occludin in the Calu-3 cell layers. Although perhaps counterintuitive in terms of it inducing leak, TNF-α induced increases in “sealing” claudins have been reported.Citation46,Citation47 Additionally, increased claudin-5, a typical “sealing” claudin, has been associated with increased permeability of human airway, IB3.1 cells.Citation48 At the earlier decrease in TER, after 3 hr of TNF-α exposure, there are no dramatic changes in individual TJ protein expression levels. It is likely that changes in the TJ complex that could be responsible for this change in TER and mannitol leak are due to changes in phosphorylation and/or translocation state of barrier proteins or tight junction-associated proteins such as ZO-1, as has been seen in other epithelial cell typesCitation13,Citation49,Citation50 as well as Calu-3 itself.Citation32 This will be a major focus going forward, to better understand the two distinct compromises of barrier function caused here by TNF-α.
The well-described role of proinflammatory cytokines in COVID-19 morbidity, as well as the frequent accumulation of lung water in those contracting the diseaseCitation29 raised the question for us of what agents might have therapeutic potential in blocking the TNF-α induced barrier compromise that we observe in Calu-3. Vitamin A (retinoic acid) has had frequent reports of strengthening epithelial barrier function and reducing cytokine induced barrier compromise in various epithelial models.Citation6,Citation51–54 However, there are reports of Vitamin A induced compromise of barrier function as well.Citation55,Citation56 Vitamin A here showed dramatic ability to reduce the barrier-compromising effects of TNF-α (). Vitamin D had similar though less potent effects on Calu-3 barrier function. This agrees with a broad-based epithelial barrier literature showing basal barrier improvement with Vitamin D as well as a reduction of disease-related barrier compromise.Citation57–59 This occurs even with a well described highly specific, Vitamin D induced increased TJ permeability to Ca++ ions (despite the tightening of the junctional seals)—evidence of the finely tuned regulation of this Vitamin D effect by not interfering with paracellular Ca++ transport—it’s main route of absorption.Citation60
Should these safe and inexpensive micronutrients act similarly on airway linings in vivo, their potential therapeutic value in diseases such as COVID-19 becomes obvious. Indeed, the severity of COVID-19 in Vitamin-D-deficient populations has already been established.Citation61,Citation62 Low Vitamin D levels have been associated with an increased risk of COVID infection and hospitalization.Citation63–65 Patients with Vitamin D deficiency were 5-fold more likely to be infected with COVID-19, after adjusting for age.Citation61 Additionally, a pilot study of COVID-19 inpatients demonstrated that calcifediol supplementation reduced the need for ICU treatment, indicating a potential role in decreasing disease severity.Citation66 In an analysis of 25 randomized controlled trials, Martineau et al.Citation67 showed that supplementation with Vitamin D, particularly in Vitamin D-deficient patients, protected against development of acute respiratory tract infections. A prospective study found an inverse association between the use of Vitamin D supplements and the risk of COVID-19 infection, reporting a 34% lower risk.Citation68 The SHADE study reported that a greater proportion of mildly symptomatic SARS-CoV-2 individuals became COVID negative and had a decrease in the inflammatory marker, fibrinogen, after cholecalciferol intervention.Citation69 Nimer et al.Citation70 reported improved clinical outcomes with Vitamin D supplementation prior to COVID infection.
Vitamin A deficiency has also associated with poorer clinical outcomes in COVID.Citation71–73 Moreover, the disease itself associates with reduction of systemic Vitamin A levels.Citation74 The issue of micronutrient supplementation as a potential prophylactic and therapeutic approach in COVID has been advanced.Citation75–77 That supplementation may be particularly important in the elderly.Citation78 In terms of mechanism, Morita et al.Citation79 have reported that Vitamin A has reduced SARS-CoV-2 replication in Calu-3 cells, while also inhibiting the 3 C-like protease of the virus. Vitamin A effects on other SARS-CoV-2 proteases (transmembrane serine protease 2 [TMPRSS2], and cysteine protease cathepsins B, L [CTSB/L]) had been noted earlier.Citation80 Dey et al.Citation81 reported that Vitamin A binds to the Envelope Protein of SARS-CoV-2 and can inhibit its ionophoretic activity in cell membranes. A caveat to supplemental use of Vitamin A in COVID is the report of COVID induced liver damage resulting in dramatic release of Vitamin A into the circulation to potentially toxic levels.Citation82
In summary, our work presented here provides novel information on the ERK-mediated, TNF-α induced transepithelial leak across the widely used Calu-3 human airway model. We highlight the unusual multiphasic nature of the induced leak, the leak allowing even large solutes increased permeation, and the involvement of the TJ complex in the phenomenon. We then show that the micronutrients, Vitamin A (retinoic acid) and Vitamin D (calcitriol), can protect the cell layer from a portion of the barrier compromise induced by an inflammatory mediator such as TNF-α, a finding with possible prophylactic and therapeutic potential.
Additional information
Funding
References
- Rodriguez P, Heyman M, Candalh C, Blaton MA, Bouchaud C. Tumour necrosis factor-alpha induces morphological and functional alterations of intestinal HT29 cl.19A cell monolayers. Cytokine. 1995;7(5):441–448. doi:10.1006/cyto.1995.0060.
- Marano CW, Lewis SA, Garulacan LA, Soler AP, Mullin JM. Tumor necrosis factor-alpha increases sodium and chloride conductance across the tight junction of CACO-2 BBE, a human intestinal epithelial cell line. J Membr Biol. 1998;161(3):263–274. doi:10.1007/s002329900333.
- Ma TY, Boivin MA, Ye D, Pedram A, Said HM. Mechanism of TNF-{alpha} modulation of Caco-2 intestinal epithelial tight junction barrier: role of myosin light-chain kinase protein expression. Am J Physiol Gastrointest Liver Physiol. 2005;288(3):G422–30. doi:10.1152/ajpgi.00412.2004.
- Mullin JM, Snock KV. Effect of tumor necrosis factor on epithelial tight junctions and transepithelial permeability. Cancer Res. 1990;50(7):2172–2176.
- Hardyman MA, Wilkinson E, Martin E, et al. TNF-α-mediated bronchial barrier disruption and regulation by src-family kinase activation. J Allergy Clin Immunol. 2013;132(3):665–675.e8. doi:10.1016/j.jaci.2013.03.005.
- Callaghan PJ, Rybakovsky E, Ferrick B, Thomas S, Mullin JM. Retinoic acid improves baseline barrier function and attenuates TNF-α induced barrier leak in human bronchial epithelial cell culture model, 16HBE 14o. PLoS One. 2020;15(12):e0242536. doi:10.1371/journal.pone.0242536.
- Zeni P, Doepker E, Schulze-Topphoff U, Huewel S, Tenenbaum T, Galla HJ. MMPs contribute to TNF-alpha induced alteration of the blood-cerebrospinal fluid barrier in vitro. Am J Physiol Cell Physiol. 2007;293(3):C855–64. Erratum in: Am J Physiol Cell Physiol. 2007 Nov; 293(5):C1731. Schulze Topphoff, Ulf [corrected to Schulze-Topphoff, Ulf]. doi:10.1152/ajpcell.00470.2006.
- Lagha AB, Grenier D. Tea polyphenols protect gingival keratinocytes against TNF-α induced tight junction barrier dysfunction and attenuate the inflammatory response of monocytes/macrophages. Cytokine. 2019;115:64–75. doi:10.1016/j.cyto.2018.12.009.
- Rybakovsky E, Buleza NB, Hoxha K, et al. Spontaneous and cytokine induced hole formation in epithelial cell layers: implications for barrier function studies with the gingival cell culture, Gie-3B11, and other epithelial models. Trends Cell Mol Biol. 2018;13:99–114.
- Ueda T, Ueda T, Fukuda S, et al. Lipid hydroperoxide induced tumor necrosis factor (TNF)-α, vascular endothelial growth factor and neovascularization in the rabbit cornea: effect of TNF inhibition. Angiogenesis. 1998;1(2):174–184. doi:10.1023/A:1018377621102.
- Aveleira CA, Lin CM, Abcouwer SF, Ambrósio AF, Antonetti DA. TNF-α signals through PKCζ/NF-κB to alter the tight junction complex and increase retinal endothelial cell permeability. Diabetes. 2010;59(11):2872–2882. doi:10.2337/db09-1606.
- DiGuilio KM, Rybakovsky E, Abdavies R, et al. Micronutrient improvement of epithelial barrier function in various disease states: a case for adjuvant therapy. IJMS. 2022;23(6):2995. doi:10.3390/ijms23062995.
- Shen L. Tight junctions on the move: molecular mechanisms for epithelial barrier regulation. Ann N Y Acad Sci. 2012;1258:9–18. doi:10.1111/j.1749-6632.2012.06613.x.
- Kaminsky LW, Al-Sadi R, Ma TY. IL-1β and the intestinal epithelial tight junction barrier. Front Immunol. 2021;12:767456. doi:10.3389/fimmu.2021.767456.
- He WQ, Wang J, Sheng JY, Zha JM, Graham WV, Turner JR. Contributions of myosin light chain kinase to regulation of epithelial paracellular permeability and mucosal homeostasis. IJMS. 2020;21(3):993. doi:10.3390/ijms21030993.
- Sengupta A, Roldan N, Kiener M, et al. A new immortalized human alveolar epithelial cell model to study lung injury and toxicity on a breathing lung-on-chip system. Front Toxicol. 2022;4:840606. doi:10.3389/ftox.2022.840606.
- Shepley-McTaggart A, Sagum CA, Oliva I, et al. SARS-CoV-2 envelope (E) protein interacts with PDZ-domain-2 of host tight junction protein ZO1. PLoS One. 2021;16(6):e0251955. doi:10.1371/journal.pone.0251955.
- Pasman T, Baptista D, van Riet S, et al. Development of an in vitro airway epithelial-endothelial cell culture model on a flexible porous poly (trimethylene carbonate) membrane based on calu-3 airway epithelial cells and lung microvascular endothelial cells. Membranes (Basel). 2021;11(3):197. doi:10.3390/membranes11030197.
- Hao S, Ning K, Kuz CA, Vorhies K, Yan Z, Qiu J. Long-term modeling of SARS-CoV-2 infection of in vitro cultured polarized human airway epithelium. mBio. 2020;11(6):e02852-20. doi:10.1128/mBio.02852-20.
- Shirvaliloo M. The blood-gas barrier in COVID-19: an overview of the effects of SARS-CoV-2 infection on the alveolar epithelial and endothelial cells of the lung. Tissue Barriers. 2021;9(4):1937013. doi:10.1080/21688370.2021.1937013.
- Wine JJ, Finkbeiner WE, Haws C, et al. CFTR and other Cl- channels in human airway cells. Jpn J Physiol. 1994;44(Suppl 2):S199–S205.
- Shen BQ, Finkbeiner WE, Wine JJ, Mrsny RJ, Widdicombe JH. Calu-3: a human airway epithelial cell line that shows cAMP-dependent Cl-secretion. Am J Physiol. 1994;266(5 Pt 1):L493–501. doi:10.1152/ajplung.1994.266.5.L493.
- Haws C, Finkbeiner WE, Widdicombe JH, Wine JJ. CFTR in Calu-3 human airway cells: channel properties and role in cAMP-activated Cl- conductance. Am J Physiol. 1994;266(5 Pt 1):L502–12. doi:10.1152/ajplung.1994.266.5.L502.
- Togami K, Yamaguchi K, Chono S, Tada H, Evaluation of permeability alteration and epithelial-mesenchymal transition induced by transforming growth factor-β1 in A549, NCI-H441, and Calu-3 cells: development of an in vitro model of respiratory epithelial cells in idiopathic pulmonary fibrosis. J Pharmacol Toxicol Methods. 2017;86:19–27. doi:10.1016/j.vascn.2017.02.023.
- Tatsuta M, Kan-O K, Ishii Y, et al. Effects of cigarette smoke on barrier function and tight junction proteins in the bronchial epithelium: protective role of cathelicidin LL-37. Respir Res. 2019;20(1):251. doi:10.1186/s12931-019-1226-4.
- Gaspar R, de Matos MR, Cortes L, et al. Pollen proteases play multiple roles in allergic disorders. IJMS. 2020;21(10):3578. doi:10.3390/ijms21103578.
- Kryvenko V, Vadász I. Molecular mechanisms of Na, K-ATPase dysregulation driving alveolar epithelial barrier failure in severe COVID-19. Am J Physiol Lung Cell Mol Physiol. 2021;320(6):L1186–L1193. doi:10.1152/ajplung.00056.2021.
- Wynne BM, Zou L, Linck V, Hoover RS, Ma HP, Eaton DC. Regulation of lung epithelial sodium channels by cytokines and chemokines. Front Immunol. 2017;8:766. doi:10.3389/fimmu.2017.00766.
- Shi R, Lai C, Teboul JL, et al. COVID-19 ARDS is characterized by higher extravascular lung water than non-COVID-19 ARDS: the PiCCOVID study. Crit Care. 2021;25(1):186. doi:10.1186/s13054-021-03594-6.
- Mehta P, McAuley DF, Brown M, et al. COVID-19: consider cytokine storm syndromes and immunosuppression. Lancet. 2020;395(10229):1033–1034. doi:10.1016/S0140-6736(20)30628-0.
- Eisenhut M, Shin JI. Pathways in the pathophysiology of coronavirus 19 lung disease accessible to prevention and treatment. Front Physiol. 2020;11:872. doi:10.3389/fphys.2020.00872.
- Petecchia L, Sabatini F, Usai C, Caci E, Varesio L, Rossi GA. Cytokines induce tight junction disassembly in airway cells via an EGFR-dependent MAPK/ERK1/2-pathway. Lab Invest. 2012;92(8):1140–1148. doi:10.1038/labinvest.2012.67.
- Han X, Fink MP, Uchiyama T, Yang R, Delude RL. Increased iNOS activity is essential for pulmonary epithelial tight junction dysfunction in endotoxemic mice. Am J Physiol Lung Cell Mol Physiol. 2004;286(2):L259–67. doi:10.1152/ajplung.00187.2003.
- Schmitz H, Fromm M, Bentzel CJ, et al. Tumor necrosis factor-alpha (TNFalpha) regulates the epithelial barrier in the human intestinal cell line HT-29/B6. J Cell Sci. 1999;112(1):137–146. doi:10.1242/jcs.112.1.137.
- Zech JC, Pouvreau I, Cotinet A, Goureau O, Le Varlet B, de Kozak Y. Effect of cytokines and nitric oxide on tight junctions in cultured rat retinal pigment epithelium. Invest Ophthalmol Vis Sci. 1998;39(9):1600–1608.
- Amoozadeh Y, Dan Q, Xiao J, Waheed F, Szászi K. Tumor necrosis factor-α induces a biphasic change in claudin-2 expression in tubular epithelial cells: role in barrier functions. Am J Physiol Cell Physiol. 2015;309(1):C38–50. doi:10.1152/ajpcell.00388.2014.
- Ma TY, Iwamoto GK, Hoa NT, et al. TNF-alpha induced increase in intestinal epithelial tight junction permeability requires NF-kappa B activation. Am J Physiol Gastrointest Liver Physiol. 2004;286(3):G367–76. doi:10.1152/ajpgi.00173.2003.
- Mullin JM, Marano CW, Laughlin KV, Nuciglio M, Stevenson BR, Soler P. Different size limitations for increased transepithelial paracellular solute flux across phorbol ester and tumor necrosis factor-treated epithelial cell sheets. J Cell Physiol. 1997;171(2):226–233. doi:10.1002/(SICI)1097-4652(199705)171:2<226:AID-JCP14>3.0.CO;2-B.
- Chen S, Zhu J, Chen G, et al. 1,25-Dihydroxyvitamin D3 preserves intestinal epithelial barrier function from TNF-α induced injury via suppression of NF-kB p65 mediated MLCK-P-MLC signaling pathway. Biochem Biophys Res Commun. 2015;460(3):873–878. doi:10.1016/j.bbrc.2015.03.125.
- Krug SM, Amasheh S, Richter JF, et al. Tricellulin forms a barrier to macromolecules in tricellular tight junctions without affecting ion permeability. Mol Biol Cell. 2009;20(16):3713–3724. doi:10.1091/mbc.e09-01-0080.
- Valentich JD, Tchao R, Leighton J. Hemicyst formation stimulated by cyclic AMP in dog kidney cell line MDCK. J Cell Physiol. 1979;100(2):291–304. doi:10.1002/jcp.1041000210.
- Rabito CA, Tchao R, Valentich J, Leighton J. Distribution and characteristics of the occluding junctions in a monolayer of a cell line (MDCK) derived from canine kidney. J Membr Biol. 1978;43(4):351–365. doi:10.1007/BF01871696.
- Rabito CA, Tchao R, Valentich J, Leighton J. Effect of cell-substratum interaction on hemicyst formation by MDCK cells. In Vitro. 1980;16(6):461–468. doi:10.1007/BF02626458.
- Ewaschuk JB, Diaz H, Meddings L, et al. Secreted bioactive factors from Bifidobacterium infantis enhance epithelial cell barrier function. Am J Physiol Gastrointest Liver Physiol. 2008;295(5):G1025–34. doi:10.1152/ajpgi.90227.2008.
- Ramos CJ, Lin C, Liu X, Antonetti DA. The EPAC-Rap1 pathway prevents and reverses cytokine induced retinal vascular permeability. J Biol Chem. 2018;293(2):717–730. doi:10.1074/jbc.M117.815381.
- Anwer S, Branchard E, Dan Q, Dan A, Szászi K. Tumor necrosis factor-α induces claudin-3 upregulation in kidney tubular epithelial cells through NF-κB and CREB1. Am J Physiol Cell Physiol. 2021;320(4):C495–C508. doi:10.1152/ajpcell.00185.2020.
- Kondo J, Sato F, Kusumi T, et al. Claudin-1 expression is induced by tumor necrosis factor-α in human pancreatic cancer cells. Int J Mol Med. 2008;22(5):645–649.
- Coyne CB, Gambling TM, Boucher RC, Carson JL, Johnson LG. Role of claudin interactions in airway tight junctional permeability. Am J Physiol Lung Cell Mol Physiol. 2003;285(5):L1166–L1178. doi:10.1152/ajplung.00182.2003. 12909588
- Tenenbaum T, Matalon D, Adam R, et al. Dexamethasone prevents alteration of tight junction-associated proteins and barrier function in porcine choroid plexus epithelial cells after infection with Streptococcus suis in vitro. Brain Res. 2008;1229:1–17. doi:10.1016/j.brainres.2008.06.118.
- Lee JY, Kim CY. Preventive effects of thinned apple extracts on TNF-α induced intestinal tight junction dysfunction in Caco-2 cells through myosin light chain kinase suppression. Foods. 2022;11(12):1714. doi:10.3390/foods11121714.
- Rybakovsky E, Valenzano MC, Deis R, DiGuilio KM, Thomas S, Mullin JM. Improvement of human-oral-epithelial-barrier function and of tight junctions by micronutrients. J Agric Food Chem. 2017;65(50):10950–10958. doi:10.1021/acs.jafc.7b04203.
- Groeger S, Jarzina F, Windhorst A, Meyle J. Influence of retinoic acid on human gingival epithelial barriers. J Periodontal Res. 2016;51(6):748–757. doi:10.1111/jre.12351.
- Rong J, Liu S. Effect of all-trans retinoic acid on the barrier function in human retinal pigment epithelial cells. Biochem Biophys Res Commun. 2011;407(3):605–609. doi:10.1016/j.bbrc.2011.03.080.
- Elias PM, Friend DS. Vitamin-A induced mucous metaplasia. An in vitro system for modulating tight and gap junction differentiation. J Cell Biol. 1976;68(2):173–188. doi:10.1083/jcb.68.2.173.
- Baltes S, Nau H, Lampen A. All-trans retinoic acid enhances differentiation and influences permeability of intestinal Caco-2 cells under serum-free conditions. Dev Growth Differ. 2004;46(6):503–514. doi:10.1111/j.1440-169x.2004.00765.x.
- Gorodeski GI, Eckert RL, Pal D, Utian WH, Rorke EA. Retinoids regulate tight junctional resistance of cultured human cervical cells. Am J Physiol. 1997;273(5):C1707–13. doi:10.1152/ajpcell.1997.273.5.C1707.
- Kong J, Zhang Z, Musch MW, et al. Novel role of the vitamin D receptor in maintaining the integrity of the intestinal mucosal barrier. Am J Physiol Gastrointest Liver Physiol. 2008;294(1):G208–16. doi:10.1152/ajpgi.00398.2007.
- Zhao H, Zhang H, Wu H, et al. Protective role of 1,25(OH)2 vitamin D3 in the mucosal injury and epithelial barrier disruption in DSS induced acute colitis in mice. BMC Gastroenterol. 2012;12(1):57. doi:10.1186/1471-230X-12-57.
- Lobo de Sá FD, Backert S, Nattramilarasu PK, et al. Vitamin D reverses disruption of gut epithelial barrier function caused by Campylobacter jejuni. IJMS. 2021;22(16):8872. doi:10.3390/ijms22168872.
- Chirayath MV, Gajdzik L, Hulla W, Graf J, Cross HS, Peterlik M. Vitamin D increases tight-junction conductance and paracellular Ca2+ transport in Caco-2 cell cultures. Am J Physiol. 1998;74(2):G389–96. doi:10.1152/ajpgi.1998.274.2.G389.
- Katz J, Yue S, Xue W. Increased risk for COVID-19 in patients with vitamin D deficiency. Nutrition. 2021;84:111106. doi:10.1016/j.nut.2020.111106.
- Infante M, Buoso A, Pieri M, et al. Low Vitamin D Status at Admission as a Risk Factor for Poor Survival in Hospitalized Patients With COVID-19: An Italian Retrospective Study. J Am Nutr Assoc. 2022;41(3):250–265. doi:10.1080/07315724.2021.1877580.
- Liu N, Sun J, Wang X, Zhang T, Zhao M, Li H. Low vitamin D status is associated with coronavirus disease 2019 outcomes: a systematic review and meta-analysis. Int J Infect Dis. 2021;104:58–64. doi:10.1016/j.ijid.2020.12.077.
- Munshi R, Hussein MH, Toraih EA, et al. Vitamin D insufficiency as a potential culprit in critical COVID-19 patients. J Med Virol. 2021;93(2):733–740. doi:10.1002/jmv.26360.
- Merzon E, Tworowski D, Gorohovski A, et al. Low plasma 25(OH) vitamin D level is associated with increased risk of COVID-19 infection: an Israeli population-based study. Febs J. 2020;287(17):3693–3702. doi:10.1111/febs.15495.
- Entrenas Castillo M, Entrenas Costa LM, Vaquero Barrios JM, et al. Effect of calcifediol treatment and best available therapy versus best available therapy on intensive care unit admission and mortality among patients hospitalized for COVID-19: a pilot randomized clinical study. J Steroid Biochem Mol Biol. 2020;203:105751. doi:10.1016/j.jsbmb.2020.105751.
- Martineau AR, Jolliffe DA, Hooper RL, et al. Vitamin D supplementation to prevent acute respiratory tract infections: systematic review and meta-analysis of individual participant data. BMJ. 2017;356:i6583. doi:10.1136/bmj.i6583.
- Ma H, Zhou T, Heianza Y, Qi L. Habitual use of vitamin D supplements and risk of coronavirus disease 2019 (COVID-19) infection: a prospective study in UK Biobank. Am J Clin Nutr. 2021;113(5):1275–1281. doi:10.1093/ajcn/nqaa381.
- Rastogi A, Bhansali A, Khare N, et al. Short term high-dose vitamin D supplementation for COVID-19 disease: a randomized, placebo-controlled, study (SHADE study). Postgrad Med J. 2022;98(1156):87–90. doi:10.1136/postgradmedj-2020-139065.
- Nimer R, Khabour O, Swedan S, Kofahi H. The impact of vitamin and mineral supplements usage prior to COVID-19 infection on disease severity and hospitalization. Bosn J Basic Med Sci. 2022;16;22(5):826–832. doi:10.17305/bjbms.2021.7009.
- Renata RN, Arely GA, Gabriela LA, Esther MM. Immunomodulatory role of microelements in COVID-19 outcome: a relationship with nutritional status. Biol Trace Elem Res. 2022;6:1–19. doi:10.1007/s12011-022-03290-8.
- Voelkle M, Gregoriano C, Neyer P, et al. Prevalence of micronutrient deficiencies in patients hospitalized with COVID-19: an observational cohort study. Nutrients. 2022;14(9):1862. doi:10.3390/nu14091862.
- Tepasse PR, Vollenberg R, Fobker M, et al. Vitamin A plasma levels in COVID-19 patients: a prospective multicenter study and hypothesis. Nutrients. 2021;13(7):2173. doi:10.3390/nu13072173.
- Sarohan AR, Akelma H, Araç E, Aslan Ö, Cen O. Retinol depletion in COVID-19. Clin Nutr Open Sci. 2022;43:85–94. doi:10.1016/j.nutos.2022.05.007.
- Diyya ASM, Thomas NV. Multiple micronutrient supplementation: as a supportive therapy in the treatment of COVID-19. Biomed Res Int. 2022;2022:3323825. doi:10.1155/2022/3323825.
- Midha IK, Kumar N, Kumar A, Madan T. Mega doses of retinol: a possible immunomodulation in Covid-19 illness in resource-limited settings. Rev Med Virol. 2021;31(5):1–14. doi:10.1002/rmv.2204.
- Trasino SE. A role for retinoids in the treatment of COVID-19? Clin Exp Pharmacol Physiol. 2020;47(10):1765–1767. doi:10.1111/1440-1681.13354.
- Fiorino S, Gallo C, Zippi M, et al. Cytokine storm in aged people with CoV-2: possible role of vitamins as therapy or preventive strategy. Aging Clin Exp Res. 2020;32(10):2115–2131. doi:10.1007/s40520-020-01669-y.
- Morita T, Miyakawa K, Jeremiah SS, et al. All-trans retinoic acid exhibits antiviral effect against SARS-CoV-2 by Inhibiting 3CLpro activity. Viruses. 2021;13(8):1669. doi:10.3390/v13081669.
- Prasad K, AlOmar SY, Almuqri EA, Rudayni HA, Kumar V. Genomics-guided identification of potential modulators of SARS-CoV-2 entry proteases, TMPRSS2 and Cathepsins B/L. PLoS One. 2021;16(8):e0256141. doi:10.1371/journal.pone.0256141.
- Dey D, Borkotoky S, Banerjee M. In silico identification of Tretinoin as a SARS-CoV-2 envelope (E) protein ion channel inhibitor. Comput Biol Med. 2020;127:104063. doi:10.1016/j.compbiomed.2020.104063.
- Mawson AR, Croft AM, Gonzalez-Fernandez F. Liver damage and exposure to toxic concentrations of endogenous retinoids in the pathogenesis of COVID-19 disease: hypothesis. Viral Immunol. 2021;34(6):376–379. doi:10.1089/vim.2020.0330.