
Abstract
Major crop nutrient symptoms are well documented. In contrast, there is often minimal or no similar information for minor crops, including quinoa (Chenopodium quinoa Willd.). This knowledge gap can be efficiently filled by using hydroponic systems. However, creating multiple nutrient deficiencies with plants in the same study is challenging because nutrients are often added as dual nutrient salts. For example, if potassium sulfate is the potassium (K) source, varying K concentration also impacts sulfur (S) concentration, possibly creating dual deficiencies or other interactions. A new hydroponic system was created to impose nutrient deficiencies using single nutrient sources: ammonium nitrate; phosphoric, sulfuric, hydrochloric, and boric acids; potassium, calcium, magnesium, zinc, and copper carbonates; manganese acetate; sodium molybdate; iron EDDHA, with HEDTA as an additional chelate. Fourteen treatments were established including a positive control with nutrient concentrations anticipated to be optimal compared with individual deficiencies of nitrogen (N), phosphorous (P), K, S, calcium (Ca), magnesium (Mg), zinc (Zn), iron (Fe), manganese (Mn), copper (Cu), boron (B), molybdenum (Mo), and chloride (Cl). The “deficient” treatments were created by reducing concentrations by 80% for N and 90% for the others. The solution proved to be mostly effective as quinoa plants were grown to maturity. Stem size, plant height, and shoot and root biomass were impacted, especially for treatments with reduced N, P, and K. Unfortunately, the predicted adequate levels of some nutrients were likely excessive, especially B and Mn. Additional fine tuning is required to create a solution optimal in all nutrients.
Introduction
Earth’s population is approaching eight billion and growing. For many, hunger is an oppressive problem that often leads to tragedy. As the earth’s population grows, so does the demand on resources to feed the human family (Hopkins Citation2015; LeMonte et al. Citation2016). Efforts to counteract these problems result in steady increases in yields of the major crops (Hopkins and Hansen Citation2019). However, these yield increases result in greater demand for plant nutrients and can deplete these nutrients from soils, increasing the frequency of crop nutrient deficiencies (Hopkins and Hansen Citation2019).
As a result, crop production requires careful nutrient management. It is important to identify and correct crop nutrient deficiencies when they occur. For many high value and/or commonly grown crops found in agriculturally wealthy regions, such as potato (Solanum tuberosum L.; Pitchay and Mikkelsen Citation2018) and broccoli (Brassica oleracea L.; Pitchay and Mikkelsen Citation2017), there is generally an abundance of reference material to visually and chemically recognize nutrient deficiencies (Bennett Citation1993; Bryson et al. Citation2014). However, this reference material is often lacking for minor crops, especially those grown in areas with minimal agricultural resources. For example, Quinoa (Chenopodium quinoa Willd.) has minimal information available for visual deficiency symptoms and tissue nutrient concentrations.
Quinoa could potentially help combat hunger throughout the world. Quinoa provides several health benefits, including being high in fiber and having high quality protein—providing all essential amino acids (Repo-Carrasco, Espinoza, and Jacobsen Citation2003). Due in part to these benefits, quinoa is growing quickly in popularity around the world. In 1980, only eight countries had farmers growing quinoa. As of 2014, farmers in 75 countries were growing quinoa and 20 more in 2015. With this growth, Bolivia and Peru remain the primary quinoa producers, providing more than 80% of the quinoa in the world (Bazile, Jacobsen, and Verniau Citation2016). Quinoa exports have markedly increased, from 600 tonnes in 1992 to 37,000 tonnes in 2012—an average annual growth of 23% (Furche et al. Citation2015).
Quinoa farming would benefit from additional information about nutrient deficiency symptoms, but methods for obtaining these symptoms can be difficult to manage. Ideally, studies are done to create all of the mineral nutrient deficiencies with comparisons and contrasts of visual symptoms, as in the work of Pitchay and Mikkelsen (Citation2017, Citation2018). Hydroponic (Trejo-Téllez and Gómez-Merino Citation2012) and related systems are the simplest and most rapid method to provide information for a wide variety of the mineral nutrients. Although growing plants in soil can create some deficiencies, it is not generally possibly to create all of the mineral nutrient deficiencies in one comparative trial because soils contain a bank of nutrients with virtually no soil being deficient in every nutrient. It is especially difficult to force micronutrient and secondary macronutrient deficiencies. In contrast, hydroponic systems potentially enable the induction of every mineral nutrient deficiency simultaneously in a controlled environment (Pitchay and Mikkelsen Citation2017, Citation2018). These can generally be translated to plants grown in soil, such as with Summerhays et al. (Citation2015) growing P deficient plants in soil with similar results with plants growing in hydroponics (Summerhays et al. Citation2017).
Commonly used hydroponic solutions, such as Hoagland and Arnon (Citation1950) and Steinberg (Citation1953), are readily modified to study chemistry impacts, such as pH, (Bensen et al. Citation2009a) and to create individual nutrient deficiencies, such as N (Geary et al. Citation2015), P (Summerhays et al. Citation2017), K (Hughes, Jolley, and Brown Citation1992), Ca (Bensen et al. Citation2009b), Fe (Brown et al. Citation1990; Buxton et al. Citation2012; Hopkins, Jolley, and Brown Citation1992a, Citation1992b, Citation1992c), Zn (Hopkins et al. Citation1998), and Mo (Steinberg Citation1953). Nutrient interaction studies have also been accomplished, such as P and Zn (Barben et al. Citation2010a, Citation2010c; Nichols et al. Citation2012), P and Mn (Barben et al. Citation2010b), and P, Zn, and Mn (Barben et al. Citation2011).
Creating a range of nutrient deficiencies in these studies and others is accomplished by having a range of concentrations of the nutrient(s) being studied. For example, Steinberg (Citation1953) had varying concentrations of Mo using sodium molybdate as the source. In addition to Mo, the concentration of Na was also impacted because it was the accompanying cation for the molybdate anion. However, this is not deemed a concern because Na is not an essential mineral nutrient and it was present at relatively high concentrations as it was also added as an accompanying cation for the S. Similarly, Geary et al. (Citation2015) were able to use hydroponics without worry of an interaction because they used ammonium nitrate to vary N concentrations, with both the cation and the anion containing N and, thus, no other mineral nutrients were impacted.
However, there are difficulties when attempting to create deficiencies that may result in unintended, possible interacting factors in other situations where the accompanying ion (typically ammonium, calcium, chloride, nitrate, and/or sulfate) are simultaneously impacted as the nutrient being studied has its concentration varied. These difficulties are caused because the traditional hydroponic solutions are made with chemical compounds that are combinations of cationic and anionic nutrient salts. Often, these effects are attempted to be overcome by ensuring that the associated ion is found in a large abundance so that it is not deficient, but this can have interactive effects on other nutrients. And, this approach is not possible if a deficiency of that nutrient is being induced in the same study. Another option is adding a secondary source of the associated ion, but this also can result in unintended consequences. For example, Barben et al. (Citation2010a, Citation2010c) created multiple concentrations of P and Zn deficiencies using potassium phosphate and zinc sulfate sources. As a result, in addition to the differences with P and Zn, there were also differences with K and S. This was addressed by supplying an abundance of K and S to avoid them being deficient. Nevertheless, the concentrations of each varied across treatments. This causes concern for possible nutrient and other physiological interactions. These differences do not likely make the findings of these studies to be voided, but questions do arise.
Pitchay (Citation2002), Gibson (Citation2003), and Pitchay and Mikkelsen (Citation2017, Citation2018) created a wide variety of nutrient deficiencies using Hoagland solution. This solution uses several cationic and anionic paired nutrients. For example, the Mg source in the Hoagland solution is magnesium sulfate. Adjusting Mg levels would also adjust S levels. It appears that Pitchay (Citation2002), in creating nutrient deficiencies, may have substituted any nutrient initially as an anion (e.g., sulfate) with chloride and any nutrient as cation (e.g., Mg) with Na. Magnesium chloride would then be added when S levels were reduced, and sodium sulfate would be added when Mg levels were reduced. However, Cl and Na could both create some interacting factors.
Additionally, Gibson (Citation2003) sought to study the effects of N and K on plant growth and rooting of stem cuttings for Scaevola (Scaevola aemula R. Br.), New Guinea impatiens (Impatiens hawkeri W. Bull), and vegetative strawflower [Bracteantha bracteate (Vent.) Anderb & Haegi; formerly Xeranthemum bracteatum Vent.] In adjusting the N and K levels, S levels were also impacted because of the use of potassium sulfate and magnesium nitrate with magnesium sulfate. The S levels varied throughout the study from 2.9-215 mg L−1. This variation could allow for a S interaction.
In addition, it is apparent that individual species (and likely varieties) have unique optimum concentrations of nutrients. For example, Nichols et al. (Citation2012) found differing optimum levels of P and Zn for maize (Zea mays L.) than Barben et al. (Citation2010a, Citation2010c) did for potato. Furthermore, once the optimum level of a nutrient is found, it possibly impacts the optimum levels of other nutrients—requiring iterative experiments until all interacting nutrients are optimized (Barben et al. Citation2010a, Citation2010b, Citation2010c; Citation2011; Nichols et al. Citation2012). Ideally, each plant species/varieties grown hydroponically for commercial or research needs would be studied to identify its optimum hydroponic nutrient concentrations, which is not practical with existing published nutrient solutions.
Therefore, a new hydroponic solution is needed so that individual mineral nutrient concentrations can be adjusted without greatly impacting other nutrients. This will allow for optimal, custom recipes for each species/varieties that can be developed and/or that deficiencies of each nutrient can be induced for study. Such a solution was developed and preliminary studies conducted showing this solution to be effective for growing plants and creating N deficiency quinoa and soybean [Glycine max (L.) Merr]. The accompanying ion for each nutrient in this solution is:: 1) the same nutrient [with ammonium nitrate (NH4NO3) for N], 2) a proton for P, S, B, and Cl, 3) a carbonate anion for K, Ca, Mg, Zn, and Cu, 4) an acetate anion for Mn, 5) a chelate for Fe, and 6) a Na ion for Mo. HEDTA was also used as a chelate. Some initial findings are reported by Cole et al. (Citation2018, Citation2019a, Citation2019b). The objectives of this study were to use this hydroponic system to: 1) determine if quinoa could be grown to maturity with healthy plants and 2) create deficiencies of N, P, K, S, Ca, Mg, Zn, Fe, Mn, Cu, B, Cl, and Mo separately as compared to a positive control with estimated optimal concentrations of each nutrient with measures of visual symptoms and nutrient concentrations in the plant tissues.
Materials and methods
Quinoa accession PI 614886 (also known as NSL 106399 or QQ74), hereafter referred to as quinoa, was grown in an environmentally controlled growth chamber November, 2018 to February, 2019 at Brigham Young University in Provo, UT, USA at 1387 m elevation (40.245 − 111.650). Lighting was supplied by an equal combination of metal halide and high pressure Na lamps. Plants were grown in a 12/12 h light/dark photoperiod. Temperatures were 25 ± 1 °C during the light photoperiod and for two h after and 15 °C ± 1 °C for the remainder of the dark photoperiod.
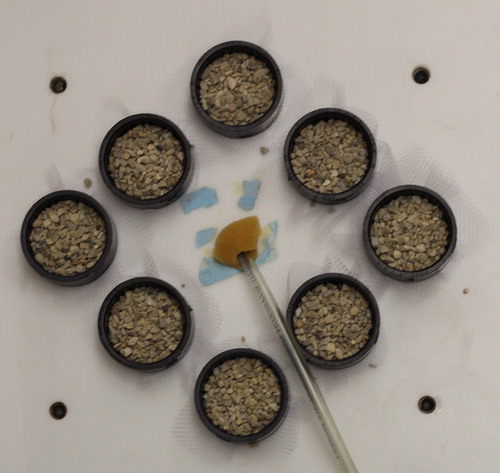
Each experimental unit consisted of quinoa growing in a 14 l container (29 cm inside diameter, 27 cm height) filled with a hydroponic solution. The containers were placed into opaque wooden boxes and covered with opaque plastic lids 0.9 cm thick. Each lid had eight (5.0 cm diameter) holes completely covered to exclude light from the roots and nutrient solution with fittings (4.8 cm inside diameter, 2.3 cm height above the plastic lid, 1.8 cm threaded side that extended below the lid) secured on the underside of the lid with the threaded rings (). Two layers of white nylon matte mesh (2 × 4 mm) netting material were stretched tightly and placed over the threaded side of the fitting and secured in place with a threaded ring (). Washed gravel (2.0-4.8 mm) was placed on the taut netting inside the fittings to a depth of 3.0 cm ().
Figure 1. Fitting with screw on cap used to hold mesh and gravel with seeds suspended over hydroponic solution.
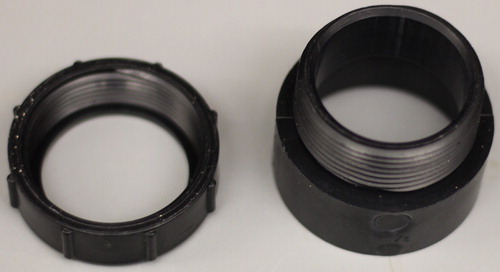
Figure 2. Mesh netting placed between the fitting and screw on cap. Seeds are placed in gravel suspended on the taut mesh.
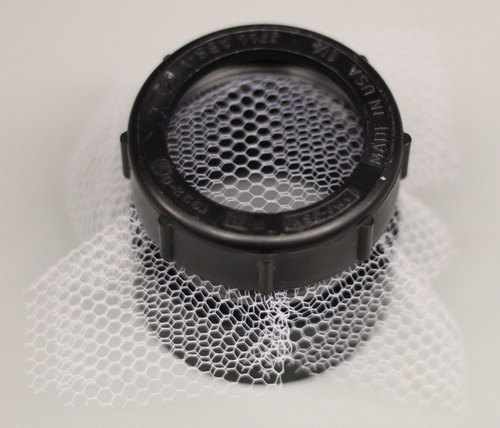
Figure 3. Opaque plastic covering with attached fittings with mesh to suspend gravel and seed over hydroponic solution. Tubing in center used to deliver oxygen into the hydroponic solution below.
Approximately 5-10 quinoa seeds were germinated in each fitting by placing them on gravel ∼1 cm below the top of the fitting and covering with ∼0.5 cm of gravel. The seeds were watered daily from the top of the fitting using deionized water until their roots were of sufficient size to reach down into the nutrient solution in the container below.
Oxygen was supplied to the solution through PVC tubing passed through a small hole in the center of the lid. Where the tubing passed through the lid, foam was wrapped to prevent light from passing through to the solution (). Cylindrical bubbler air stones (12 mm diameter with 25 mm length; fish tank pump bubble air stones, Uxcell, Hong Kong, China) were attached to the end of the tubing to diffuse the size of air bubbles. Air flow rate was enough to have visible bubbles but avoiding bubbling the solution out of the container.
Fourteen treatments were established just prior to planting in a randomized complete block design (RCBD) with three replicated blocks. A positive control () contained what was estimated to be optimal concentrations of all nutrients based initially on Barben et al. (Citation2010a, Citation2010b, Citation2010c, Citation2011) and Nichols et al. (Citation2012) with modifications based on preliminary observational studies. Each of the other 13 treatments had the same concentration of all nutrients as the positive control, with the exception of a reduced concentration of: N, P, K, S, Ca, Mg, Zn, Mn, Fe, Cu, B, Mo, or Cl. The reduced treatments included 10% of the concentration found in the positive control. At 17 d after planting, the N deficient treatment received an additional 10% of the N concentration listed in because of extreme deficiency. After ∼50 d of growth, each container received an addition of 50% of the nutrients with which it began to replenish nutrients.
Table 1. Hydroponic nutrient concentrations (µM) for the positive control.
The nutrient solution was composed of the following: sulfuric, phosphoric, hydrochloric, and boric acids; potassium, calcium, magnesium, zinc, and copper carbonates; manganese acetate; sodium molybdate; iron 6% chelate (EDDHA); and HEDTA chelate. Each nutrient was added to deionized water (container ∼80% full) and stirred in the order of N, K, Ca, Mg, Zn, Mn, Cu, B, Mo, P, S, Cl, and Fe and then brought to volume. Additionally, 0.35 ml of algaecide (AlgeGone, TopFin, Phoenix, AZ, USA; active ingredient: Poly[oxyethylene(dimethyliminio)ethylene(dimethyliminio)ethylene dichloride] 4.5%) was added to each container.
Plants were approximately equalized across all containers and were thinned down to one plant per fitting between 22 and 36 d after planting. The number of plants in each container were reduced to three fittings each on 22 to 25 d. The biomass samples harvested during this thinning process were dried at 65 °C for ∼7d with replicates consolidated across treatments because of a lack of material (plants were very small) in any one experimental unit. The dried plant material was then ground to pass a 60 mesh screen and analyzed for nutrient content by the Brigham Young University—Environmental Analytical Laboratory (BYU—EAL; https://pws.byu.edu/eal). Total N was determined by combustion (Vario EL Cube, Elementar, Langenselbold, Germany). All other mineral nutrients were measured through nitric acid-hydrogen peroxide microwave digestion (EPA method 3052 using an Ethos EZ microwave, Milestone, Shelton, CT, USA) followed by ICP-OES analysis (iCAP 7400, Thermo Electron, Madison, WI, USA).
At 56 d after planting, one plant from each replicate was harvested. The remaining plants were grown until 66-72 d when growth chamber failures occurred. This final harvest had similar visual observations, height, stem width, and biomass measurements as the 56 d data, but these are not included in the analysis below due to the possible compromise as a result of the equipment failure. Each plant height and base stem width were measured. Plant shoots were harvested by cutting at the base above the gravel. Plant roots were harvested by cutting at the bottom of the fitting and rinsed in deionized water. The biomass samples were dried to consistent mass at 65 °C for ∼7d. The dried material was then analyzed in the same method as the 22 d material. The Mo and Cl concentrations were not measured because of errors during analysis.
Statistical analysis was performed by Analysis of Variance (ANOVA) with differences between means determined in R (Anonymous Citation2017, Citation2019) by the Benjamini and Hochberg pairwise comparison method. A P value of 0.05 was used to evaluate the statistical analysis.
Results and discussion
The objective of successfully growing quinoa to maturity using this nutrient solution was achieved. However, the measured parameters show that the theorized “optimum” nutrient concentrations were not optimum for every nutrient, which will require adjustment in future experiments, as discussed below.
Nutrient concentrations in the shoots appeared to be deficient for the various treatments compared to the positive control when the plants were thinned at 22 d (). For the 56 d harvest, the overall models were significant for every measured parameter except Ca, Fe, and Na concentrations. There were significant differences in plant height, stem width, and shoot and root biomass (), as well as nutrient concentrations (). In general, these differences show the objectives of inducing nutrient deficiencies was achieved for some, but not all, of the nutrients.
Table 2. Quinoa shoot nutrient concentrations at 22 d after planting for a hydroponic study.
Table 3. Quinoa plant measures at 56 d after planting for a hydroponic study.
Table 4. Quinoa plant macronutrient concentrations (%) at 56 d after planting for a hydroponic study.
Table 5. Quinoa plant micronutrient concentrations at 56 d after planting for a hydroponic study.
Inducing deficiencies of the primary macronutrients was successfully achieved. The positive control was always numerically greater (although not always statistically significant) than the reduced N, P, and K treatments for height, stem width, shoot biomass, and root biomass with increases ranging from 46 to 533% (). Additionally, the primary macronutrient concentrations in the positive control were approximately double at 22 d () and 116, 68, and 107% higher than in the deficient treatments for N, P, and K, respectively, at 56 d; although only N and P were significant (). Although we don’t have certain data to know at what concentrations these nutrients are deficient in quinoa, these values are below the typical ranges reported for most major crops (Bryson et al. Citation2014). Sugar beet (Beta vulgaris L.) is the crop most closely related to quinoa for which we have reliable nutrient concentration data. The N, P, and K concentrations for the deficient treatments with quinoa are far below those that are typical for sugar beet (). Similar is true for other common grain crops (). Visually, in addition to severe stunting, typical visual symptoms were apparent (). The N deficient plants had leaves, especially older leaves, which had overall chlorosis. Interestingly, another phenotypic trait was observed with N deficiency resulting in less serration on the leaf margins (), which was similar to what was observed in a preliminary study (). Furthermore roots were curled and thin (). The K deficient plants were similar, with appearance of chlorosis and then necrosis beginning first on leaf margins and working inward, especially on older leaves. Although P deficiency is often observed with darkening of leaves, or even development of purple and red hues, this was not readily observed in this study as the P deficient plants were so severely stunted with rapid development of leaf necrosis ().
Figure 4. Comparison of a healthy quinoa leaf from the positive control (left) with an N deficient leaf with chlorosis and less serration on the margins (right).
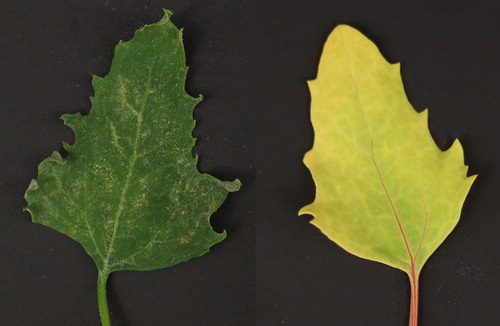
Figure 5. Comparison of a healthy quinoa leaves and florescence from the positive control (left) and reduced N treatment leaves and florescence (right) with chlorosis and less serration on the margins.
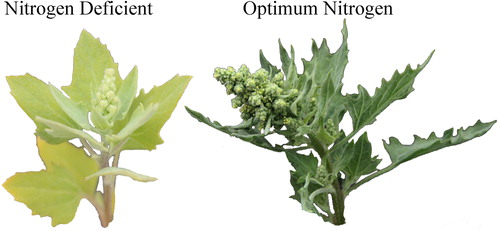
Figure 6. Comparison of positive control roots (left) and reduced N treatment roots (right).
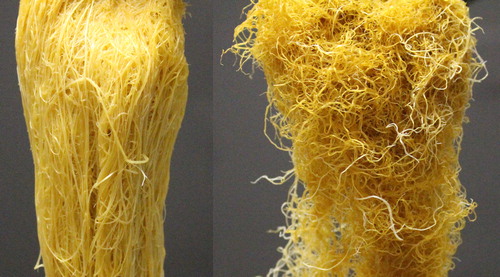
Table 6. Typical macronutrient concentrations (%) for various species (Bryson et al. Citation2014).
The reduced S treatment had lower S concentration in the shoots, which was statistically significant (). This concentration is at or below the lower concentration typical in most crop species (Bryson et al. Citation2014), including lower than sugar beet, wheat (Triticum spp.), and maize (). However, the height, stem width, and shoot and root biomass were all numerically higher for the positive control than the reduced, although none of these statistically significant (). These data suggest that a S deficiency was possibly achieved, but it is not certain.
There is also evidence that a Zn deficiency was induced. The Zn concentration in the biomass of the positive control was over six-fold greater than the reduced Zn treatment and was statistically significant (). Although the scientific literature is largely devoid of tissue Zn concentrations for quinoa, the concentration of 6 mg kg−1 is very low in light of what is known for other species. For example, other grain crops, such as maize and wheat, and sugar beet have the low end of what is typically measured at 20, 15, and 10 mg kg−1, respectively (Bryson et al. Citation2014). Further evidence is that the reduced Zn treatment had numerically lower plant height, stem width, and shoot and root biomass than the positive control, although these were not statistically significant ().
Similar trends are evident for Fe as with Zn for plant growth parameters, although the magnitude of the difference between the reduced Fe treatment and the positive control are not as large (). Also similar was that the positive control had higher Fe concentration than the reduced Fe treatment (). The Fe concentration in the reduced Fe quinoa was just lower than the lower limit for sugar beet, although higher than other grain crops (). Nevertheless, there is evidence for the induction of an Fe deficiency. It is also noteworthy that, visually, many of the treatments had interveinal chlorosis, including the positive control. Thus, it is possible that the entire study would have benefited from greater Fe concentration in the nutrient solutions.
Table 7. Typical micronutrient concentrations (mg kg−1) for various species (Bryson et al. Citation2014).
There was also some evidence that a Ca deficiency was induced. The Ca concentration in the biomass of the positive control was over three-fold greater than the reduced Ca treatment, although this was not statistically different (). The concentration of Ca in the tissue of reduced Ca treatment was not particularly low compared to other species (). The reduced Ca treatment had numerically lower plant height, stem width, and root biomass than the positive control, but these were also not significant (). Although these trends in the data would suggest that a Ca deficiency was achieved, it is not certain. It is noteworthy that there also seemed to be a trend for relatively higher Mn and lower B concentrations in the biomass of the Ca deficient treatment ().
Similar to Ca, there is some evidence of Cu deficiency. The Cu concentration in the biomass of the positive control was over twice as high as the reduced Cu treatment, although this was not statistically different (). This concentration was lower than what is typical for sugar beet and other grain crops (). The reduced Cu treatment had numerically lower stem width and root biomass than the positive control but was slightly taller and had slightly more shoot biomass, although none of these were statistically significant ().
The reduced Mg treatment did not have strong evidence that it was deficient (). The concentration of 0.18% is at a level that would be considered low for close relative sugar beet, it is higher than what is typical for other grain crops () and many other species (Bryson et al. Citation2014). And, plant growth was numerically greater for the reduced Mg treatment (not significant) than the positive control. These data suggest that the positive control may have had slightly excessive Mg.
The evidence for excessive levels in the positive control is even greater for Mn. Again, the reduced Mn treatment had nutrient concentrations of Mn lower than the positive control (). This level is near or below the concentrations that would be low for most crop plants (Bryson et al. Citation2014), such as those shown in , but the positive control was over five-fold higher. All measured plant parameters were higher than the positive control with shoot and root biomass being significant (). In fact, the reduced Mn treatment had the highest numerical value for root growth than all other treatments, which was significant for all but Mg and B. This strongly suggests that the Mn levels in the nutrient solution for the positive control was excessive and needs to be reduced in future studies.
It is also likely that a B deficiency was not achieved, with toxicity also a possibility. Shoot and root biomass and stem width were numerically higher for the plants grown in lower B solution than the positive control, although these were not significant (). The concentration of B in the positive control, as well as all of the other treatments besides the Ca, was two to five times higher than the reduced B treatment (). All of these were significantly greater except Ca. These high values are possibly in the range of toxicity, although this is not certain (Bryson et al. Citation2014).
The Mo and Cl concentrations were not measured and, thus, these treatments were not able to be fully evaluated. However, plant height, stem width, and shoot and root biomass values were not statistically significant for either (). Height and stem width were numerically smaller while shoot and root biomass were numerically greater than the control for Mo, suggesting that a Mo deficiency was not achieved. A Cl deficiency was also likely not achieved, as the Cl treatment had similar measurements for shoot biomass and numerically higher values for height, stem width, and root biomass; suggesting a possible excess.
In addition to these differences, it is noteworthy that there were large precipitates at the bottom each solution. It is suspected that these were from carbonates used in the study. Also, pH levels varied from 7.1 to 8.3 initially. At 55 days, they ranged from 6.7-8.2, except for the Ca treatment, which got as low as 3.7 and 3.8 in two separate replicates (no pH adjustments were made to the solutions as they were allowed to fluctuate). As Ca was added as a carbonate, and the Ca nutrient concentration was higher than any other chemical added as a carbonate, this shows that carbonate is causing a buffer at a higher pH. Future studies should include pH control and possible buffer options.
Summary
The results of this trial are a mixed success. The main objective of the study was achieved by growing reasonably healthy quinoa plants to maturity in this hydroponic nutrient solution with each nutrient coming from chemicals with no other nutrient. Additionally, deficiencies of N, P, and K were achieved and probably S, Zn, Fe, Ca, and Cu as well. Although plants were grown successfully and some nutrient deficiencies were achieved, it is doubtful that Mg, Mn, and B deficiencies were induced, and/or it is possible that toxicities were induced in some cases, especially with B and Mn. Additional studies are needed to refine this solution by lowering concentrations of Mg, Mn, B, and Cl. It is also noteworthy that phenotypic expression was different in some instances, suggesting genetic triggers with nutrient deficiencies. Visual symptoms for N, P, and K shown in this study are a valuable resource for farmers, as well as the concentrations of nutrients being a preliminary database for quinoa, which can be a tool in creating important reference material for farmers to aid them in producing higher yields with high quality quinoa grain.
Declaration of interest
The authors acknowledge that there was no conflict of interest in performing this study or analyzing its results.
Additional information
Funding
References
- Anonymous. 2017. R Core Team, 2017. R: A language and environment for statistical computing. Vienna, Austria: R Foundation for Statistical Computing. https://www.R-project.org/.
- Anonymous. 2019. R Documentation, n.d. Adjust P-values for Multiple Comparisons. http://stat.ethz.ch/R-manual/R-devel/library/stats/html/p.adjust.html
- Barben, S. A., B. G. Hopkins, V. D. Jolley, B. L. Webb, and B. A. Nichols. 2010a. Optimizing phosphorus and zinc concentrations in hydroponic chelator-buffered nutrient solution for Russet Burbank potato. Journal of Plant Nutrition 33 (4):557–70. doi: 10.1080/01904160903506282.
- Barben, S. A., B. G. Hopkins, V. D. Jolley, B. L. Webb, and B. A. Nichols. 2010b. Phosphorus and manganese interactions and their relationships with zinc in chelator-buffered solution grown Russet Burbank potato. Journal of Plant Nutrition 33 (5):752–69. doi: 10.1080/01904160903575964.
- Barben, S. A., B. G. Hopkins, V. D. Jolley, B. L. Webb, and B. A. Nichols. 2010c. Phosphorus and zinc interactions in chelator-buffered solution grown Russet Burbank potato. Journal of Plant Nutrition 33 (4):587–601. doi: 10.1080/01904160903506308.
- Barben, S. A., B. G. Hopkins, V. D. Jolley, B. L. Webb, B. A. Nichols, and E. A. Buxton. 2011. Zinc, manganese and phosphorus interrelationships and their effects on iron and copper in chelator-buffered solution grown Russet Burbank potato. Journal of Plant Nutrition 34 (8):1144–63. doi: 10.1080/01904167.2011.558158.
- Bazile, D., S.-E. Jacobsen, and A. Verniau. 2016. The global expansion of quinoa: Trends and limits. Frontiers in Plant Science 7:622. doi: 10.3389/fpls.2016.00622.
- Bennett, W. F., ed. 1993. Nutrient deficiencies and toxicities in crop plants. St. Paul, MN: APS Press.
- Bensen, J. H., B. D. Geary, J. S. Miller, B. G. Hopkins, V. D. Jolley, and M. R. Stevens. 2009a. Phytophthora erythroseptica (pink rot) development in Russet Norkotah potato grown in buffered hydroponic solutions II. pH effects. American Journal of Potato Research 86:472–5. doi: 10.1007/s12230-009-9102-2.
- Bensen, J. H., B. D. Geary, J. S. Miller, V. D. Jolley, B. G. Hopkins, and M. R. Stevens. 2009b. Phytophthora erythroseptica (pink rot) development in Russet Norkotah potato grown in buffered hydroponic solutions I. Calcium nutrition effects. American Journal of Potato Research 86:466–71. doi: 10.1007/s12230-009-9101-3.
- Brown, J. C., R. E. Terry, V. D. Jolley, and B. G. Hopkins. 1990. Reduction of iron (Fe3+ to Fe2+) by tumorous crown gall cells of sunflower. Journal of Plant Nutrition 13 (12):1513–21. doi: 10.1080/01904169009364172.
- Bryson, G. M., H. A. Mills, D. N. Sasseville, J. B. Jones, A. V. Barker. G. M. Bryson. and H. A. Mills, eds. 2014. Plant analysis handbook IV. Athens, GA: MicroMacro Publishing.
- Buxton, E. A., B. G. Hopkins, V. D. Jolley, B. L. Webb, and R. C. Christensen. 2012. Iron efficiency in Kentucky bluegrass not related to phytosiderophore release. Journal of Plant Nutrition 35 (2):311–29. doi: 10.1080/01904167.2012.636133.
- Cole, D. L., A. Tyler, A. Lambert, S. V. Nelson, T. Billin, and B. G. Hopkins. 2018. A new hydroponic system for testing mineral nutrient deficiencies in plants. In Abstracts, ASA•CSSA International Annual Meeting; 4–7 Nov 2018; Baltimore, MD. Madison, WI: ASA•CSSA.
- Cole, D. L., R. K. Woolley, R. L. Buck, and B. G. Hopkins. 2019a. New hydroponic system for testing mineral nutrient deficiencies and its application to quinoa. In Proceedings of the Western Nutrient Management Conference (WNMC); 7–8 Mar. 2019; Reno, NV. Peachtree Corners, GA: International Plant Nutrition Institute (IPNI).
- Cole, D. L., S. H. Stapley, R. L. Buck, and B. G. Hopkins. 2019b. New hydroponic system for testing mineral nutrient deficiencies and its application to quinoa. In Abstracts, ASA-CSSA-SSSA. International Annual Meeting; 10–13 Nov 2019; San Antonio, TX. Madison, WI: ASA-CSA-SSSA.
- Furche, C., S. Salcedo, E. Krivonos, P. Rabczuk, B. Jara, D. Fernández, and F. Correa. 2015. International quinoa trade. In State of the art report on quinoa around the world in 2013, Chapter 4.1, 316–9. Rome, Italy: FAO and CIRAD.
- Geary, B., J. Clark, B. G. Hopkins, and V. D. Jolley. 2015. Deficient, adequate and excess nitrogen levels established in hydroponics for biotic and abiotic stress-interaction studies in potato. Journal of Plant Nutrition 38 (1):41–50. doi: 10.1080/01904167.2014.912323.
- Gibson, J. L. 2003. Influence of mineral nutrition on stock plant yield and subsequent rooting of stem cuttings of scaevola, New Guinea impatiens, and vegetative strawflower. Dissertation., North Carolina State University. https://repository.lib.ncsu.edu/bitstream/handle/1840.16/3741/etd.pdf?sequence=1&isAllowed=y.
- Hoagland, D. R., and D. I. Arnon. 1950. The water-culture method for growing plants without soil. California Agricultural Experiment Station Circular 347 (2).
- Hopkins, B. G. 2015. Phosphorus in plant nutrition. In Plant nutrition handbook. 2nd ed., Chapter 3, eds. D. J. Pilbeam and A. V. Barker, 65–126. Boca Raton, FL: CRC Press, Taylor & Francis Group.
- Hopkins, B. G., and N. C. Hansen. 2019. Phosphorus management in high-yield systems. Journal of Environmental Quality 48 (5):1265–80. doi: 10.2134/jeq2019.03.0130.
- Hopkins, B. G., D. A. Whitney, R. E. Lamond, and V. D. Jolley. 1998. Phytosiderophore release by sorghum, wheat, and corn under zinc deficiency. Journal of Plant Nutrition 21 (12):2623–37. doi: 10.1080/01904169809365593.
- Hopkins, B. G., V. D. Jolley, and J. C. Brown. 1992a. Differential response of Fe-inefficient muskmelon, tomato, and soybean to phytosiderophore released by coker 227 oat. Journal of Plant Nutrition 15 (1):35–48. doi: 10.1080/01904169209364300.
- Hopkins, B. G., V. D. Jolley, and J. C. Brown. 1992b. Plant utilization of iron solubilized by oat phytosiderophore. Journal of Plant Nutrition 15 (10):1599–612. doi: 10.1080/01904169209364425.
- Hopkins, B. G., V. D. Jolley, and J. C. Brown. 1992c. Variable inhibition of iron uptake by oat phytosiderophore in five soybean cultivars. Journal of Plant Nutrition 15 (1):125–35. doi: 10.1080/01904169209364305.
- Hughes, D. F., V. D. Jolley, and J. C. Brown. 1992. Roles for potassium in the iron‐stress response mechanisms of strategy I and strategy II plants. Journal of Plant Nutrition 15 (10):1821–39. doi: 10.1080/01904169209364442.
- LeMonte, J. J., V. D. Jolley, J. S. Summerhays, R. E. Terry, and B. G. Hopkins. 2016. Polymer coated urea in turfgrass maintains vigor and mitigates nitrogen’s environmental impacts. Plos One 11 (1):e0146761. doi: 10.1371/journal.pone.0146761.
- Nichols, B. A., B. G. Hopkins, V. D. Jolley, B. L. Webb, B. G. Greenwood, and J. R. Buck. 2012. Phosphorus and zinc interactions and their relationships with other nutrients in maize grown in chelator-buffered nutrient solution. Journal of Plant Nutrition 35 (1):123–41. doi: 10.1080/01904167.2012.631672.
- Pitchay, D. S. 2002. Impact of 11 elemental nutrient deficiencies on shoot and root growth, and foliar analysis standards of 13 ornamental taxa with emphasis on Ca and B control of root apical meristem development. Dissertation., North Carolina State University. Raleigh, NC. https://repository.lib.ncsu.edu/bitstream/handle/1840.16/5258/etd.pdf?sequence=2&isAllowed=y.
- Pitchay, D. S., and R. L. Mikkelsen. 2017. Plant nutrition diagnostics: Broccoli. Peachtree Corners, GA: International Plant Nutrition Institute (IPNI).
- Pitchay, D., and R. Mikkelsen. 2018. Plant nutrient diagnostics: Potato. Peachtree Corners, GA: International Plant Nutrition Institute (IPNI).
- Repo-Carrasco, R., C. Espinoza, and S. E. Jacobsen. 2003. Nutritional value and use of the Andean crops quinoa (Chenopodium quinoa) and kañiwa (Chenopodium pallidicaule). Food Reviews International 19 (1–2):179–89. doi: 10.1081/FRI-120018884.
- Steinberg, R. A. 1953. Symptoms of molybdenum deficiency in tobacco. Plant Physiology 28 (2):319–22. doi: 10.1104/pp.28.2.319.
- Summerhays, J. S., B. G. Hopkins, V. D. Jolley, M. W. Hill, C. J. Ransom, and T. R. Brown. 2015. Enhanced phosphorus fertilizer (Carbond P®) supplied to maize in moderate and high organic matter soils. Journal of Plant Nutrition 38 (9):1359–71. doi: 10.1080/01904167.2014.973039.
- Summerhays, J. S., V. D. Jolley, M. W. Hill, and B. G. Hopkins. 2017. Enhanced phosphorus fertilizers (Carbond P® and AVAIL®) supplied to maize in hydroponics. Journal of Plant Nutrition 40 (20):2889–97. doi: 10.1080/01904167.2017.1384007.
- Trejo-Téllez, L. I., and F. C. Gómez-Merino. 2012. Nutrient solutions for hydroponic systems. In Hydroponics: A standard methodology for plant biological researches, Chapter 1, ed. T. Asao, 1–22. Rijeka, Croatia: InTech Open. doi: 10.5772/2215.