
ABSTRACT
Transitions between forest and savannah vegetation types in fossil pollen records are often poorly understood due to over-production by taxa such as Poaceae and a lack of modern pollen-vegetation studies. Here, modern pollen assemblages from within a forest-savannah transition in West Africa are presented and compared, their characteristic taxa discussed, and implications for the fossil record considered. Fifteen artificial pollen traps were deployed for 1 year, to collect pollen rain from three vegetation plots within the forest-savannah transition in Ghana. High percentages of Poaceae and Melastomataceae/Combretaceae were recorded in all three plots. Erythrophleum suaveolens characterised the forest plot, Manilkara obovata the transition plot and Terminalia the savannah plot. The results indicate that Poaceae pollen influx rates provide the best representation of the forest-savannah gradient, and that a Poaceae abundance of >40% should be considered as indicative of savannah-type vegetation in the fossil record.
1. Introduction
The transition between closed-canopy forest and open-canopy savannah vegetation is one that can be observed at the present day along climate gradients, and in the fossil record during periods of climatic change (Mayle et al. Citation2007; Azihou et al. Citation2013; Miller & Gosling Citation2014; Miller et al. Citation2016). The transition between forest and savannah is, however, not always stable or clear cut (Cardoso et al. Citation2016), with large areas of land being classified as mosaics of forest and savannah (e.g. White et al. Citation1983; Torello-Raventos et al. Citation2013). Transitional ecosystems are today recognised as having conservation value in their own right, due to their ability to provide habitats for organisms from different ecosystems, and the potential for them to be especially sensitive to climate change (JNCC Citation2010; Ibie et al. Citation2016; Joyce et al. Citation2016). The identification of transitional ecosystems in the fossil record may be crucial in providing evidence to support efforts to conserve biodiversity, especially if the persistence of these transitional areas can be demonstrated over long time scales.
Projections of future environmental change suggest that modern forest–savannah boundaries will be altered, and transitional zones shift (Niang et al. Citation2014), but little is known about what this change will look like in terms of vegetation composition (Cramer et al. Citation2001). Fossil pollen records of forest-to-savannah transitions can serve as a guide to the likely future vegetation response; however, it has been difficult to observe forest-to-savannah transitions in the fossil pollen record because of a poor understanding of how they are represented. The relationship between taxa represented in the vegetation and in the pollen rain is known not to be directly proportional (Davis Citation1963). Anemophilous taxa, and zoophilous taxa with ‘messy’ pollination syndromes (open flowers with extruded anthers) are generally over-represented relative to their abundance in the vegetation, whereas those zoophilous taxa with more closed floral morphologies are more often under-represented or palynologically silent (present in vegetation but not pollen assemblages) (Bush & Rivera Citation2001).
To facilitate a better understanding of transitional periods in fossil pollen records, this study has explored modern pollen–vegetation relationships on a landscape scale (plots within 10 km of one another) within the forest–savannah transition zone in tropical West Africa. Data from pollen traps were used to characterise the modern pollen rain produced by three vegetation types (forest, transition and savannah) during 1 year. Modern pollen data were then compared with vegetation inventories, and an assessment was made as to whether it is possible to differentiate between forest, transition and savannah vegetation on the basis of the pollen assemblage alone. The implications of this modern study for identification of past forest–savannah transitions in the fossil pollen record are then discussed.
1.1. Vegetation at the forest–savannah transition
The transition between forest and savannah ecosystems, on both spatial and temporal scales, is one that has been of interest to biogeographers, ecologists and palaeoecologists for decades (Beard Citation1953; Aubréville Citation1966; Ybert Citation1975). Although the botanical composition of savannah-type ecosystems on different continents has been shown to vary widely, it can, along with the height and canopy cover, be used in their classification (Torello-Raventos et al. Citation2013). The shift from forest to savannah is controlled on a macro-scale (100s of km) by climatic gradients, primarily rainfall (Swaine Citation1992; Lehmann et al. Citation2011), but on smaller scales other factors such as soil type and herbivory are also important. Where mean annual precipitation (MAP) is less than 650 mm, savannahs form because water availability limits tree growth and, consequently, forest cover (Sankaran et al. Citation2005). At precipitation levels of more than 650 mm MAP, savannahs can occur when other factors such as fire and herbivory inhibit the growth or enhance the mortality of trees (Swaine et al. Citation1992; Higgins et al. Citation2012; Dexter et al. Citation2015). Edaphic factors such as soil type and fertility may also influence local vegetation dynamics, resulting in the formation of a mosaic of forest and savannah within regions that experience a more or less uniform climate (Lehmann et al. Citation2011).
1.2. Pollen at the forest–savannah transition
On a large scale, pollen production by modern ecosystems in Africa has been found to differ between vegetation types (Gajewski et al. Citation2002; Lézine et al. Citation2009). For example, an extensive study of modern pollen–vegetation relationships in central Africa demonstrated that it is possible to differentiate broad vegetation types, such as tropical forest and tropical seasonal forest, using the pollen signal, although difficulties were encountered in areas that were considered transitional (Lebamba et al. Citation2009). Within the forest–savannah transition zone of Cameroon, it is possible to identify different vegetation types by their modern pollen rain, although the characteristic pollen and vegetation taxa are different due to sampling bias towards larger woody plants in the botanical inventories, and pollen from entomophilous taxa being under-represented (Vincens et al. Citation2000). The forest–savannah transition has also been shown, in Côte d'Ivoire, to produce distinct pollen assemblages depending on the vegetation, with Hewittia malabarica L. (Suresh) indicating the forest edge, and savannah being characterised by Poaceae pollen percentages of > 40% (Ybert Citation1975). Studies of the Sudanian and Sahelian regions have shown that it is possible to differentiate between these regions by their pollen signals, and to also differentiate smaller scale vegetation types within them (e.g. Isoberlinia dry forest and dry or wet Combretaceae forest) (Lézine & Edorh Citation1991; El Ghazali & Moore Citation1998), although the arboreal pollen signal is often overwhelmed by very high (> 90%) Poaceae abundances.
1.3. Forest–savannah transitions through time
Transitions between forest and savannah have been tracked through the last c. 1 Ma in tropical West Africa by 15 offshore pollen records (Sowunmi Citation1981; Dupont et al. Citation1989; Bengo & Maley Citation1991; Lézine Citation1991; Dupont & Agwu Citation1992; Lézine & Vergnaud-Grazzini Citation1993; Frédoux Citation1994; Dupont & Weinelt Citation1996; Shi & Dupont Citation1997; Dupont et al. Citation1998; Jahns et al. Citation1998; Shi et al. Citation2001; Marret et al. Citation2013; Dalibard et al. Citation2014; Vallé et al. Citation2014) and several terrestrial records (Maley Citation1991; Elenga et al. Citation1994; Maley & Brenac Citation1998; Salzmann et al. Citation2002) of which only one record is older than 35 ka BP (Lake Bosumtwi, Ghana). The fossil pollen record obtained from Lake Bosumtwi is unique to tropical West Africa, and to date covers the last c. 500,000 years of the 1 Ma sediment core that was recovered (Koeberl et al. Citation2007; Miller & Gosling Citation2014; Miller et al. Citation2016). Pollen from offshore and terrestrial records identifies shifts in the vegetation correlating with climatic changes that broadly relate to orbital (glacial–interglacial) cycles during the Quaternary (Miller et al. Citation2016). The vegetation shifts observed are thought to be a consequence of the north- to southwards movement of the tropical rain belt, and the intensity of the African Monsoon (Shanahan et al. Citation2015; Miller et al. Citation2016). The shifts between wetter forest and drier savannah ecosystems are recorded in the pollen record of Lake Bosumtwi by fluxes in the Poaceae abundance, which varies from 0 to 90% of the terrestrial pollen sum; interpretations of the Lake Bosumtwi fossil pollen record placed the transition between forested and savannah vegetation types at 55% Poaceae (Miller et al. Citation2016).
2. Study region
2.1. Tropical West Africa
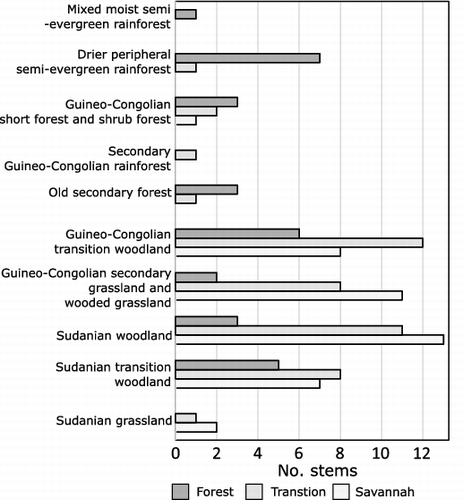
The vegetation of tropical West Africa has been classified into two main biomes – the ‘Guineo–Congolian regional centre of endemism’ and, farther north, the ‘Sudanian regional centre of endemism’ – which are distinct because of their endemic flora. The transition between the two is primarily driven by decreasing precipitation from south to north (White, Citation1983). The Guineo–Congolian region comprises areas of wet and semi-deciduous forests, transitional rainforests, secondary grassland and mosaics, while the Sudanian region contains drier woodland and more open savannah vegetation types (Supplemental data).
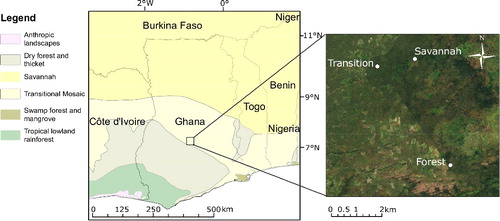
At around 8°N there is a band of vegetation known as the ‘Guineo–Congolian/Sudanian transition zone’ (White Citation1983), which is between 100 and 500 km wide and runs approximately east–west across the West African countries, including Ghana (Gautier & Spichiger Citation2004). The transition zone comprises a patchwork of forest and savannah vegetation types and can be considered the boundary between the wet Guineo–Congolian forest types of the south and the drier Sudanian savannah regions of the north. It is within this transition zone that the Kogyae Strict Nature Reserve is situated, in which the plots for this study are located ().
Figure 1. Location of the field study site in Ghana as a whole, relative to vegetation types (left), and location of vegetation plots relative to one another (right) (Source of map/satellite image).
2.2. Kogyae strict nature reserve
In 2012, three permanent vegetation study plots (KOG02, ‘Forest’; KOG04, ‘Transition’; and KOG05, ‘Savannah’ (see sections 2.3.1–2.3.3 for further details) were established in the Kogyae Strict Nature Reserve (Ghana) at the transition between the Guineo–Congolian and Sudanian biomes, to characterise the vegetation and monitor environmental changes at the ecotone (). The Kogyae vegetation study plots were set up as part of the Global Ecosystem Monitoring (GEM) network (http://gem.tropicalforests.ox.ac.uk/) and are also part of the African Tropical Rainforest Observation Network (AfriTRON) (Lewis et al. Citation2013). Vegetation data from these plots are available at http://www.forestplots.net (Lopez-Gonzalez et al. Citation2011). The Kogyae Strict Nature Reserve contains a mosaic of ecosystems which differ in their floristic composition, tree cover, canopy height and density, and understory vegetation. The Kogyae region typically receives around 1000 mm of rain/year, and experiences a dry season between October and April of each year (weather data from the weather station at the Kogyae Field Station). During the dry season the savannah vegetation in Kogyae usually burns, typically during February. The three vegetation study plots were established in three distinct vegetation types within Kogyae, but experience similar climatic conditions due to their close proximity; they are within 10 km of one another ().
The soils present in the Kogyae Strict Nature Reserve are shallow and prone to drying out, and overlie horizontally bedded sandstones that are part of the Voltarian Group; however, depth and composition of soils differs between forested and savannah areas (Wildlife Department, Accra Citation1994). Animals present in the reserve that may exert grazing or browsing pressure include buffalo, baboons, antelopes, five species of monkey and domestic cattle (Danquah & Owusu Citation2015).
2.3. Vegetation of study plots
The Forest (KOG02), Transition (KOG04) and Savannah (KOG05) vegetation study plots are each 1 hectare and were established following the standard GEM protocols (Marthews et al. Citation2014). As part of the GEM programme a vegetation inventory was generated for each plot, and a programme of yearly measurements of all trees > 10 cm in diameter at breast height (DBH) was established measuring DBH, height and yearly growth. Two genera occur only in the Forest plot (Cola and Dacryoides) and two genera occur only in the Savannah plot (Trichilia and Uapaca) (Supplemental data). The Transition plot includes six genera which occur across all three plots (Ficus, Anogeissus, Lannea, Margaritaria, Sterculia and Pterocarpus) and shares multiple genera with both the Forest and Savannah plots, but does not contain any unique genera.
2.3.1. Forest (KOG02)
The centre of the Forest plot is located at 7°15′41.9“N, 1°09″00.2”W, 197 m above sea level (asl) ( and ). Thirty-seven species were recorded in the Forest plot with DBH > 10 cm, with nine taxa occurring at > 3% abundance (Supplemental data), the most abundant, by percentage of stems, being Cola gigantea A.Chev. (12.3%), Sterculia tragacantha Lindl. (10.7%) and Dacryodes klaineana (Pierre) H.J.Lam (9.6%). There are also understory monocotyledonous plant taxa, e.g. Zingiberaceae, Costaceae and Marantaceae, although the abundance of these taxa was not quantitatively assessed, as they are herbaceous and therefore were not included in the vegetation surveys. The taxa in the Forest plot fall largely into ‘drier peripheral semi-evergreen rainforest’ (seven taxa), or ‘Guineo-Congolian transition woodland’ (six taxa), but with some ‘Sudanian transitional woodland’ elements (five taxa), including Ceiba pentandra (see Supplemental data and ). The average tree height is 20.8 m. The diversity (Shannon index) of the Forest plot is 3.11.
Figure 2. Photographs of the vegetation in the three plots; (a) Forest (KOG02) 7°15'41.9''N, 1°09'00.2''W, 197 m asl; (b) Transition (KOG04) 7°18'07.7'' N, 1°10'50.2''W and 190 m asl; and (c) Savannah (KOG05) 7°18'04.1'' N, 1°09'53.8''W and 186 m asl.
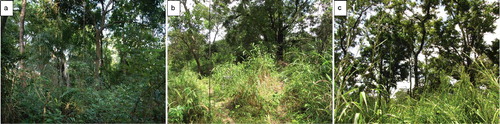
Figure 3. Bar chart showing the vegetation types, as outlined by White (Citation1983), to which the species in the three plots belong.
2.3.2. Transition (KOG04)
The centre of the Transition plot is located at 7°18'07.7“N, 1°10′50.2″W and 190 m asl. There are 34 species recorded with >10 cm DBH, with nine taxa occurring at > 3% abundance (Supplemental data), the most abundant of which, by percentage of stems, are Sterculia tragacantha (26.9%), Pterocarpus erinaceus Poir (10.7%) and Maranthes polyandra (Benth.) Prance (6.8%). When compared to White (Citation1983), the taxa in the plot are those characteristic of ‘Guineo–Congolian transition woodland’ (12 taxa) and ‘Sudanian Woodland’ (11 taxa), with some ‘Guineo–Congolian secondary grassland and wooded grassland’ taxa (eight). The average tree height is 12.1 m. The diversity (Shannon index) of the Transition plot is 2.82.
2.3.3. Savannah (KOG05)
The Savannah plot is located at 7°18'04.1“N, 1°09'53.8”W and 186 m asl. There are 26 recorded species with > 10 cm DBH, of which eight occur at > 3% (Supplemental data), the most abundant of which, by percentage of stems, are Bridelia ferruginea Benth. (27.7%), Pterocarpus erinaceus (10.7%) and Uapaca togoensis Pax (8.1%). The vegetation types of White (1983) are represented by 'Sudanian woodland' (13 taxa) and 'Guineo-Congolian secondary grassland and wooded grassland' (11 taxa). The understory consists mainly of tall (>1 m in height) grasses, with other herbaceous taxa such as members of the Asteraceae. The average tree height is estimated to be between 10 and 12 m. The diversity (Shannon index) of the Savannah plot is 2.56.
3. Methods
3.1. Field methods
Modern pollen rain was collected using pollen traps, composed of a plastic funnel (diameter 140 mm), glass fibre filter paper affixed to the funnel using bathroom sealant, and cotton wool fibre filling the rest of the funnel, held in place with plastic netting secured around the funnel using plastic-coated wire, following (Gosling et al. Citation2003).
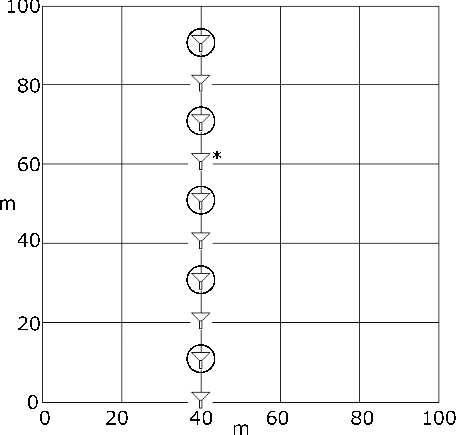
A total of 30 traps, 10 per vegetation plot (1 ha; 100 m × 100 m) were deployed, along the 40-m line (i.e. a 100-m-long transect across the plot, at the point 40 m along from the 0 m/0 m point of the plot; ). All traps were positioned at approximately 50 cm above ground level to reduce risk of inundation and to ensure standard height of sampling across this study. The traps were affixed to stakes hammered firmly into the ground or, in cases where that was not possible, to trees. The distance from each trap to the closest large tree (> 10 cm DBH) was recorded for all sites, and the tag numbers of these trees noted. Upon collection, traps were emptied of their contents, which were placed into sealed plastic bags and stored in a refrigerator.
Figure 4. Diagram showing layout of pollen traps (represented by triangle symbols) within vegetation survey plots. Circled traps indicate those processed and counted, which was every other trap in the Savannah and Transition plots (odd numbers). Asterisk indicates Trap 76 in the Forest plot, which was sampled instead of Trap 75, due to poor condition of Trap 75.
The traps were in the field between October 2013 and October 2014, except for a short period in February during which all scientific equipment was removed from the plots to avoid destruction in the annual burn; equipment in the plots was removed and re-deployed by researchers from the Forestry Institute of Ghana (FORIG).
3.2. Laboratory methods
Five traps per plot were processed and counted, to provide good statistical coverage of the plot whilst avoiding unnecessary effort (Gosling et al. Citation2005). Samples were processed following the method for cotton wool-based traps from Gosling et al. (Citation2003), in which cotton wool is removed by acetolysis and filter paper removed using hydrofluoric acid. Eight Lycopodium tablets per trap were added as an exotic marker to enable the calculation of pollen concentrations (Stockmarr Citation1971); University of Lund batch number 124961, containing 12,542 ± 931 spores per tablet. Samples were mounted in glycerol and counted at 400× magnification using a Nikon Eclipse 50i microscope. Pollen taxa were identified using atlases relating to tropical West Africa (van Campo Citation1974; Ybert Citation1979; Riollet & Bonnefille Citation1980; Gosling et al. Citation2013) and the African Pollen Database (Vincens et al. Citation2007).
3.3. Statistical methods
Pollen counts were recorded digitally (Valencia Citation2014), and sample-specific estimate count sizes required to capture the major features of pollen rain were generated (Keen et al. Citation2014), which returned count sizes that varied between 300 and 800 grains per sample. Data were visualised in the plotting programme C2 (Juggins Citation2007). Pollen types were allocated numbers sequentially from 1 upwards during counting, and taxonomic information was later assigned to these types. Pollen type information can be found in Julier and Gosling (Citation2017).
The relationship between pollen and vegetation abundance was calculated by dividing average percentage abundance of pollen in each trap by percentage basal area of the corresponding taxon in the vegetation plot; the degree of under- or over-representation is then expressed as an ‘R-rel value’ following Gosling et al. (Citation2017), i.e. values > 1 indicate a taxon is over-represented in the pollen relative to the vegetation. Characteristic taxa were designated as those that occurred in at least four out of five samples from a plot, and at ≥ 3% abundance in one sample or more. These conditions were chosen as they ensure that the taxa designated as characteristic are well-represented spatially in the plot (present in at least four of five traps) and represented by enough pollen grains (minimum of nine grains in smallest count of 300) to decrease the chance that they were anomalous or from far outside the bounds of the plots.
Non-metric multidimensional scaling (NMDS) using the Bray–Curtis distance metric was used to ordinate the data. Wisconsin double-standardisation, which standardises taxon counts to their taxon maxima and sample counts to their sample size, was used to minimise the effect of rare and very abundant taxa, and to reduce the effect of sample size. Singletons (taxa that only occur in one sample and as such provide no useful grouping information) were removed. NMDS is considered an appropriate ordination technique for count data as it is non-parametric (Oksanen et al. Citation2015) and has previously been used to analyse fossil and modern pollen assemblages (Jardine & Harrington Citation2008; Schüler et al. Citation2014). The Shannon index was used to calculate diversity, as this metric has been shown to give equal weight to rare and abundant taxa (Morris et al. Citation2014). All statistical analyses were conducted using R statistical software (R Core Team Citation2016) with R Studio (RStudio Citation2012) and with the package Vegan (Oksanen et al. Citation2015). Code for all analyses run in this section may be found in the Supplemental data.
4. Results
4.1. Modern pollen rain
Of the 30 traps deployed in Kogyae, 30 were recovered and every other trap (i.e. odd numbers) was processed and counted, to give five traps from each plot and an even coverage of the plot. Two taxa from Kogyae had mean abundances of > 10.0%: Poaceae (minimum 17.0%, maximum 60.9%, mean 28.8%) and Melastomataceae/Combretaceae (minimum 1.0%, maximum 72.7%, mean 18.8%), and four taxa were present in all traps: Celtis, Alchornea, Poaceae and Melastomataceae/Combretaceae (). In total, 121 pollen taxa were defined in Kogyae, of which 37 were assigned botanical affinities.
Figure 5. Pollen diagram showing pollen assemblages from each plot, along with total influx values for each trap. Forest traps begin ‘FT’, Transition traps ‘TT’ and Savannah traps ‘ST’.
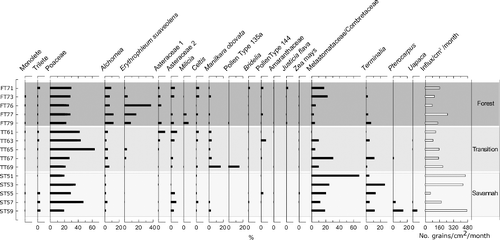
4.1.1. Forest
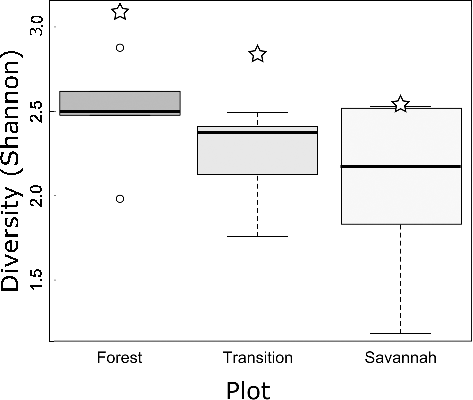
The Forest traps displayed broadly similar pollen assemblages, with Poaceae accounting for 19.0–25.0% of grains, and with a consistent presence of Alchornea (7.4–12.6%) and Erythrophleum (1.0–38.0%). Melastomataceae/Combretaceae was present in all traps, but varied in abundance from 3.6 to 23.0%. Celtis, although present in all of the traps, varied from 0.5 to 4.0% of the assemblage. Both Asteraceae types (Asteraceae 1 and Asteraceae 2) were present in four out of the five Forest traps, albeit in low abundances (1.8–5.8%). Milicia was present in three of the traps, from 0.3 to 7.0%. Nine taxa were identified in both the pollen and vegetation assemblages; these were Afzelia africana (R-rel = 0.02), Bombax (R-rel = 0.02), Celtis (R-rel = 1.44), Erythrophleum suaveolens, (R-rel = 3.64), Ficus (R-rel = 0.24), Lannea (R-rel = 0.05), Manilkara obovata (R-rel = 0.61), Melastomataceae/Combretaceae (R-rel = 6.37) and Milicia (R-rel = 0.89) (; and ). Within the Forest plot, 37 vegetation and 86 pollen taxa were identified, with nine taxa identified in both. The influx rates in this plot varied between 85 grains/cm2/month and 258 grains/cm2/month, with an average of 154 grains/cm2/month, and the diversity of the samples ranged from 2.0 to 2.9, with a mean of 2.5 ().
Table 1. Taxa that occur in both pollen assemblages and vegetation survey for the Forest plot, their abundances in the data set and their R-rel values (average pollen abundance in samples/% basal area of plot covered by vegetation taxon).
Figure 6. Bar chart showing R-rel values of taxa represented in both pollen and vegetation, where p = average % abundance of a taxon and v = total basal area of taxon in the vegetation. Asterisks indicate that the R-rel values were too high to show on the figure; Forest Melastomataceae/Combretaceae R-rel = 6.37 and Erythrophleum suaveolens R-rel = 3.64. Transition Melastomataceae/Combretaceae R-rel = 5.18, and Savannah Melastomataceae/Combretaceae R-rel = 3.53.
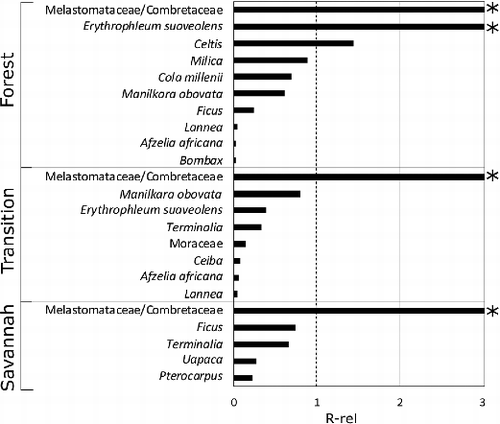
Figure 7. Scatter plot of vegetation basal area % against pollen abundance %. Taxon names are as in the text, except Melastomataceae/Combretaceae, which is abbreviated to ‘MelCom’. The R-rel = 1 line is added to illustrate those taxa that are over-represented in the pollen compared to the vegetation (above the line), against those which are under-represented (below the line).
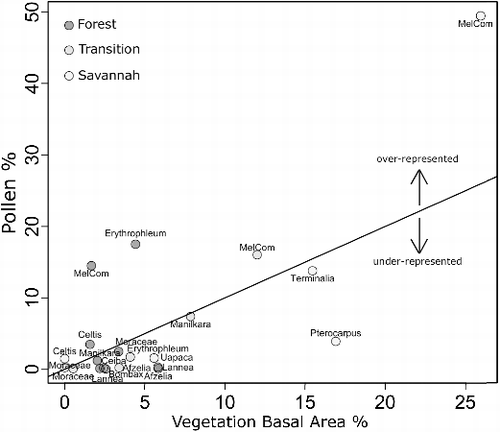
Figure 8. Diversity of the pollen assemblages (box and whisker plots) and the vegetation diversity of the plots (star symbols). Boxes show 25th and 75th percentiles of data; bars near the middle of the boxes show the median value; and ends of whiskers show the extremes of the data, as long as those are not more than 1.5 inter-quartile ranges from the 25th and 75th percentiles. For ‘Forest’ the diversity data are not very variable, leading to its whiskers being short, and its outlying values not being joined by a whisker.
4.1.2. Transition
Poaceae pollen was present in all the Transition traps, accounting for at least 19.0% and at most 60.0% of the pollen sum. Alchornea was present in abundances of 2.0–7.0%. Erythrophleum was present in three traps, in abundances of < 5%. The Melastomataceae/Combretaceae signal ranged from 0.9 to 31.5% among the five traps. The two Asteraceae types accounted for up to 5.0% each of the pollen sum, but with variable percentage abundances (1.2–10.0%), and with neither being present in all five traps. Manilkara obovata accounted for between 2.3 and 4.5% of the pollen sum in four traps, but 16.9% in the fifth. ‘Pollen type 135a’ was only present in Trap 69, at 15.5%. Seven taxa that were present in both the vegetation and pollen assemblages were Afzelia africana (R-rel = 0.06), Ceiba (R-rel = 0.08), Erythrophleum suaveolens (R-rel = 0.39), Lannea (R-rel = 0.05), Manilkara obovata (R-rel = 0.80), Melastomataceae/Combretaceae (R-rel = 5.18), Moraceae (R-rel = 0.15) and Terminalia (R-rel = 0.34) (; and ). Within the Transition plot, 34 vegetation and 71 pollen taxa were identified, with eight taxa identified in both. Influx rates in this plot varied from 92 to 204 grains/cm2/month, with an average of 146 grains/cm2/month, and diversity of the traps ranged from 1.8 to 2.5, with an average of 2.3 ().
Table 2. Taxa that occur in both pollen assemblages and vegetation survey for the Transition plot, their abundances in the data set and their R-rel values (average pollen abundance in samples/% basal area of plot covered by vegetation taxon).
4.1.3. Savannah
The traps exhibited largely similar pollen assemblages, with Poaceae and Melastomataceae/Combretaceae contributing more grains than any other taxa. Poaceae percentages were between 17.0 and 42.4%, and Melastomataceae/Combretaceae grains contributed 12.5–68.1%. Alchornea was present in all traps, but at < 3.0% in four. Asteraceae 2 was present in three traps at percentages of > 3.0%, but not in the other two. Celtis was present in four out of the five traps, but at abundances of < 3.0%. Pterocarpus pollen was found at 4.3 and 14.9% in two traps. Uapaca was present in the same two traps (57 and 59) as Pterocarpus, at 0.9 and 6.5%, respectively. Terminalia was present in all of the Savannah traps, from 4.6 to 27.1%. Five taxa were present in both the vegetation and pollen assemblages: Ficus (R-rel = 0.74), Melastomataceae/Combretaceae (R-rel = 3.53), Pterocarpus (R-rel = 0.22), Terminalia (R-rel = 0.66) and Uapaca (R-rel = 0.27) (; and ). Within the Savannah plot, 26 vegetation and 67 pollen taxa were identified, with five taxa identified in both. Influx rates for Savannah traps varied from 61 to 478 grains/cm2/month (Trap 55 had an unusually low influx rate compared to the other traps) with an average of 322 grains/cm2/month, and the diversity of the traps ranged from 1.2 to 2.6, with an average of 2.1 ().
Table 3. Taxa that occur in both pollen assemblages and vegetation survey for the Savannah plot, their abundances in the data set and their R-rel values (average pollen abundance in samples/% basal area of plot covered by vegetation taxon).
4.2. Multivariate analysis
The NMDS plot () shows the distribution of the samples (each indicated by black, capital letters, e.g. ‘FT71’ = Forest, Trap 71) in ordination space. The Forest and Savannah samples form two distinct groups in ordination space, separated on NMDS 2. The Transition samples cluster on NMDS 1, but are distributed widely over NMDS 2, and overlap with the ordination space occupied by Savannah samples. Abundant pollen taxa from the plots fall out with their parent vegetation types, such as Erythrophleum suaveolens with the Forest traps, Manilkara obovata with the Transition traps and Uapaca with the Savannah traps. Poaceae is positioned roughly centrally to the distribution of all of the samples.
Figure 9. Non-metric multidimensional scaling (NMDS) plot of pollen trap assemblages. Forest traps begin ‘FT’, Transition traps ‘TT’ and Savannah Traps ‘ST’. Polygons encompass all traps of each plot. Named taxa are included in grey. Unidentified pollen taxa were used in the analysis but are not shown in the figure.
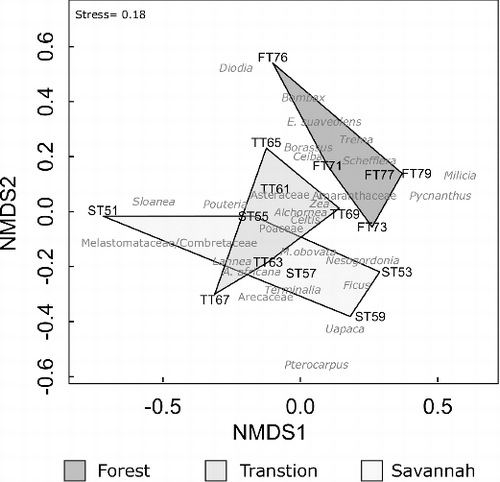
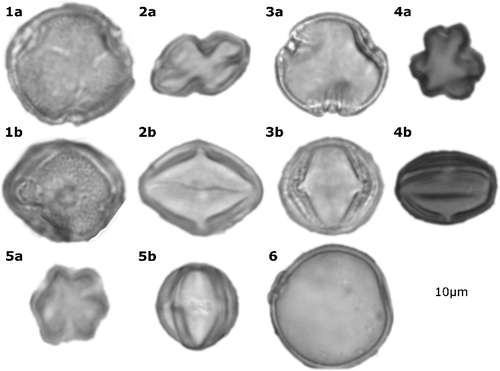
Plate 1. Characteristic taxa from all plots. 1 = Erythrophleum suaveolens, 2 = Manilkara obovata, 3 = Alchornea, 4 = Melastomataceae/Combretaceae, 5 = Terminalia sp., 6 = Poaceae sp. Letters ‘a’ and ‘b’ denote polar and equatorial views of the same grain.
5. Discussion
The data presented here suggest that it is possible to differentiate between vegetation types within a forest–savannah transition zone using their pollen assemblages. Here, characteristic pollen taxa from each plot are defined, along with more minor elements of the pollen rain which do not meet the definition of ‘characteristic’ but still merit discussion based on their low abundance in a high number of traps, or high abundance in a small number of traps. Plate 1 shows characteristic pollen taxa from the plots. Pollen–vegetation relationships are then discussed, the three plots are compared and the implications of these data for interpreting the fossil pollen record are considered, particularly with reference to the fossil pollen record of Lake Bosumtwi, Ghana (Miller & Gosling Citation2014; Miller et al. Citation2016).
5.1. Characterisation of vegetation plots by their modern pollen rain
5.1.1. Forest
The Forest traps are relatively homogeneous in terms of pollen assemblage, influx values and diversity ( and ). The characteristic pollen taxa in the Forest plot were Poaceae, Alchornea, Erythrophleum suaveolens and Melastomataceae/Combretaceae (). Of these characteristic taxa, Erythrophleum suaveolens (1.0–38.0% of the pollen sum) and Melastomataceae/Combretaceae (3.6–23.2% of the pollen sum) exhibited the most variation between traps. The other characteristic taxa had less variable signals, with Poaceae accounting for between 19.1 and 26.0% and Alchornea between 7.4 and 12.6% of the pollen sum.
Only one of the taxa that accounts for more than 3% of stems in the vegetation inventory was identified in the pollen signal as characteristic: Erythrophleum suaveolens. Erythrophleum suaveolens is widespread across tropical Africa (Hawthorne & Jongkind Citation2006), but is predominantly a tree of dry semi-deciduous Guineo–Congolian forest (Gorel et al. Citation2015), and as such provides a useful indicator of the Forest plot in this study. It is also strongly over-represented in this plot, with a R-rel ratio of 3.64.
Melastomataceae/Combretaceae was a characteristic pollen taxon (up to 38.0% of the pollen sum). It did not, however, account for a large component of the vegetation inventory, comprising just 1.6% of the basal area of the plot. Consequently, the R-rel value for this group was 6.37. This large R-rel value could be due to the over-production of pollen by Combretaceae, in which andromonoecious inflorescences are known to occur (Watson & Dallwitz Citation1992). There are no woody Melastomataceae recorded in the Forest plot, but there may be understory plants which contribute to the pollen signal. Any herbaceous Melastomataceae would likely, however, contribute only a small amount of pollen, as many Melastomataceae are buzz-pollinated, meaning that their pollen is not freely released into the air (Jones & Little Citation1983).
Together, the Asteraceae pollen types are characteristic of the Forest plot, although Asteraceae is absent from the vegetation survey. The absence of Asteraceae in the vegetation survey is likely due to it being represented by herbaceous taxa which were not recorded in the inventory, potentially including the invasive Asteraceae Chromolaena odorata (L.) King and Robinson which has been reported widely in Ghana and in the Kogyae Strict Nature Reserve (Castel Citation2012).
One of the characteristic pollen taxa of the Forest plot is Alchornea, which occurs in all traps at percentages of up to 12.6%. This taxon is not, however, present in the vegetation survey for the plot. This could be due to one of several factors: (i) that Alchornea is genuinely not present in the vegetation plot, but is present in the surrounding vegetation; (ii) that the pollen grain identified as Alchornea is a misidentification and originates from a different plant; or (iii) that the Alchornea plants contributing to the signal possess stems that are too small to be included in the vegetation surveys, which only record plants of > 10 cm DBH. It is likely that the latter is true of Alchornea cordifolia (Schumach. & Thonn.) Müll.Arg, which is a commonly recorded species in Guineo–Congolian Transition woodland and exhibits a scandent habit, making it likely that it could have been excluded from surveys and therefore account for the apparently orphan Alchornea pollen.
Taxa that occurred at > 3% but in less than four traps included Milicia and Celtis. Milicia accounted for > 3% of the pollen sum in two traps, although it was present in three, and Celtis only occurred at > 3% in two traps, although was present in four. The low abundances of Milicia and Celtis mirror their abundance in the vegetation, which is surprising, as both the Moraceae (the family to which Milicia belongs) and Celtis have previously been found to be over-represented in pollen rain (Gosling et al. Citation2005; Bush et al. Citation2011). Possible reasons for their relatively low representation compared to similar studies could relate to over-production by Melastomataceae/Combretaceae and Poaceae swamping the traps. It is also possible that due to only 1 year of data being available, the climatic conditions may not have favoured flowering that year, or a biological factor such as a fungal infection or pest could have prevented the Celtis individuals from producing as much pollen as usual.
There were 27 vegetation taxa whose pollen was not identified in the pollen assemblages, including all but two of the most abundant species recorded in the vegetation surveys (Erythrophleum suaveolens and Afzelia africana). This abundance of palynologically silent taxa could be due to their entomophilous pollination syndromes (Supplemental data), climatic conditions not favouring flowering in the year 2013–2014, or the individuals of those taxa being located in the plot in such a way as to make pollen deposition unlikely. Although the main over-producing taxa such as Poaceae and Melastomataceae/Combretaceae may have ‘messy’ or anemophilous pollination syndromes, there does not seem to be a clear link between taxa that are entomophilous or zoophilous and absent from the pollen assemblages in this system, despite this having been shown to be the case in other studies of modern pollen rain (Bush & Rivera Citation2001; Gosling et al. Citation2005).
5.1.2. Transition
Characteristic taxa for the Transition plot were Poaceae, Alchornea, Melastomataceae/Combretaceae and Manilkara obovata. The percentage abundances of Poaceae (19.1–61.1%), Melastomataceae/Combretaceae (1.0–31.5%) and Manilkara obovata (2.3–16.9%) vary considerably between traps. Alchornea (2.7–6.8%) does not exhibit such variability.
Melastomatacee/Combretaceae were over-represented (R-rel = 5.18), likely due to over-production by Combretaceae. All other taxa identified in both pollen and vegetation in this plot, besides Poaceae, were under-represented. Manilkara obovata exhibits the closest ratio to 1:1 in this plot, at 0.8 (). Although Manilkara obovata is primarily a forest species (White et al. Citation1983), it is characteristic of this particular plot's pollen assemblage. It has entomophilous, hermaphroditic flowers whose anthers protrude from the perianth, potentially allowing pollen to be released more freely than from a closed flower and resulting in a higher R-rel value of this taxon than might be expected for an entomophilous taxon.
Four taxa are present at percentages of > 10% in only one trap. These are Asteraceae types 1 and 2, Type 135a and Terminalia. Terminalia accounts for 10.2% of the stems in this plot, but does not contribute a characteristic level of pollen to the assemblages, instead being under-represented (R-rel = 0.34).
The Moraceae in the Transition plot were under-represented (R-rel = 0.15), as were Ceiba (R-rel = 0.08), Afzelia africana (R-rel = 0.06) and Lannea (R-rel = 0.05). Of these, the Moraceae, Ceiba and Afzelia africana were all only represented by a small number of individuals (two, two and three individuals, respectively), meaning that pollen production may have been genuinely low for these taxa. Lannea is represented by 10 individuals, however, and has the lowest R-rel ratio (0.05), indicating that it is the most under-represented. These taxa are all monoecious or hermaphroditic, and insect pollinated, leading to no clear explanation of why they might be under-represented to different extents.
Alchornea and Celtis were present in the pollen (2.5–6.7% and 0.7–3.8% of the pollen sum, respectively) but not in the vegetation. As Celtis pollen was present in all three plots, but only in one of the vegetation surveys (Forest), this could be the result of transport of pollen from outside the plot.
5.1.3. Savannah
The characteristic pollen taxa of the Savannah plot were Poaceae (14.1–42.4%), Melastomataceae/Combretaceae (12.5–68.1%), Terminalia (4.6–27.1%) and Alchornea (1.8–4.4%). Celtis (0.6–2.9%) was present in at least four out of five of the traps, but did not account for more than 3% of the pollen sum in any trap. Taxa that accounted for > 3% in at least one trap but were not present in at least four included Pterocarpus (0.0–14.9%) and Uapaca (0.0–6.6%).
The pollen assemblage in the Savannah plot exhibited an over-representation of Melastomataceae/Combretaceae (R-rel = 3.53). Under-represented taxa were Pterocarpus (R-rel = 0.22), Terminalia (R-rel = 0.66) and Uapaca (R-rel = 0.27). Pterocarpus, although not a characteristic pollen type of the Savannah pollen assemblage, is a genus of the Sudanian woodland (Novinyo et al. Citation2014). Uapaca is also a genus of wooded Savannah ecosystems, but is dioecious, and the genders of the trees in the Savannah plot are unknown, meaning that this could be a reason for its under-representation despite its abundance in the vegetation.
One trap (Trap 55) was found to have a low pollen accumulation rate (62 grains/cm2/month) in comparison to the other Savannah plot traps, which exhibited concentrations of between 187 and 475 grains/cm2/month. Despite its low pollen accumulation rate, Trap 55 did not contain an anomalous pollen assemblage, with similar percentages of abundant taxa to the other traps, and a high diversity. It is possible that it was covered by a leaf or other debris for part of the year, leading to less pollen accumulating in this trap than the other traps. We decided, however, to include Trap 55 in the analysis despite its anomalously low pollen accumulation rate, as we consider that it represents the pollen assemblage in a similar way to its sister traps.
The Savannah plot contains low levels of Alchornea (1.7–4.4%), despite none being present in the vegetation survey of the site. Celtis was present in the pollen assemblages at low abundance (present in one trap at 2.9%) but was not recorded in the vegetation, and therefore possibly represents transport from outside the plot.
5.2. Differentiation of vegetation plots within a forest–Savannah mosaic
Despite their close geographical proximity within the forest–Savannah mosaic, the plots give rise to different palynological assemblages, in both the relative abundances of common taxa and the presence or absence of rarer taxa. The pollen assemblages differ in abundance of dominant, over-producing taxa, such as Poaceae and Melastomataceae/Combretaceae, but there are also differences in the less abundant components of the assemblages such as Erythrophleum suaveolens in the Forest plot, Manilkara obovata in the Transition, and Pterocarpus in the Savannah plot. The differences in pollen assemblage composition reflect the unique vegetation assemblage in each plot. The R-rel values for taxa are often not consistent across plots; although Melastomataceae/Combretaceae is consistently over-represented in the pollen sum, the degree of over-representation varies widely ( and ).
Erythrophleum suaveolens, whilst over-represented in the Forest plot (R-rel = 3.64), is under-represented in the Transition plot (R-rel = 0.39). As there are relatively few individuals in each plot (nine in the Forest and six in the Transition), this discrepancy in representation may be due to factors such as tree location in the plot, wind direction, tree height or openness. Although there are fewer individuals of Erythrophleum suaveolens in the Transition plot, they account for a similar total percentage of the basal area as in the Forest plot, indicating that the Transition plot individuals may be larger – a factor which does not appear to have influenced their representation in the pollen rain.
Terminalia is under-represented in both the Transition and Savannah pollen assemblages, but has a lower R-rel value in the Transition plot (R-rel = 0.34) than in the Savannah plot (R-rel = 0.66). This is despite it being more vegetatively abundant in the Transition plot than it is in the Savannah plot (24 stems in Transition, 23 in Savannah). Terminalia does account for a greater percentage of total stems and has a larger basal area percentage coverage in the Savannah plot than in the Transition plot, however, suggesting that Terminalia trees in the Savannah plot may be larger than those of the Transition plot.
Alchornea is ‘characteristic’ of all plots in this study, as it is present in the majority of traps and occurs at above 3% in at least one trap in each plot. Alchornea is, however, a wind-pollinated taxon that is widely distributed across tropical Africa (Watrin et al. Citation2007). Anemophily, and its prevalence in all plots, means it is not a useful taxon when distinguishing between vegetation types within a Forest–Savannah transitional mosaic.
Poaceae, one of the most abundant taxa in all three plots, does not display an increase in percentage abundance from Forest to Savannah (). Its influx values, however, increase along the gradient with the Forest having an average of 36 grains/cm2/month, the Transition traps 51 grains/cm2/month and the Savannah traps 79 grains/cm2/month. Melastomataceae/Combretaceae pollen shows an increase in percentage abundance along the Forest–Transition–Savannah gradient, but also displays very high influx values in the Savannah plot (an average of 54 grains/cm2/month) compared to the other two plots (an average of 8 grains/cm2/month in the Forest plot, and 9 grains/cm2/month in the Transition). This very high Melastomataceae/Combretaceae influx effectively masks the Poaceae signal in the Savannah plot and accounts for its similarity to the Transition and Forest plots in the percentage data. The absence of a clear differentiating signal from Poaceae percentage abundance in this study is illustrated both by its lack of clear increase from Forest to Savannah (), and by its position in the ordination roughly centrally to all three plots (). The absence of variation in the Poaceae signal differs from the findings of Vincens (Vincens et al. Citation2000) and Ybert (Ybert Citation1975), who both observed a strong increase in the percentage abundance of Poaceae pollen along the Forest–Savannah gradient in Cameroon and Côte d'Ivoire, respectively. The discrepancy between this study and previous studies could be due to the swamping of pollen counts in previous studies by arboreal taxa such as Celtis, and a lack of Melastomataceae/Combretaceae-type pollen. The studies by Vincens (Citation2000) and Ybert (Citation1975) encompass wider vegetational gradients than the plots used in this study, with samples encompassing swamp wet Forest types. Vincens (Citation2000) used soil samples, meaning that their results may be representative of a longer time period than ours. The clear increase in the absolute abundance of Poaceae pollen from Forest to Savannah observed in this study may, however, indicate that concentration data might be able to provide a more accurate representation of grass-dominated pollen assemblages than percentage data alone (Supplemental data).
In this dataset there are 67 pollen taxa whose abundance is low enough (< 3% in any trap) that it would not be informative or practical to include them in a pollen diagram, but whose presence may nevertheless contribute to the separation of the plots palynologically. The differences between the pollen assemblages of the plots are highlighted by the fact that the Forest and Savannah samples form two clearly separate groups in ordination space, with Transition traps overlapping with the Savannah (). There were, however, a variety of pollen taxa which contributed to the spread of the data but which are not recorded in the vegetation plots, including Borassus, Schefflera, Sloanea, Diodia, Trema, Nesogordonia and Pycnanthus, as well as multiple distinctive pollen morphotypes. These taxa may represent extra-plot pollen, or may have been present in the plot but not recorded due to being too small (< 10 cm DBH).
5.3. Pollen and vegetation diversity
In comparison to the diversity of the vegetation plots, the pollen assemblage diversity indices were lower: Forest pollen 2.7 against vegetation 3.1, Transition pollen 2.4 against vegetation 2.8, and Savannah pollen 2.2 against vegetation 2.6. The diversity data show a trend of increasing pollen diversity with increasing vegetation diversity (), with the Forest traps showing less variation than the Transition traps, which in turn showed less than the Savannah traps. The large variability in the diversity of the Savannah plot pollen traps could have been due to a more open canopy, allowing for more extra-plot components to feature in the pollen rain. Statistical tests of this relationship were not attempted due to the small number of vegetation diversity measures (three) available. The positive relationship between vegetation and pollen diversity has been demonstrated in modern pollen traps (Jantz et al. Citation2014), and in lake sediments (dependent on the situation of the lake in question) (Felde et al. Citation2016), although there are difficulties involved with using these data to interpret fossil pollen assemblages due to features of depositional environments that may affect the relationship between pollen and parent vegetation in the fossil record (Odgaard Citation1999).
5.4. Implications for the Lake Bosumtwi fossil pollen record
In Lake Bosumtwi, shifts from Forested to grassland ecosystems have been inferred from high levels (> 55% abundance) of Poaceae in fossil samples (Miller & Gosling Citation2014; Miller et al. Citation2016). If this criterion were applied to the data presented here, just one of the traps would be considered grassland (Transition trap 65).
The palynological over-production of Poaceae likely accounts for the very high percentages of pollen observed during ‘Savannah’ periods of the Bosumtwi record, as opposed to these representing an ecosystem that is more grass dominated and open than the Savannah plot of this study. If these periods were representative of a more grass dominated landscape, it might be expected that Sahelian elements would be observed within these, which is not the case (Miller & Gosling Citation2014). Determining which grass taxa contribute to the signal of sections of the Bosumtwi record that are very high in Poaceae may help to improve the interpretation of the parent vegetation; although Poaceae pollen is very difficult to identify to below the family level using light microscopy, techniques are now being developed which may allow this analysis to be undertaken (Mander et al. Citation2013; Julier et al. Citation2016).
Even with the strong bias towards anemophilous taxa displayed in the fossil record, the Forest stages identified in the Lake Bosumtwi record have higher Moraceae abundances than the traps in this study, indicating that the inference of some form of wooded environment is well justified. However, in the Forest zones of the Lake Bosumtwi record, taxa used to indicate a moist, broadleaf Forest vegetation type include Uapaca, Alchornea and Celtis. Uapaca, in the samples analysed here, is only present in the Savannah plot (although it is not a characteristic taxon of this plot). Alchornea and Celtis are present in the pollen rain of the majority of trap samples from all three plots, at similar abundances to those observed in the Bosumtwi record. Melastomataceae/Combretaceae, along with Poaceae percentages of up to 40%, are used to indicate a moist, rainForest environment in the Bosumtwi record, but here are indicative of the Savannah plot. It is possible, therefore, that the ecosystems characterised in the Bosumtwi record as ‘moist broadleaf Forest’ may represent drier vegetation types (the inferred rainfall of the Bosumtwi Forest zones was 1000–3300 mm/year, whereas the rainfall at Kogyae and within the transitional zone in general is 900–1200 mm/year) (Miller & Gosling Citation2014). The Forest zone may include the transitional mosaic explored here, an observation that could have implications for the reconstruction of past climate change.
Data obtained from an artificial pollen trap (diameter 140 mm) and a lake such as Lake Bosumtwi (radius 4 km) will vary considerably, with the former likely capturing a very local signal (within tens of metres of the trap), but the latter a heavily regional signal (likely 90% or more of regional pollen) (Jacobson & Bradshaw Citation1981; Sugita Citation1994). The individual source areas for the traps in this study are likely to have varied, depending on the structure of the vegetation immediately surrounding them. Traps can, therefore, be considered to capture a ‘snapshot’ of the pollen produced by a specific vegetation type, as opposed to the regional, time-averaged signal captured by large lakes (Kidwell & Flessa Citation1995). The spatial and temporal differences in the pollen signal obtained from traps and lakes should be taken into consideration when interpreting fossil records.
The observation that the Poaceae percentages in this study differ from those of the fossil record is not, alone, an indication that the interpretation of the fossil record needs to be re-examined. Poaceae is wind dispersed, highly productive, and therefore more likely to appear in high percentages in the sediment record as opposed to traps under the canopy, in relation to other entomophilous or zoophilous taxa. When treated alone, Poaceae is an unreliable indictor taxon (Bush Citation2002). It is therefore sensible to use other taxa along with Poaceae to distinguish between vegetation types; the taxa outlined here may help to provide better constraints on the interpretation of transitional zones within pollen records.
6. Conclusions
This work has demonstrated that by using modern pollen traps deployed within vegetation plots, differences can be identified between the pollen assemblages produced by three vegetation types within a Forest–Savannah transitional mosaic landscape. Although there is not a straightforward relationship between pollen and vegetation assemblages, certain taxa can be used to indicate the different vegetation types, such as Erythrophleum suaveolens for the Forest, Manilkara obovata for the Transition, and Pterocarpus and Uapaca for the Savannah vegetation types. These taxa, and many other rarer taxa, contribute to the plots, producing pollen assemblages that can be separated using multivariate methods, and to the biodiversity of the pollen assemblages reflecting that of the vegetation. The plots also differ in their percentage and influx values of Poaceae, with the influx of Poaceae better reflecting the gradient of Forest to Savannah than percentage data, a finding that has implications for the interpretation of the fossil record. Based on the insights gained from the modern pollen data, a re-examination of the fossil pollen record from Lake Bosumtwi may benefit from a lower threshold of Poaceae pollen to categorise an assemblage as being from a Savannah or transitional ecosystem. Depending on other taxa present, this threshold could be as low as 40%. Future high-resolution sampling of the Lake Bosumtwi record, from periods of Transition between Forest and Savannah, may benefit from the results outlined in this study, thereby improving knowledge of how vegetation responds to climate fluctuations in the past and helping to shape predictions of how ecosystems might respond to climate change in the future.
Supplementary_data_1356392.docx
Download MS Word (24.4 KB)Acknowledgements
We would like to thank the Carbon Use Efficiency team, as well as the herbarium of the CSIR-Forestry Research Institute of Ghana (FORIG), for their support and assistance in collecting samples for this study. We also acknowledge the Wildlife Division of the Forestry Commission in Ghana as well as the many field assistants who helped with data collection from the field. We would also like to thank Encarni Montoya and one anonymous reviewer for their constructive feedback.
Disclosure statement
No potential conflict of interest was reported by the authors.
Additional information
Funding
Notes on contributors
Adele C.M. Julier
ADELE JULIER is a PhD researcher at the Open University and a visiting researcher at the University of Amsterdam, working on pollen–vegetation relationships in tropical West Africa. Other research interests include pollen chemistry, floral morphology and stomatal development.
Phillip E. Jardine
PHIL JARDINE is a palynologist with interests in large-scale ecological and biogeographic changes in the plant fossil record, and the development of novel palaeoclimatic proxies based on the chemical signature of pollen grains. He is also interested in the methods used to quantify and model biodiversity, and how they can be best applied to palaeoecological datasets.
Stephen Adu-Bredu
STEPHEN ADU-BREDU is a principal research scientist at the Forestry Research Institute of Ghana (FORIG) of the Council for Scientific and Industrial Research (CSIR), Ghana, and a former Deputy Director of the Institute. He is project partner to the projects ‘Carbon Use Efficiency’ and El Nino’ funded by NERC, and GEM Traits and SOFIA, funded, respectively, by Leverhulme–Royal Society and Royal Society–DFID. Stephen's research interest is on productive ecology of forests and the impact of various anthropogenic activities on forest carbon stock, and his focus is on both artificial (tree plantation) and natural tropical forest.
Angela L. Coe
ANGELA COE is a senior lecturer at the Open University whose research focuses on environmental change, sea-level fluctuations, and the development and application of sequence stratigraphy. Angela currently has research projects on the consequences of global warming during the Toarcian, development of new proxies for marine de-oxygenation, sea-level change from mass flow deposits, and biotic responses to environmental change. She has contributed towards the development of several new proxies for environmental change and the Jurassic geological time scale.
Akwasi Duah-Gyamfi
AKWASI DUAH-GYAMFI is a research scientist at the Forestry Research Institute of Ghana (FORIG) of the Council for Scientific and Industrial Research (CSIR). He is a project team member of the NERC-funded project ‘Carbon Use Efficiency’ being implemented in Ghana. Akwasi's areas of research interest include forest responses to global change, carbon and nutrient cycling, production ecology and biogeochemistry, forest population dynamics and restoration of degraded landscapes.
Wesley T. Fraser
WESLEY FRASER is a senior lecturer in physical geography at Oxford Brookes University, and an organic geochemist specialising in the reconstruction of past ultraviolet (UV) radiation regimes using chemical signatures locked within the walls of spores and pollen. Additional interests include greenhouse gas emissions from vegetation, the variation of UV within the environment and the micrometeorology of wall faces.
Barry H. Lomax
BARRY LOMAX is a lecturer in environmental science at the University of Nottingham. His research focuses on quantifying how the Earth's climate has changed over geologic time, how these changes have influenced the Earth's terrestrial biosphere and how in turn the Earth's terrestrial biosphere has influenced climate. Particular interests include palaeopolyploidy and plant genome size over geological time, plant responses to CO2, and sporopollenin chemistry as a palaeoclimate proxy.
Yadvinder Malhi
YADVINDER MALHI is a professor of ecosystem science at the School of Geography and the Environment at Oxford University. Malhi's research interests centre on interactions between forest ecosystems and the global atmosphere, with a particular focus on their role in global carbon, energy and water cycles, and in understanding how the ecology of natural ecosystems may be shifting in response to global atmospheric change.
Sam Moore
SAM MOORE is a postdoctoral research assistant in tropical carbon dynamics within the Ecosystem Dynamics group of the Environmental Change Institute at the University of Oxford. Sam has a wide range of research interests within the broad area of ecosystem and environmental sciences. To date, most of his research has taken place in the tropics, including areas in South America, Africa and Asia. His PhD research focused on the tropical peatlands of Southeast Asia and the role that these peatlands have in the global carbon cycle.
Kennedy Owusu-Afriyie
KENNEDY OWUSU-AFRIYIE is a research scientist at the CSIR–Forestry Research Institute of Ghana (FORIG). He is a project team member of the NERC-funded project ‘Carbon Use Efficiency’ being implemented in Ghana. Kennedy's research interest is on forests’ response to anthropogenic factors, vegetation dynamics, carbon production and allocation, and fire ecology.
William D. Gosling
WILLIAM GOSLING is an associate professor at the University of Amsterdam. He seeks to place current concerns related to on-going, and projected, climate change into a longer term context by examining multiple aspects of the fossil record. William is an expert in tropical palynology and environmental change during the Quaternary (the last 2.6 million years). However, he works closely with many researchers to apply a range of techniques to gain a comprehensive picture of how environments have changed in the past.
Related Research Data
References
- Aubréville. 1966. Les lisières forêt - savane des régions tropicales | BHL-Europe Portal. Muséum d'histoire naturelle, Laboratoire de Phanérogamie [Internet]. [cited 2016 Sep 25]. Available from: http://www.bhl-europe.eu/bhle-view/bhle%3A10706-a0d254br?language=nl
- Azihou AF, Kakai RG, Bellefontaine R, Sinsin B. 2013. Distribution of tree species along a gallery forest-savanna gradient: patterns, overlaps and ecological thresholds. Journal of Tropical Ecology 29:25–37.
- Beard JS. 1953. The Savanna Vegetation of Northern Tropical America. Ecological Monographs 23:149–215.
- Bengo MD, Maley J. 1991. Analysis of pollen flux on the southern margin of the Gulf of Guinea in the last 135 000 years. Comptes Rendus – Academie des Sciences, Serie II 313:843–849.
- Bush M, Flenley J, Gosling W. 2011. Tropical rainforest responses to climatic change Berlin: Springer Science & Business Media.
- Bush MB. 2002. On the interpretation of fossil Poaceae pollen in the lowland humid neotropics. Palaeogeography, Palaeoclimatology, Palaeoecology 177:5–17.
- Bush MB, Rivera R. 2001. Reproductive ecology and pollen representation among neotropical trees. Global Ecology & Biogeography 10:359–367.
- van Campo M. 1974. Pollen et Spores d'Afrique tropicale Talence: Association des Palynologues de Langue Francaise.
- Cardoso AW, Medina-Vega JA, Malhi Y, Adu-Bredu S, Ametsitsi GKD, Djagbletey G, van Langevelde F, Veenendaal E, Oliveras I. 2016. Winners and losers: tropical forest tree seedling survival across a West African forest–savanna transition. Ecology and Evolution 6:3417–3429.
- Castel DJ. 2012. Spatial analysis of the distribution and abundance patterns of chromolaena odorata in Ghana: an invasion risk assessment. International Journal of Botany 8:127–135.
- Cramer W, Bondeau A, Woodward FI, Prentice IC, Betts RA, Brovkin V, Cox PM, Fisher V, Foley JA, Friend AD, et al. 2001. Global response of terrestrial ecosystem structure and function to CO2 and climate change: results from six dynamic global vegetation models. Global Change Biology 7:357–373.
- Dalibard M, Popescu S-M, Maley J, Baudin F, Melinte-Dobrinescu M-C, Pittet B, Marsset T, Dennielou B, Droz L, Suc J-P. 2014. High-resolution vegetation history of West Africa during the last 145 ka. Geobios 47:183–198.
- Danquah E, Owusu JA. 2015. Distribution of buffaloes in the Kogyae Strict Nature Reserve, Ghana. Applied Research Journal 1:20–26.
- Davis MB. 1963. On the theory of pollen analysis. American Journal of Science 261:897–912.
- Dexter K g., Smart B, Baldauf C, Baker T r., Balinga MPB, Brienen R j. w., Fauset S, Feldpausch T r., Ferreira-Da Silva L, Ilunga Muledi J, et al. 2015. Floristics and biogeography of vegetation in seasonally dry tropical regions. International Forestry Review 17:10–32.
- Dupont LM, Agwu COC. 1992. Latitudinal shifts of forest and savanna in N. W. Africa during the Brunhes chron: further marine palynological results from site M 16415 (9 °N 19 °W). Vegetation History and Archaeobotany 1:163–175.
- Dupont LM, Beug H-J, Stalling H, Tiedemann R. 1989. First palynological results from ODP sites 661 and 658: pollen as climate indicators. Proceedings of the Ocean Drilling Program, Scientific Results 108:93–111.
- Dupont LM, Marret F, Winn K. 1998. Land-sea correlation by means of terrestrial and marine palynomorphs from the equatorial East Atlantic: Phasing of SE trade winds and the oceanic productivity. Palaeogeography, Palaeoclimatology, Palaeoecology 142:51–84.
- Dupont LM, Weinelt M. 1996. Vegetation history of the savanna corridor between the Guinean and the Congolian rain forest during the last 150,000 years. Vegetation History and Archaeobotany 5:273–292.
- El Ghazali GEB, Moore PD. 1998. Modern lowland pollen spectra and contemporary vegetation in the eastern Sahel Vegetation Zone, Sudan. Review of Palaeobotany and Palynology 99:235–246.
- Elenga H, Schwartz D, Vincens A. 1994. Pollen evidence of late Quaternary vegetation and inferred climate changes in Congo. Palaeogeography, Palaeoclimatology, Palaeoecology 109:345–356.
- Felde VA, Peglar SM, Bjune AE, Grytnes J-A, Birks HJB. 2016. Modern pollen–plant richness and diversity relationships exist along a vegetational gradient in southern Norway. The Holocene 26:163–175.
- Frédoux A. 1994. Pollen analysis of a deep-sea core in the Gulf of Guinea: vegetation and climatic changes during the last 225,000 years B.P. Palaeogeography, Palaeoclimatology, Palaeoecology 109:317–330.
- Gajewski K, Lézine A-M, Vincens A, Delestan A, Sawada M. 2002. Modern climate–vegetation–pollen relations in Africa and adjacent areas. Quaternary Science Reviews 21:1611–1631.
- Gautier L, Spichiger R. 2004. The forest-savannah transition in West Africa. In: Biodiversity of West African Forests – An Ecological Atlas of Wood Plant Species Cambridge, MA: CABI; p. 33–40.
- Gorel AP, Fayolle A, Doucet JL. 2015. Ecologie et gestion des espèces multi-usages du genre Erythrophleum (Fabaceae-Caesalpinioideae) en Afrique (synthèse bibliographique). Biotechnologie, Agronomie, Société et Environnement 19:415–429.
- Gosling WD, Mayle FE, Killeen TJ, Siles M, Sanchez L, Boreham S. 2003. A simple and effective methodology for sampling modern pollen rain in tropical environments. The Holocene 13:613–618.
- Gosling WD, Mayle FE, Tate NJ, Killeen TJ. 2005. Modern pollen-rain characteristics of tall terra firme moist evergreen forest, southern Amazonia. Quaternary Research 64:284–297.
- Gosling WD, Mayle FE, Tate NJ, Killeen TJ. 2009. Differentiation between Neotropical rainforest, dry forest, and savannah ecosystems by their modern pollen spectra and implications for the fossil pollen record. Review of Palaeobotany and Palynology 153:70–85.
- Gosling WD, Miller CS, Livingstone DA. 2013. Atlas of the tropical West African pollen flora. Review of Palaeobotany and Palynology 199:1–135.
- Hawthorne W, Jongkind C. 2006. Woody plants of western African forests: A guide to the forest trees, shrubs and lianes from Senegal to Ghana London: Kew Pub.
- Higgins SI, Bond WJ, Combrink H, Craine JM, February EC, Govender N, Lannas K, Moncreiff G, Trollope WSW. 2012. Which traits determine shifts in the abundance of tree species in a fire-prone savanna? Journal of Ecology 100:1400–1410.
- Ibie BF, Yulianti N, Rumbang N, Ibie E. 2016. Central kalimantan high conservation value provincial assessment [Internet]. Climate Policy Initiative; [cited 2017 Feb 7]. Available from: https://climatepolicyinitiative.org/publication/central-kalimantan-high-conservation-value-provincial-assessment/
- Jacobson GL, Bradshaw RHW. 1981. The selection of sites for paleovegetational studies. Quaternary Research 16:80–96.
- Jahns S, Hüls M, Sarnthein M. 1998. Vegetation and climate history of west equatorial Africa based on a marine pollen record off Liberia (site GIK 16776) covering the last 400,000 years. Review of Palaeobotany and Palynology 102:277–288.
- Jantz N, Homeier J, Behling H. 2014. Representativeness of tree diversity in the modern pollen rain of Andean montane forests. Journal of Vegetation Science 25:481–490.
- Jardine PE, Harrington GJ. 2008. The Red Hills Mine palynoflora: a diverse swamp assemblage from the Late Paleocene of Mississippi, U.S.A. Palynology 32:183–204.
- JNCC. 2010. Habitat mosaics and transitions [Internet]. [cited 2017 Feb 7]. Available from: http://jncc.defra.gov.uk/page-2277
- Jones CE, Little RJ. 1983. Handbook of experimental pollination biology. New York: Van Nostrand Reinhold.
- Joyce CB, Simpson M, Casanova M. 2016. Future wet grasslands: ecological implications of climate change. Ecosystem Health and Sustainability 2:e01240.
- Juggins S. 2007. C2 Version 1.5 Software for ecological and palaeoecological data analysis and visualisation Newcastle upon Tyne: Newcastle University.
- Julier A, Gosling W. 2017. Modern pollen types, Ghana. Available from: https://figshare.com/articles/Modern_pollen_types_Ghana_/5240956
- Julier ACM, Jardine PE, Coe AL, Gosling WD, Lomax BH, Fraser WT. 2016. Chemotaxonomy as a tool for interpreting the cryptic diversity of Poaceae pollen. Review of Palaeobotany and Palynology 235:140–147.
- Keen HF, Gosling WD, Hanke F, Miller CS, Montoya E, Valencia BG, Williams JJ. 2014. A statistical sub-sampling tool for extracting vegetation community and diversity information from pollen assemblage data. Palaeogeography, Palaeoclimatology, Palaeoecology 408:48–59.
- Kidwell SM, Flessa KW. 1995. The quality of the fossil record: Populations, species, and communities. Annual Review of Ecology and Systematics 26:269–299.
- Koeberl C, Milkereit B, Overpeck JT, Scholz CA, Amoako PYO, Boamah D, Danuor S, Karp T, Kueck J, Hecky RE, et al. 2007. An international and multidisciplinary drilling project into a young complex impact structure: The 2004 ICDP Bosumtwi Crater Drilling Project – An overview. Meteoritics & Planetary Science 42:483–511.
- Lebamba J, Ngomanda A, Vincens A, Jolly D, Favier C, Elenga H, Bentaleb I. 2009. Central African biomes and forest succession stages derived from modern pollen data and plant functional types. Climate of the Past 5:403–429.
- Lehmann CER, Archibald SA, Hoffmann WA, Bond WJ. 2011. Deciphering the distribution of the savanna biome. New Phytologist 191:197–209.
- Lewis SL, Sonké B, Sunderland T, Begne SK, Lopez-Gonzalez G, Heijden GMF van der, Phillips OL, Affum-Baffoe K, Baker TR, Banin L, et al. 2013. Above-ground biomass and structure of 260 African tropical forests. Philosophical Transactions of the Royal Society B: Biological Sciences 5:368(1605).
- Lézine A-M. 1991. West African paleoclimates during the last climatic cycle inferred from an Atlantic deep-sea pollen record. Quaternary Research 35:456–463.
- Lézine A-M, Edorh TM. 1991. Modern pollen deposition in West African Sudanian environments. Review of Palaeobotany and Palynology 67:41–58.
- Lézine A-M, Vergnaud-Grazzini C. 1993. Evidence of forest extension in west Africa since 22,000 BP: A pollen record from the eastern tropical Atlantic. Quaternary Science Reviews 12:203–210.
- Lézine AM, Watrin J, Vincens A, Hély C. 2009. Are modern pollen data representative of west African vegetation? Review of Palaeobotany and Palynology 156:265–276.
- Lopez-Gonzalez G, Lewis SL, Burkitt M, Phillips OL. 2011. ForestPlots.net: a web application and research tool to manage and analyse tropical forest plot data. Journal of Vegetation Science 22:610–613.
- Maley J. 1991. The African rain forest vegetation and paleoenvironments during the Late Quaternary. Climatic Change 19:79–98.
- Maley J, Brenac P. 1998. Vegetation dynamics, palaeoenvironments and climatic changes in the forests of western Cameroon during the last 28,000 years B.P. Review of Palaeobotany and Palynology 99:157–187.
- Mander L, Li M, Mio W, Fowlkes CC, Punyasena SW. 2013. Classification of grass pollen through the quantitative analysis of surface ornamentation and texture. Proceedings of the Royal Society B: Biological Sciences 280(1770): 20131905.
- Marret F, Kim S-Y, Scourse J. 2013. A 30,000 yr Record of land-ocean interaction in the eastern gulf of Guinea. Quaternary Research 80:1–8.
- Marthews TR, Riutta T, Oliveras Menor I, Urrutia R, Moore S, Metcalfe D, Malhi Y, Phillips O, Huaraca Huasco W, Ruiz Jaén M, et al. 2014. Measuring tropical forest carbon allocation and cycling: A RAINFOR-GEM field manual for intensive census plots (v3.0). [Internet]: Manual, Global Ecosystems Monitoring Network Available from: http://gem.tropicalforests.ox.ac.uk/
- Mayle FE, Langstroth RP, Fisher RA, Meir P. 2007. Long-term forest–savannah dynamics in the Bolivian Amazon: implications for conservation. Philosophical Transactions of the Royal Society B: Biological Sciences 362:291–307.
- Miller CS, Gosling WD. 2014. Quaternary forest associations in lowland tropical West Africa. Quaternary Science Reviews 84:7–25.
- Miller CS, Gosling WD, Kemp DB, Coe AL, Gilmour I. 2016. Drivers of ecosystem and climate change in tropical West Africa over the past ∼540 000 years. Journal of Quaternary Science 31:671–677.
- Morris EK, Caruso T, Buscot F, Fischer M, Hancock C, Maier TS, Meiners T, Müller C, Obermaier E, Prati D, et al. 2014. Choosing and using diversity indices: insights for ecological applications from the German Biodiversity Exploratories. Ecology and Evolution 4:3514–3524.
- Niang I, Ruppel O, Abdrabo MA, Essel A, Lennard C, Padgham J, and Urquhart P. 2014. Africa. In: Barros, V.R., C.B. Field, D.J. Dokken, M.D. Mastrandrea, K.J. Mach, T.E. Bilir, M. Chatterjee, K.L. Ebi, Y.O. Estrada, et al. editors. Climate change 2014: Impacts, adaptation, and vulnerability. Part B: Regional aspects. Contribution of working Group II to the Fifth Assessment Report of the intergovernmental panel on climate change. Cambridge, UK: Cambridge University Press; pp. 1199–1265.
- Novinyo SK, Kossi A, Habou R, Raoufou RA, Dzifa KA, André BB, Ali M, Sokpon N, Kouami K. 2014. Spatial Distribution of Pterocarpus erinaceus Poir. (Fabaceae) Natural Stands in the Sudanian and Sudano-Guinean Zones of West Africa: Gradient Distribution and Productivity Variation across the Five Ecological Zones of Togo. Annual Research & Review in Biology 6:89–102.
- Odgaard BV. 1999. Fossil pollen as a record of past biodiversity. Journal of Biogeography 26:7–17.
- Oksanen J, Guillaume Blanchet F, Kindt R, Legendre P, Minchin PR, O'Hara RB, Simpson GL, Solymos P, Stevens MHH, Wagner H. 2015. Vegan: Community Ecology Package. R Package version 2.2-1. [Internet]. Available from: http://CRAN.R-project.org/package=vegan
- R Core Team. 2016. R: A language and environment for statistical computing Vienna: R Foundation for statistical computing.
- Riollet G, Bonnefille R. 1980. Pollens des savanes d'Afrique orientale Paris: Éd. du Centre national de la recherche scientifique. Paris.
- RStudio. 2012. Boston, MA: RStudio; [cited 2014 Jun 11]. Available from: http://www.rstudio.org/
- Salzmann U, Hoelzmann P, Morczinek I. 2002. Late Quaternary climate and vegetation of the Sudanian Zone of northeast Nigeria. Quaternary Research 58:73–83.
- Sankaran M, Hanan NP, Scholes RJ, Ratnam J, Augustine DJ, Cade BS, Gignoux J, Higgins SI, Le Roux X, Ludwig F, et al. 2005. Determinants of woody cover in African savannas. Nature 438:846–849.
- Schüler L, Hemp A, Behling H. 2014. Relationship between vegetation and modern pollen-rain along an elevational gradient on Kilimanjaro, Tanzania. The Holocene 24:702–713.
- Shanahan T, McKay NP, Hughen KA, Overpeck JT, Otto-Bliesner B, Heil CW, King J, Scholz CA, Peck J. 2015. The time-transgressive termination of the African Humid Period. Nature Geoscience 8:140–144.
- Shi N, Dupont LM. 1997. Vegetation and climatic history of southwest Africa: a marine palynological record of the last 300,000 years. Vegetation History and Archaeobotany 6:117–131.
- Shi N, Schneider R, Beug H-J, Dupont LM. 2001. Southeast trade wind variations during the last 135 kyr: Evidence from pollen spectra in eastern South Atlantic sediments. Earth and Planetary Science Letters 187:311–321.
- Sowunmi MA. 1981. Aspects of Late Quaternary vegetational changes in West Africa. Journal of Biogeography 8:457–474.
- Stockmarr J. 1971. Tablets with Spores used in Absolute Pollen Analysis. Pollen et Spores 13:615–621.
- Sugita S. 1994. Pollen Representation of Vegetation in Quaternary Sediments: Theory and Method in Patchy Vegetation. Journal of Ecology 82:881–897.
- Swaine MD. 1992. Characteristics of dry forest in West Africa and the influence of fire. Journal of Vegetation Science 3:365–374.
- Swaine MD, Hawthorne WD, Orgle TK. 1992. The Effects of Fire Exclusion on Savanna Vegetation at Kpong, Ghana. Biotropica 24:166–172.
- Torello-Raventos M, Feldpausch TR, Veenendaal E, Schrodt F, Saiz G, Domingues TF, Djagbletey G, Ford A, Kemp J, Marimon BS, et al. 2013. On the delineation of tropical vegetation types with an emphasis on forest/savanna transitions. Plant Ecology & Diversity 6:101–137.
- Valencia B. 2014. Pollen counting R script [Internet] Florida Institute of Technology. Available from: https://ecologyofthepast.info/2014/03/21/pollen-count/
- Vallé F, Dupont LM, Leroy SAG, Schefuß E, Wefer G. 2014. Pliocene environmental change in West Africa and the onset of strong NE trade winds (ODP Sites 659 and 658). Palaeogeography, Palaeoclimatology, Palaeoecology 414:403–414.
- Vincens A., Dubois MA, Guillet B, Achoundong G, Buchet G, Kamgang Kabeyene Beyala V, de Namur C, Riera B. 2000. Pollen-rain-vegetation relationships along a forest-savanna transect in southeastern Cameroon. Review of Palaeobotany and Palynology 110:191–208.
- Vincens A, Lezine A-M, Buchet G, Lewden D, Le Thomas A, Agwu C, Azema C, Ballouche A, Baxter A, Bengo M, et al. 2007. African pollen database inventory of tree and shrub pollen types. Review of Palaeobotany and Palynology 145:135–141.
- Watrin J, Lézine AM, Gajewski K, Vincens A. 2007. Pollen–plant–climate relationships in sub-Saharan Africa. Journal of Biogeography 34:489–499.
- Watson L, Dallwitz MJ. 1992. The families of flowering plants: descriptions, illustrations, identification, and information retrieval. Version 19th October 2016 [Internet]. [cited 2017 Jan 15]. Available from: http://delta-intkey.com/angio/www/combreta.htm
- White F. 1983. Vegetation of Africa -- a descriptive memoir to accompany the Unesco/AETFAT/UNSO vegetation map of Africa. Natural Resources Research Report XX. Paris (France): U.N. Educational, Scientific and Cultural Organization.
- Wildlife Department, Accra. 1994. Kogyae Strict Nature Reserve Development and Management Plan Ghana: Wildlife Department, Accra.
- Ybert J-P. 1975. Emissions polliniques actuelles dans la zone du contact forêt-savane en Côte d'Ivoire. Bulletin de la Société Botanique de France 122:251–265.
- Ybert J-P. 1979. Atlas de pollens de Côte d'Ivoire Paris: ORSTOM.