
Abstract
We extracted pollen from historical honeycomb specimens of beeswax to highlight the potential of beeswax as a source for palynological studies. The pollen composition was explored as a proxy for honeybee foraging in the past. Additionally, we wanted to illuminate the potential of the palynological analysis to provenance the specimens. Danish honeycomb samples from the Natural History Museum of Denmark, dating from the late 19th, early twentieth century were processed and analysed for pollen identification. We used Ellenberg values to represent functional traits for the identified taxa and applied these as explanatory variables to study the variation in foraging environment and plant preference of the honeybees. Our results indicate variations of an agricultural landscape, with bees foraging on plants that are high in nutritional value. We found that information gained from palynological analysis of museum samples may be useful in illuminating details of historical apiology. We present our study in light of the importance of environmental biodiversity in Denmark and its vitality for bees as key pollinators in our ecosystem.
1. Introduction
Increase in monoculture crops, change of landscape use and growing urbanisation have been suggested as important factors adding to the distress of native and domesticated bees (Burkle et al. Citation2013; Goulson et al. Citation2015; Lau et al. Citation2019). The resulting decreased biodiversity can impact the seasonal variety of resources that bees require (Park and Nieh Citation2017). Whereas nectar and honeydew serve as an energy source, pollen provides everything else that is needed by the bees: it is the sole source of proteins in addition to minerals and other nutrients (Crane Citation1999; Dreller et al. Citation1999). Limitations in the availability of the floral resources for the honeybees have been found to contribute to colony losses, due to the weakened health of the bees as a consequence of the lack of nutrients in their diet through poor quality pollen (Donkersley et al. Citation2014; Durant Citation2019), causing nutritional stress (Colwell et al. Citation2017) and deficient development (Alburaki et al. Citation2018).
Bees prefer primarily pollen of high nutritional content, creating a selective process in choosing their foraging sources in the environment (Ghosh et al. Citation2020). Therefore, honeybee nutrition is directly linked to the composition of the landscape, as needs are met through a polyfloral diet (Donkersley et al. Citation2014; Alburaki et al. Citation2018). Whereas adult bees need more carbohydrates, proteins are essential for the development of the larvae and young bees (Donkersley et al. Citation2014). Pollen rich in protein is considered to be high quality, and bees in general selectively prefer plants that produce such pollen (Colwell et al. Citation2017). Identifying and reinforcing these plants in the environment can be a key strategy to increase the presence of a variety of floral resources for pollinators (Jones et al. Citation2021).
Using beehive material to study changes in the availability of floral resources in the landscape of the honeybees is promising, as honeybees have a wide foraging range, with ∼3 km as a general estimation (Donkersley et al. Citation2014; Jones et al. Citation2021). In the beehive, pollen is packed as a food storage, as ‘bee bread’ (pollen stores and small amounts of nectar) (Svečnjak et al. Citation2019) in the beeswax combs. Beeswax itself is produced by the worker bees in their wax glands and then chewed to build the combs in the hive, to contain the larvae and stores of honey and pollen (Svečnjak et al. Citation2019). Essentially, wax is the backbone of life in the hive. As pollen is present in the hive as food stores, distributed everywhere by the bees as they move, and as air-born contaminant, there are various ways that pollen enters beeswax. Therefore, quantifying the amount of pollen in beeswax is difficult, further complicated by the fact that beeswax is reused not only by the beekeepers but the bees themselves (Svečnjak et al. Citation2019).
Beeswax has been widely used by humans throughout history (Kritsky Citation2017; Castellano et al. Citation2022). The palynological analysis of honeycomb and beeswax remains from archaeological contexts has provided direct evidence for ancient beekeeping practices (Kvavadze Citation2006; Kvavadze et al. Citation2007; Chichinadze and Kvavadze Citation2013; Roffet-Salque et al. Citation2015; Weinstein-Evron and Chaim Citation2016; Castellano et al. Citation2017, Citation2022). Cultural heritage material containing beeswax (Furnessa Citation1994; Martinelli et al. Citation2018) and resin (Mariotti Lippi and Mercuri Citation1992) has been provenanced through palynology. Within the modern honey industry, pollen from honey (melissopalynology) is used to certify the geographical origin of the honey (Bryant and Jones Citation2001; Ponnuchamy et al. Citation2014; Bodor et al. Citation2021). However, there is a potential archive to be unlocked: many natural history museums hold specimens of beeswax, and such ecofacts are prospective proxies to investigate past environments and honeybee foraging strategies through the pollen they may hold.
In this study, we explore the potential of pollen extracted from historical beeswax from the Natural History Museum of Denmark to study historical honeybee foraging. Adding to the continuous work on honeybees and striving to find solutions to understand their current distress and decline (Neumann and Carreck Citation2010; Burkle et al. Citation2013), the palynological analysis of historical beeswax specimens could be used to explore questions considering the foraging of honeybees and their environmental needs. Therefore, accessing archival or ancient material could potentially be impactful, providing us a window to the past.
Due to local limitations for chemical usage, we experimented with alternative solvent for traditional acetolysis in pollen preparation. Method development was also necessary due to the unique characteristics of beeswax – as a hydrophobic material, traditional pollen preparation protocols do not directly apply for beeswax. After experimenting with modern beeswax, the approach was applied to historical beeswax samples from the Natural History Museum of Denmark. Pollen from these specimens was successfully extracted, prepared and identified. The results are discussed with regard to the diversity of taxa represented in our samples, the applicability of the data for questions considering honeybee nutrition, in addition to environmental diversity, and pollen as a geographical fingerprint to provenance beeswax.
2. Materials and methods
2.1. Samples and characterisation
The samples () were made accessible by the Natural History Museum of Denmark. The specimens had very little context information, mentioning only the collection area (the island of Sjælland in Denmark). The age of the specimens was estimated to be from the late 19th to early twentieth century based on an interpretation of the style of the hand-written labels by the museum. From the four specimens we collected six sub-samples in total, approximately 100 mg each for the palynological analysis.
Figure 1. (A) Beeswax samples from the Natural History Museum of Denmark. The hand-written label gives this assemblage a context of ‘Apis mellifica L. Cell. Regina Sjaelland Frk Holm.Bang. S.’; indicating that they have been collected from Sjælland. Sampled areas of the specimens are marked with yellow circles. (B) Area of Sjælland in Denmark. Source: modified version after Location of Zealand Region by Wikimedia Commons (license CC BY-SA 3.0).
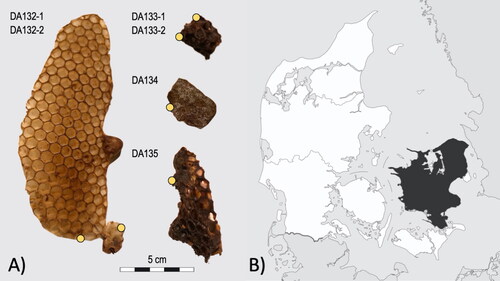
Most of the samples could be identified as beeswax from their honeycomb structure, but one of the samples was a uniform piece, glossy and hard on the surface. Therefore, this sample (DA134) was also analysed with GC–MS (Gas Chromatography–Mass Spectrometry) for material characterisation through chemical identification. Subsequently, the sample DA134 was confirmed to be a mixture of beeswax and propolis (see Supplementary Information for chromatogram and identified compounds). This highlights the need of material characterisation when the material composition is unclear, which can be especially needed with historical samples with incomplete context information. We decided to keep the sample in the study and subjected it to the same preparation procedure as the rest.
2.2. Extraction of pollen grains from beeswax
For palynological analysis the pollen must initially be extracted from the wax and then further cleaned and prepared for morphological identification. In contrast to extracting pollen from sediment samples for instance, collecting the pollen grains from beeswax creates a challenge due to the wax’s unique composition. Beeswax is a complex, hydrophobic material with the primary chemical composition formed of esters, long-chain hydrocarbons and free fatty acids, in addition to aromatics and impurities (Tulloch Citation1970; Pollard and Heron 2008; Lan Citation2019). In order to release the pollen grains from the mass, the beeswax must be removed completely as any layer of wax on the pollen grains may prohibit the efficacy of further preparation methods or identification.
Drawing from two previous studies in extracting pollen for beeswax (Furnessa Citation1994; Martinelli et al. Citation2018) we tested different approaches on modern beeswax to extract and clean pollen grains for identification. Beeswax from a local beekeeper was enriched with modern pollen to ensure our estimation on the preparation protocol. Combinations of acetolysis, glacial acetic acid and KOH were tested after Furnessa (Citation1994) and Martinelli et al. (Citation2018), but none of these protocols delivered satisfactory results for us. A short xylene wash at 65 °C proved to be the most efficient to release the pollen grains from the wax. Xylene is an organic non-polar solvent that effectively dissolved the beeswax in our experiment. Nevertheless, xylene alone as a wash did not clean the pollen grains enough for identification, so the acetolysis treatment was found necessary.
Acid hydrolysis with acetic anhydride (acetolysis) (Erdtman Citation1960) removes organic compounds, such as protoplasm (Lau et al. Citation2019) inside and on the surface of the pollen grains, so that the morphological features of the grain are more visible. Nevertheless, organic compounds such as humic acids are not fully removable via acetolysis, therefore KOH (potassium hydroxide) or NaOH (sodium hydroxide) (Moore et al. Citation1991) are usually applied as additional steps in pollen preparation.
Acetolysis is a mixture of acetic anhydride (CH3CO)2O/Ac2O) and concentrated sulphuric acid (H2SO4) in proportions of 9:1. However, following local laboratory guidelines, the use of acetic anhydride was considered potentially harmful and problematic to dispose of. Therefore, we decided to experiment with other strong available acids to perform acetolysis to our samples. Eventually, we found the combination of glacial acetic acid and sulphuric acid (25%) 1:1 (pH 2) for 10 min at 99 °C to be appropriate. To remove excess organic components inside the pollen grain, NaOH for 10 min at 80 °C instead of KOH was used, before additional washes with ethanol. This preparation method resulted in very clean pollen grains and the protocol was then subsequently applied to the historical beeswax samples investigated in our study. We did not add Lycopodium tablets to our samples, as concentrations were not our goal for the analysis and the spores could complicate the already low amounts of pollen present.
After the chemical pretreatment, the samples were dehydrated and mounted in silicon oil for inspection. The identification of pollen was made with conventional transmitted light microscopy. Pollen can be identified to species-, genus-, type-, group- or family. Pollen identification was based on the identification keys of Fægri and Iversen (Citation1975; Fægri et al. Citation1989) and Beug (Citation2004) and an extensive reference collection held at the Department of Environmental Archaeology and Conservation, Moesgaard Museum. Pollen types are named according to Beug (Citation2004).
2.3. Data analysis
A preliminary indirect ordination (Principal Component Analysis or PCA) of the data was conducted for an overview of the variation of the pollen assemblages. Standard settings in Canoco were used for the PCA (ter Braak Citation1989; Šmilauer and Lepš 2014) and log-transformed percentages were used as response data. A direct ordination (Redundancy Analysis or RDA) was subsequently performed to explore the variation further ().
We used Ellenberg values as explanatory variables in the direct ordination of the data. Ellenberg values are estimations of the ecological needs (for example light and moisture) of plant species in their environment (Vitasović Kosić et al. Citation2017), and also represent the relevance of biodiversity, reproductive traits, pollinator dependence and nectar production of the plants (Tyler et al. Citation2021). The Ellenberg values used in this study were established on central European values (Ellenberg Citation1974, Citation2001).
We composed a list of species representing each pollen type for the Ellenberg values by using literature covering local flora in Denmark. The choice of species was based on their commonness in Denmark and likely appearance on Sjælland following Den nye nordiske flora (Mossberg and Stenberg Citation2005). Species that were mentioned to be rare in Denmark or in the Sjælland area were subsequently excluded, including species that are considered extinct, despite the fact that they may have occurred at the time when the specimens were collected a hundred years ago. An estimated Ellenberg value for a pollen type was based on an average value of the likely dominant species (if 5 or more species in the group) or of all the species included in the type (if <5) (Enevold et al. Citation2019; Birks and John Citation2020). An average of the Ellenberg values of the species was then made to represent the pollen type in the calculation of the community-weighted mean (CWM) of each explanatory variable.
The community-weighted mean (CWM) approach allows the analysis between specific species characteristics (here Ellenberg-values) and the sample characteristics through the community matrix (Zelený Citation2018). We used the computational program Canoco for ordinations that provide the opportunity to test the statistical significance of each explanatory variable through 9999 Monte Carlo permutations (ter Braak and Šmilauer 2012).
3. Results
We extracted clean, identifiable pollen grains from all of our samples (). The pollen count resulted in between 140 and 495 pollen with a mean of 311. The pollen was identified to the plant taxonomic level of 21 species, 32 genera, 16 types, 4 groups and 7 were identified to only family level.
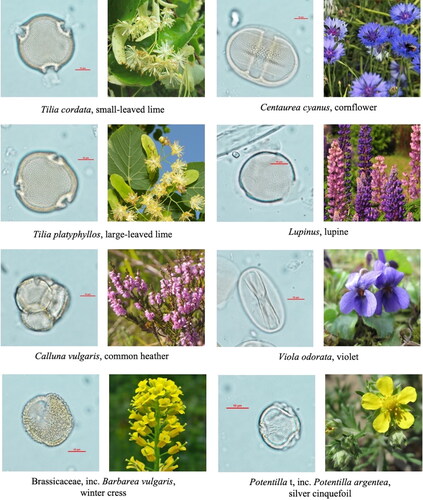
Plate 1. Examples of pollen grains identified from the samples with a corresponding species or a species included in the pollen type.
The samples DA132-1 and DA132-2 both had a relatively high abundance of pollen from Tilia. Some were identified to the species T. platyphyllos (8.5% and 7.5%) and fewer were identified to the species T. cordata (0.4% and 3.5%). The distinction between the two species was based on the difference in pattern size between the two sides of the pollen grain (Beug Citation2004), yet most were only identified to the genus Tilia without further distinction (9.3% and 9.7%). Tilia was the only tree pollen in these two samples, but they both also contained 4% of the pollen identified to the Ligustrum type which includes larger shrubs. The total percentage of pollen from trees and large shrubs was 22.8% and 24.7%. The two samples additionally contained the most pollen from dwarf shrubs among the samples, especially pollen identified to the species Calluna vulgaris (7.1% and 4.4%). On the other hand, the samples contained less pollen from herbs than the other four samples. Nevertheless, it was a relatively high percentage (69.1% and 70.9%). The pollen from herbs could be identified mainly to the genus Lupinus (34.5% and 14.5%) and the species Centaurea cyanus (25.1% and 31.3%).
The samples DA133-1 and DA133-2 had an abundance of tree pollen that was similar to DA132-1 and DA132-2 (17.9% and 21.5%), yet the tree pollen was identified to several different species and genera for example Acer (2.9% and 2.8%), Alnus (3.6% and 0.6%) and Salix (5.7% and 4.3%). These samples contained little pollen from the group of smaller shrubs and within this growth form the samples differed from each other. Sample DA133-1 included pollen identified as the dwarf shrub Calluna vulgaris (2.1%) and the family Rosaceae (2.1%) and sample DA133-2 included pollen identified as Ligustrum type (2.5%). The abundance of pollen from herbs differed slightly (77.9% and 78.2%) from the previous samples. They contained almost the same frequency of pollen from the family Brassicaceae (27.9% and 29.2%) but the differences were more obvious in the rest of the types. The sample DA133-1 included 15.0% of pollen from Centaurea cyanus, whereas DA133-2 only contained 6.5% of pollen from that species. DA133-1 contained mainly pollen identified to the family Fabaceae (12.9%) and a little from a few other types. On the other hand, pollen from a more diverse group of genera like Filipendula (2.5%), Elatine (4.0%), Ranunculus (1.5%), Cornus (3.7%) and Viola (3.4%) was found in DA133-2. Pollen identified to the family Apiaceae was found in both samples (4.3% and 9.2%) as well as pollen identified to Potentilla type (2.1% and 4.3%).
The sample DA134 differs from the rest in containing the lowest percentage of pollen from trees and large shrubs (11.5%), mainly pollen identified to Tilia (6.3%). Dwarf shrubs were represented mainly by Calluna vulgaris (2.4%). Most elevated was the frequency of pollen from Centaurea cyanus (47.6%). The rest of the pollen types were found with relatively low abundances for example Kickxia (4.8%), Hottonia palustris (2.9%) and Elatine (2.2%) or very low abundances for example Senecio t. (1.2%), Apiaceae (1.2%) and Cirsium (0.5%). The total sum of pollen from herbs was altogether the highest between the six samples (85.8%).
The sample DA135 contained a frequency of pollen from trees and large shrubs of 18.8%. It was mainly pollen from the genera Prunus (7.4%) and Salix (3.7%) and with only a few other types like T. platyphyllos and Alnus sparsely represented (1.8% each). The frequency of pollen from herbs was altogether 79.4%. More than half of these were identified to the family Brassicaceae (47.4%) and a relatively low proportion was identified to Centaurea cyanus (14.3%). Other sparsely represented types were Elatine (4.4%), Apiaceae (4.0%) and Cichorium t. (2.6%).
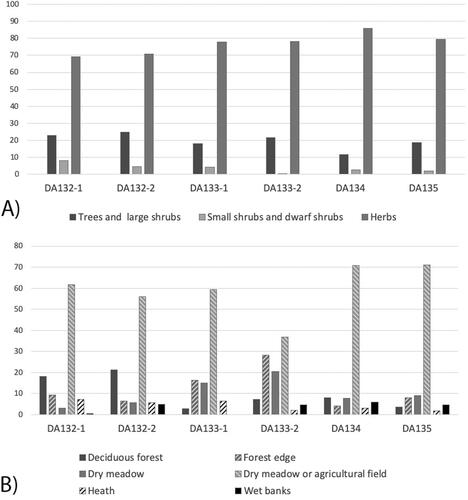
Based on the general ecology of the main species included in the pollen types, some grouping was made for each sample to indicate the biotopes that were likely visited frequently by the bees. Overall, the pollen types present in the wax were mostly representing herbs, with a few trees and shrubs (). This does not vary much between the samples, although sample DA133-1 seems to have an even higher frequency of herbs than the rest. The main biotopes represented in the wax were dry meadow or agricultural fields (). Many weeds that thrive in agricultural fields have migrated from adjacent dry meadows, and therefore it cannot be distinguished which of these two biotopes have been visited for the largest group of herbs. The pollen could have been foraged in either, or from both. The samples D134-1 and DA135-1 had the highest frequency from this group. Herbs that thrive mainly on dry meadow had their highest amount in sample DA133-1 and DA133-2. The same samples had the highest frequency of pollen likely foraged from plants characteristic of forest edges.
Figure 2. (A) Histogram showing growth forms represented in the pollen assemblages. (B) Histogram showing biotopes represented in the pollen assemblages.
All taxa identified from our samples, including flowering periods of the plants with pollen identified to species level are available in Supplementary Information Table S2. The taxa are listed according to identification level in raw counts and in percentages along with some general ecological information for the taxon. The plants identified to species level in our data generally have their flowering period between May and July, corresponding to the spring and early summer foraging season of the bees. The only species abundant in our data was Calluna vulgaris (heather) which has a flowering period of late summer to early autumn, August-September.
The analysis of the variation in the dataset shows the difference in important pollen types between the samples and this difference is visualised via the placement of the sample on the plain of the first two axes of the PCA (). The result of the PCA shows that the main part of the variation between the samples can be visualised in the plane between the first and second axis. The variation seems to gather the samples DA132-1 and DA132-2 on one side of axis 1 and the rest on the other side of axis 1. The most important pollen types are plotted in relation to the samples, showing the pollen types identified to Calluna vulgaris, Primula, Lupinus, Poaceae, T. cordata and T. platyphyllos to be the most important for the placement of DA132-1 and DA132-2 within the plane. On the other side the pollen types identified to Senecio t., Kickxia, Trifolium and Elatine seem to be important to the placement of DA134, the pollen types identified to the family of Brassicaceae seem to be important to the placement of DA133-2 and DA135, and the pollen types identified to Potentilla t., Salix, Acer, Alnus, Rhinanthus gr., Euphrasia, Daucus t., and the family Fabaceae seem to be most important for the placement of DA133-1.
Figure 3. (A) The first and second axis of a PCA including all pollen types as response variables. The total variation is 109.88570. The most important pollen types are plotted in relation to the samples (dark blue arrows). (B) The first and second axis of an RDA including all pollen types as response variables. The most important pollen types are plotted in relation to the samples (dark blue arrows). Six important explanatory variables are shown with light blue arrows.
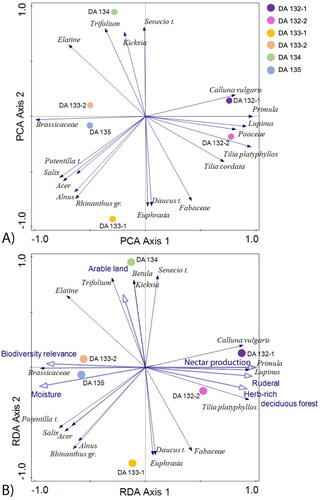
The result of the RDA () suggests some main explanatory variables to be important for this placement. The cumulative variation explained for the dataset (PCA axis 1 and 2) was 69,49 (). The explanatory variables that turned out significant for the explanation of the variation are ruderality, herb rich deciduous forest, and nectar production for DA132-1 and DA132-2, and moisture and biodiversity relevance for the placement of DA133-1 and DA135 (). They each could explain between 26% and 34.4% of the total variation in the dataset. The explanatory variable for arable land did not turn out significant (), yet it could explain 18.7% of the total variation.
Table 1. Summary table of the eigenvalues and explained variation in a PCA based on log-transformed percentages of the total dataset.
Table 2. Explanatory value and significance (<0.05) of six important Ellenberg values.
4. Discussion
These results of the PCA and the RDA in combination suggest characteristics of the dominant biotope visited by the bees for each sample. The visitation could happen because of preference or availability (or a mixture), unfortunately we have not been able to get that kind of information in this survey. Very little information about the site, where the honeycomb was collected from the beehive was available to us. Therefore, we could not infer any conclusion on this matter. However, our findings proposed a reasonable suggestion regarding the significant diversity of foraging habitats. Also, we can get some insight by taking a further look into the most abundant plants represented by the pollen types and the biotopes.
From the types of pollen found Centaurea cyanus (cornflower) was the most abundant and found across all of the samples. Centaurea cyanus is considered a highly rewarding plant for the bees for its nectar and pollen quality, therefore it is a clear favoured source for nutrients (Hicks et al. Citation2016; Radev Citation2019). Cornflowers are common in organic wheat fields, which could indicate that the honeybee colonies were situated in an agricultural landscape.
Another frequent group was Brassicaceae, a family including cruciferous vegetables, which could also indicate cultivated crops. Brassica napus has been cultivated in Denmark for fodder and oil since the middle of the eighteenth century (Brøndegaard Citation1980). Samples DA132-1 and DA132-2 had a large amount of Lupinus of the legume family Fabaceae. Lupinus luteus and Lupinus albus has been cultivated in Denmark for fodder since the 1840s (Brøndegaard Citation1980). Honeybees forage on lupines for their pollen, as the plant does not produce nectar (Fijen et al. Citation2021).
Lime, or linden trees, Tilia (T. cordata and T. platyphyllos) formed one of the largest groups of trees found across all the samples. The insect-pollinated Tilia species is also called the ‘bee tree’ (for their sugary nectar and proteinous pollen) in Europe, and with abundant flowering they provide a good foraging source for bees, especially in the urban landscape: in the parks and flanking avenues (Jacquemart et al. Citation2018; Erichsen et al. Citation2019; Daniels et al. Citation2020).
Bees favour heather (Calluna vulgaris) due to its abundance as a mass-flowering species (Hudewenz and Klein Citation2013) and for its nectar and pollen production (Cucu et al. Citation2022). Heather was abundant in our samples DA132-1 and DA132-2, indicating at least partial heathlands as the foraging landscape represented in these samples. As the flowering period of Calluna vulgaris is August-September, it is important for late summer foraging, when other flowers and especially crop blooms, are no longer available (Mossberg and Stenberg Citation2005; Hudewenz and Klein Citation2013). Heathers are ericaceous shrubs that dominate heathlands, and the loss of these areas has been lately a concern over environmental biodiversity (de la Peña et al. Citation2012).
We found that nectar production is one of the most significant explanatory parameters for some of the pollen assemblages in our survey. Nectar production is a value directly linked to pollinators as their energetic food source (Tyler et al. Citation2021). Plants with a high amount of nectar and pollen of rich nutritional value are chosen first by the bees from their environment (Ahrenfeldt et al. Citation2019; Ghosh et al. Citation2020). From the Ellenberg values, the biodiversity value describes the value which the plant has for other organisms, either as a food source or as shelter, to mention (Tyler et al. Citation2021). Our results indicate that a heterogeneous environment is preferred by historical honeybees, including multiple biotopes. This is again especially important from the viewpoint of seasonal availability – with a combination of early spring to late summer flowering plants, the bees have a more steady access to food sources (Hicks et al. Citation2016; Ghosh et al. Citation2020).
As a protein-rich legume, the farming of lupines may increase in the future, as it could replace some of the land that is extensively used for animal production in agriculture that is considered a big threat to biodiversity (Fijen et al. Citation2021). The increase of pollinator-dependent crops or wildflowers to the affinity of crops attracts more pollinators, therefore also directly leading to higher crop yields (Blaauw et al. Citation2014). This would attract and serve more pollinators and possibly be a step towards a more sustainable synergy between agriculture and apiculture (Nemecek et al. Citation2008; Fijen et al. Citation2021). Mass-flowering crops can also be beneficial to the bees as a close resource, as large foraging distances can be a disadvantage to the performance of the bees (Danner et al. Citation2016). Choosing crops and plants with higher nectar and pollen quality may improve pollination and this is used in beekeeping for commercial value (Ahrenfeldt et al. Citation2019).
An additional scope in our study was to determine the potential of the pollen from the beeswax to provenance the sample. However, our investigation did not yield extensive information on this particular topic. Furthermore, we underline the necessity of material characterisation of historical samples to obviate the possible other sources of pollen in the sample if honeybee foraging or provenance is the target of the study. The presence of additional material could introduce other types of pollen. Nevertheless, despite the sample DA134 being a mixture of propolis (resinous material collected by the bees from trees) and beeswax, surprisingly it did not express more tree-related pollen in comparison to the other samples.
Moreover, as pollen can be present in the hive through multiple pathways (entomophilous vs. anemophilous) not every grain of pollen may be indicative of the bee’s foraging or the provenance. Additionally, beeswax is not homogeneous, and can be of higher density of pollen due to reuse or age, depending on the sampling area of the wax. As can be seen from the RDA (), samples DA133-1 and DA133-2 fall off from each other, despite being taken from the same specimen close to each other. This would highlight the need to take several samples of the wax and acknowledge that one sample may not be representative of the entire information retrievable from one beeswax specimen.
5. Conclusions
In this study we were successful in extracting and identifying a relatively high number of pollen grains from historical beeswax from the Natural History Museum of Denmark. Our analysis indicates that the most abundant taxa are preferred by the bees likely due to their high quality in nectar and pollen. The results suggest a heterogeneous landscape of open, flowering fields, ruderals and trees for the bees to feed on, and to choose from.
Beeswax specimens in natural history museum collections may be an untapped source for palynology and apiology, especially looking into the change of foraging behaviour of honeybees over time. The identification of floral visitation by pollinators provides important information about the preference of historical honeybees, contributing to the understanding of biodiversity and its conservation. As a future prospect, we aim to compare a larger sample set of historical beeswax to modern samples from known environments in order to study possible shifts in foraging strategies and preferences.
Supplemental Material
Download PDF (1.3 MB)Acknowledgements
We would like to thank Lars Vilhelmsen from the Natural History Museum of Denmark for providing access to the beeswax samples.
Disclosure statement
No potential conflict of interest was reported by the author(s).
Additional information
Funding
References
- Ahrenfeldt EJ, Sigsgaard L, Hansted L, Jensen AC, Toldam-Andersen TB. 2019. Forage quality and quantity affect red mason bees and honeybees differently in flowers of strawberry varieties. Entomologia Experimentalis et Applicata. 167(8):763–773.
- Alburaki M, Gregorc A, Adamczyk J, Stewart SD. 2018. Insights on pollen diversity of honey bee (Apis mellifera L.) colonies located in various agricultural landscapes. The Southwestern Naturalist. 63(1):49–58.
- Beug HJ. 2004. Leitfaden der Pollenbestimmung für Mitteleuropa und angrenzende Gebiete. München: Pfeil.
- Birks H, John B. 2020. Reflections on the use of ecological attributes and traits in quaternary botany. Frontiers in Ecology and Evolution. 8:166.
- Blaauw BR, Isaacs R, Clough Y, Clough Y. 2014. Flower plantings increase wild bee abundance and the pollination services provided to a pollination‐dependent crop. Journal of Applied Ecology. 51 (4):890–898.
- Bodor Z, Kovacs Z, Benedek C, Hitka G, Behling H. 2021. Origin identification of Hungarian honey using melissopalynology, physicochemical analysis, and near infrared spectroscopy. Molecules. 26(23):7274.
- Brøndegaard VJ. 1980. Folk og Flora. Dansk Etnobotanik. Bind 1-4. Denmark: Rosenkilde og Bagger.
- Bryant VM, Jr, Jones GD. 2001. The r‐values of honey: pollen coefficients. Palynology. 25(1):11–28.
- Burkle LA, Marlin JC, Knight TM. 2013. Plant–pollinator interactions over 120 years: loss of species, co-occurrence, and function. Science. 339(6127):1611–1615.
- Castellano L, Pini R, Furlanetto G, Valoti F. 2022. Palynological insights into the ecology and economy of ancient bee-products. In: Wallace-Hare D, editors. New approaches to the archaeology of beekeeping. Oxford: Archaeopress.
- Castellano L, Ravazzi C, Furlanetto G, Pini R, Saliu F, Lasagni M, Orlandi M, Perego R, Degano I, Valoti F, et al. 2017. Charred honeycombs discovered in Iron Age Northern Italy. A new light on boat beekeeping and bee pollination in pre-modern world. Journal of Archaeological Science. 83:26–40.
- Chichinadze M, Kvavadze E. 2013. Pollen and non-pollen palynomorphs in organic residue from the hoard of ancient Vani (western Georgia). Journal of Archaeological Science. 40(5):2237–2253.
- Colwell MJ, Williams GR, Evans RC, Shutler D. 2017. Honey bee-collected pollen in agro-ecosystems reveals diet diversity, diet quality, and pesticide exposure. Ecology and Evolution. 7(18):7243–7253.
- Crane E. 1999. The world history of beekeeping and honey hunting. Abingdon, Oxford: Routledge, Inc.
- Cucu A-A, Baci G-M, Cucu A-B, Dezsi Ş, Lujerdean C, Hegeduş IC, Bobiş O, Moise AR, Dezmirean DS. 2022. Calluna vulgaris as a valuable source of bioactive compounds: exploring its phytochemical profile, biological activities and apitherapeutic potential. Plants. 11(15):1993.
- Daniels B, Jedamski J, Ottermanns R, Ross-Nickoll M. 2020. A “plan bee” for cities: pollinator diversity and plant-pollinator interactions in urban green spaces. PLoS One. 15(7):e0235492.
- Danner N, Molitor A, Schiele S, Härtel S, Steffan-Dewenter I. 2016. Season and landscape composition affect pollen foraging distances and habitat use of Honey bees. Ecological Applications. 26(6):1920–1929.
- de la Peña E, Van De Velde H, Lens L, Bonte D. 2012. Soil conditions in natural, declining and restored heathlands influence plant–pollinator interactions of Calluna vulgaris. Restoration Ecology. 20(5):603–611.
- Donkersley P, Rhodes G, Pickup RW, Jones KC, Wilson K. 2014. Honeybee nutrition is linked to landscape composition. Ecology and Evolution. 4(21):4195–4206.
- Dreller C, Page R, Fondrk M. 1999. Regulation of pollen foraging in honeybee colonies: effects of young brood, stored pollen, and empty space. Behavioral Ecology and Sociobiology. 45(3–4):227–233.
- Durant JL. 2019. Where have all the flowers gone? Honey bee declines and exclusions from floral resources. Journal of Rural Studies. 65:161–171.
- Ellenberg H. 1974. Zeigerwerte der Gefäßpflanzen Mitteleuropas. Scripta Geobotanica. 9:1–97.
- Ellenberg H, Weber HE, Düll R, Wirth V, Werner W. 2001. Zeigerwerte von Pflanzen in Mitteleuropa (in German with English summary). Scripta Geobotanica. 18:5–262.
- Enevold R, Rasmussen P, Løvschal M, Olsen J, Vad Odgaard B. 2019. Circumstantial evidence of non-pollen palynomorph palaeoecology: a 5,500 year NPP record from forest hollow sediments compared to pollen and macrofossil inferred palaeoenvironments. Vegetation History and Archaeobotany. 28(2):105–121.
- Erdtman G. 1960. The acetolysis method: a revised description. Svensk Botanisk Tidskrift. 54(4):561–564.
- Erichsen EO, Wolff K, Hansen OK. 2019. Genetic and clonal structures of the tree species Tilia cordata mill. in remnants of ancient forests in Denmark. Population Ecology. 61(3):243–255.
- Fægri K, Iversen J. 1975. Textbook of pollen analysis. P.J.Schmidts Bogtrykkeri A/S Vojens. Copenhagen (Denmark): Munksgaard.
- Fægri K, Iversen J, Kaland PE, Krzywinski K. 1989. Textbook of pollen analysis. 4th ed. Chichester: Wiley.
- Fijen TPM, Morra E, Kleijn D. 2021. Pollination increases white and narrow-leaved lupin protein yields but not all crop visitors contribute to pollination. Agriculture, Ecosystems & Environment. 313:107386.
- Furnessa CA. 1994. The extraction and identification of pollen from a beeswax statue. Grana. 33(1):49–52.
- Ghosh S, Jeon H, Jung C. 2020. Foraging behaviour and preference of pollen sources by honey bee (Apis mellifera) relative to protein contents. Journal of Ecology and Environment. 44(1):4.
- Goulson D, Nicholls E, Botías C, Rotheray EL. 2015. Bee declines driven by combined stress from parasites, pesticides, and lack of flowers. Science. 347(6229):1255957.
- Hicks DM, Ouvrard P, Baldock KCR, Baude M, Goddard MA, Kunin WE, Mitschunas N, Memmott J, Morse H, Nikolitsi M, et al. 2016. Food for pollinators: quantifying the nectar and pollen resources of urban flower meadows. PLoS One. 11(6):e0158117.
- Hudewenz A, Klein AM. 2013. Competition between honey bees and wild bees and the role of nesting resources in a nature reserve. Journal of Insect Conservation. 17(6):1275–1283.
- Jacquemart A-L, Moquet L, Ouvrard P, Quetin-Leclercq J, Hérent M-F, Quinet M. 2018. Tilia trees: toxic or valuable resources for pollinators? Apidologie. 49 (5):538–550.
- Jones L, Brennan GL, Lowe A, Creer S, Ford CR, de Vere N. 2021. Shifts in honeybee foraging reveal historical changes in floral resources. Communications Biology. 4 (1):37.
- Kritsky G. 2017. Beekeeping from antiquity through the middle ages. Annual Review of Entomology. 62(1):249–264.
- Kvavadze E. 2006. The use of fossilized honey for paleoecological reconstruction: a palynological study of archeological material from Georgia. Paleontological Journal. 40(S5):S595–S603.
- Kvavadze E, Gambashidze I, Mindiashvili G, Gogochuri G. 2007. The first find in southern Georgia of fossil honey from the Bronze Age, based on palynological data. Vegetation History and Archaeobotany. 16(5):399–404.
- Lan Y. 2019. Waxes. In: Melton L, Shahidi F, Varelis P, editors. Encyclopedia of food chemistry. New York: Academic Press; p. 312–316.
- Lau P, Bryant V, Ellis JD, Huang ZY, Sullivan J, Schmehl DR, Cabrera AR, Rangel J. 2019. Seasonal variation of pollen collected by honey bees (Apis mellifera) in developed areas across four regions in the United States. PLoS One. 14(6):e0217294.
- Mariotti Lippi M, Mercuri A. 1992. Palynology of a resin from an Egyptian coffin of the second century B.C. Review of Palaeobotany and Palynology. 71(1–4):207–218.
- Martinelli E, Castelletti L, Oberli F, Maggioni C, Tinner W. 2018. Pollen from beeswax as a geographical origin indicator of the medieval Evangelistary cover ‘Pace di Chiavenna’, Northern Italy. Palynology. 43(3):507–516.
- Moore PD, Webb JA, Collinson ME. 1991. Pollen analysis. Osney Mead, Oxford, United Kingdom: Blackwell Scientific Publications.
- Mossberg B, Stenberg L. 2005. Den nye nordiske flora. 1. udgave. Kbh: Gyldendal.
- Nemecek T, von Richthofen J-S, Dubois G, Casta P, Charles R, Pahl H. 2008. Environmental impacts of introducing grain legumes into European crop rotations. European Journal of Agronomy. 28(3):380–393.
- Neumann P, Carreck NL. 2010. Honey bee colony losses. Journal of Apicultural Research. 49(1):1–6.
- Park B, Nieh JC. 2017. Seasonal trends in honey bee pollen foraging revealed through DNA barcoding of bee-collected pollen. Insectes Sociaux. 64(3):425–437.
- Pollard MA, Heron C. 1996. Archaeological chemistry. Cambridge (The United Kingdom): The Royal Society of Chemistry.
- Ponnuchamy R, Bonhomme V, Prasad S, Das L, Patel P, Gaucherel C, Pragasam A, Anupama K. 2014. Honey pollen: using melissopalynology to understand foraging preferences of bees in tropical south India. PLoS One. 9(7):e101618.
- Radev Z. 2019. The impact of protein content of pollen on its collecting by honey bees (Apis mellifera L.). Modern Concepts & Developments in Agronomy. 4(2):MCDA.000583.2019.
- Roffet-Salque M, Regert M, Evershed RP, Outram AK, Cramp LJ, Decavallas O, Dunne J, Gerbault P, Mileto S, Mirabaud S, Pääkkönen M. 2015. Widespread exploitation of the honeybee by early Neolithic farmers. Nature. 527:226–230.
- Šmilauer P, Lepš J, 2014. Multivariate analysis of ecological data using Canoco 5. 2nd ed. Cambridge: Cambridge University Press.
- Svečnjak L, Chesson LA, Gallina A, Maia M, Martinello M, Mutinelli F, Necati Muz M, Nunes FM, Saucy F, Tipple BJ, et al. 2019. Standard methods for Apis mellifera beeswax research. Journal of Apicultural Research. 58(2):1–108.
- ter Braak CJF. 1989. CANOCO—an extension of DECORANA to analyze species-environment relationships. Hydrobiologia. 184(3):169–170.
- ter Braak CJF, Šmilauer P. 2012. Canoco reference manual and user’s guide: software for ordination, version 5.0. Ithaca (NY): Microcomputer Power.
- Tulloch AP. 1970. The composition of beeswax and other waxes secreted by insects. Lipids. 5(2):247–258.
- Tyler T, Herbertsson L, Olofsson J, Olsson PA. 2021. Ecological indicator and traits values for Swedish vascular plants. Ecological Indicators. 120:106923.
- Vitasović Kosić I, Juračak J, Łuczaj Ł. 2017. Using Ellenberg-Pignatti values to estimate habitat preferences of wild food and medicinal plants: an example from northeastern Istria (Croatia). Journal of Ethnobiology and Ethnomedicine. 13(1):31.
- Weinstein-Evron M, Chaim S. 2016. Palynological investigations of tenth- to early ninth-century BCE beehives from Tel Rehov, Jordan Valley, northern Israel. Palynology. 40(3):289–301.
- Zelený D. 2018. Which results of the standard test for community-weighted mean approach are too optimistic? Journal of Vegetation Science. 29(6):953–966.