
ABSTRACT
Ibuprofen (IBU) and diclofenac (DCF) are non-steroidal anti-inflammatory pharmaceuticals. They are frequently detected in wastewater and in the environment. Due to their harmful effect on aquatic organisms, new methods should be developed to enhance their removal from wastewater. One efficient wastewater treatment process is ozonation. In this study the fate of IBU and DCF during ozonation was investigated. Transformation products were identified with liquid chromatography (LC) coupled to an ion trap mass spectrometer (MS) and a quadrupole time-of-flight MS. Also, gas chromatography – mass spectrometry was used in order to investigate the presence of more volatile transformation products than those detected with LC-MS. Ten different products could be identified for IBU, including four isomers of hydroxylated IBU. Six were conclusively identified with authentic standards. For DCF, 14 different products could be identified of which four were isomers of hydroxylated DCF. Three products were identified with authentic standards. IBU, DCF and the major ozonation products were quantified with LC coupled to a triple quadrupole MS. Both IBU and DCF can be efficiently be transformed via ozonation. Only 20% of IBU is left after 30 min, while 10 min is required to transform DCF to the same extent. The major product formed during the ozonation of IBU was IBU with an additional ketone group, while the major product formed from DCF was 4ʹ-OH-DCF.
Introduction
Ibuprofen (IBU) and Diclofenac (DCF) belong to the group of non-steroidal anti-inflammatory pharmaceuticals. IBU is the most commonly used anti-inflammatory pharmaceutical in Finland (Fimea Citation2019). DCF is not as commonly used, however it is of interest because it has been added to the first watch list of the European Union, indicating its potential negative impact on the environment (European Commission Citation2012). The structures of IBU and DCF are similar, both consist of a carboxylic acid group connected to an aromatic ring. DCF contains two aromatic ring connected via an amine group and two chlorine atoms. Both IBU and DCF undergo almost complete metabolization in humans (Mazaleuskaya Citation2015; Stierlin Citation1979), however a small percentage of the administered dose of both compounds enter the wastewater treatment plants (WWTPs) unmetabolized. Both compounds can also be administered as a gel, leading to the unmetabolized compound being washed off (Vieno Citation2014). Because the conventional wastewater treatment plants are unable to completely transform these pharmaceuticals, they inevitably enter the environment.
The concentrations of IBU and DCF in seawater varies between low ng/L and μg/L depending on e.g. the distance from WWTP discharge points (Gaw Citation2014). In the environment, IBU shows a cyto-genotoxic effect on zebra mussel hemocytes at environmentally relevant concentrations (Parolini Citation2011) and inhibits the photosynthesis of the algae Navicula sp (Ding Citation2017). DCF on the other hand has exhibited a high toxicity toward certain species, such as vultures (Oaks Citation2004), mussels (Mezzelani Citation2016), trout (Triebskorn Citation2004), frogs (Melvin Citation2016) and zebrafish (Feito Citation2012).
IBU and DCF are easily transformed in WWTPs; between 64% and 99% of IBU and between 45% and 75% of DCF is removed in conventional WWTPs (Yang Citation2017). This does not necessarily mean that the toxicity is removed. The environmental transformation products of DCF can be more toxic than DCF (Diniz Citation2015; Schmitt-Jansen Citation2007). Also, the products of IBU and DCF which are formed during advanced wastewater treatment can be more toxic than the parent compounds (Quero-Pastor Citation2014; Wang Citation2015). For DCF, some specific transformation products, such as the nitrified product NO2-DCF (, Osorio Citation2016), the photo-transformation product 2-[(2-chlorophenyl) amino] benzaldehyde (Schulze Citation2010) and the quinone imine 5-QI-DCF (, Shen Citation1999) have been proven to be more toxic than DCF.
Due to the high consumption of IBU and the high toxicity of DCF, it is important to improve the removal of these pharmaceuticals from wastewater. For this purpose, advanced oxidation methods are needed. Several methods have been studied for the removal of IBU and DCF, for example photolysis (Iovino et al. Citation2016; Paredes Citation2018), plasma oxidation (Banaschik Citation2015; Dobrin Citation2013) and ozonation (Margot Citation2013; Quero-Pastor et al. Citation2014). Of these methods, ozonation is the most efficient at transforming DCF, although the mineralization is poor (Aziz Citation2017).
During ozonation, ozone is generated from molecular oxygen. The ozone molecules may react directly with organic compounds, or indirectly with water to form radicals such as hydroxyl radicals. The radicals can unselectively react with organic compounds. Both IBU and DCF react mainly via indirect ozonation. The most common product formed from both pharmaceuticals are hydroxylated products (Coelho Citation2009; Huang Citation2015). During advanced oxidation treatment, decarboxylation and the oxidation of alcohol groups to ketone groups are also common (Hartmann Citation2008; Huang et al. Citation2015; Monteagudo Citation2018; Neves Citation2012; Szabó Citation2011; Vione Citation2011; Yu Citation2013; Zhao Citation2018).
While ozonation of both IBU and DCF has been studied qualitatively, typically only the major products have been identified. Further, the exact structures of the products have not been determined. In this study, high resolution mass spectrometry and comparison with authentic standards were used to conclusively identify the transformation products. Most studies on the transformation products of pharmaceuticals only identify one isomer of each transformation product, but it is important to know the exact structures of all the isomers if one wants to draw conclusions not only for the studied compounds, but also for other pharmaceuticals with similar structures. Often, the mass spectra of isomers are too similar to each other to be used to distinguish between them, so comparison with authentic standards are necessary. Correctly identifying the exact structures of all the products also assists in creating a more accurate ozonation pathway. Another point to consider is the possibility that different isomers can also have different toxicities (Kaushik Citation2007; Preuss Citation2006).
The transformation products should not only be identified, but also quantified, in order to compare the stability of the products to the stability of the original pharmaceutical. Very few studies have quantified the products formed, due to the difficulty in identifying products and the absence of commercially available standards for pharmaceutical transformation products. In this study, the concentrations of the major IBU and DCF products were determined and the effect of the chemical structure on the reactions was studied by comparing the products formed during the ozonation of the two pharmaceuticals.
Materials and methods
Materials
DCF was purchased from Sigma Aldrich and IBU was purchased from Sigma Life Science. The
hydroxylated products and 1-OXO-Ibuprofen were purchased from Toronto research chemicals
(Canada). All commercial standards used in this study were of analytical grade. NO2-DCF was
synthesized at Åbo Akademi. Ozone was produced in situ using Nano ozonator. The water used in the
LC-MS analysis was purified using a Millipore Simplicity 185 system (Millipore S.A.S., Molsheim,
France). The acetonitrile used in the LC-MS analysis was of LC-MS grade and was obtained from
Fisher scientific. Ammonium formate was obtained from Fischer Scientific and formic acid was
obtained from Sigma-Aldrich.
Ozonation experiments
The ozonation experiments were conducted according to (Saeid et al. Citation2018) in a double jacket glass reactor having a 1000 ml capacity. The reactor was connected to an ozone generator (Absolute Ozone, Nano model, Canada) and the gas was continuously dispersed to the liquid using a 7 µm disperser placed the bottom of the reactor. The ozone was produced from oxygen at a concentration of 60 mg/L of gas. The gas flow rate of oxygen was 450 mL/min and the flow rate of N2 was 2.5 mL/min during the ozonation of IBU and the gas flow rate of oxygen was 108.5 mL/min and the flow rate of N2 was 1.5 mL/min during the ozonation of DCF. The initial concentration of IBU and DCF were 10 mg/L and 30 mg/L, respectively. The high concentration s of pharmaceuticals used in this study was necessary due to the low concentrations of products which are formed. The reactor temperature was kept at 20 °C and reaction time was 3 h for IBU and 10 min for DCF and samples were withdrawn at appropriate intervals. Due to the low solubility of IBU and DCF in water, stock solutions were prepared in ethanol and 10 mL of the stock solutions were added to the reactor to give final concentrations of 10 and 30 mg/L for IBU and DCF, respectively.
The impact of PH on the ozonation process has been studied in our earlier publication (Saeid Citation2018). The initial pH of the solution is approximately 5, and during the ozonation it decreases to 3. An addition of NaOH to keep pH at 7 or higher was found to decrease the degradation rate. Moreover, it is recommended to add as little unnecessary chemicals to the water as possible.
Product identification
In order to identify the products formed during the ozonation of IBU and DCF, an Agilent 1100 LC/MSD ion trap mass spectrometer equipped with an electrospray ionization (ESI) source was used in full scan and automatic MS5 scan modes. The instrument was operated in both positive and negative modes. Nitrogen was used as drying gas and argon was used as collision gas. The drying gas was held at 8 L/min and heated to 350 °C. The nebulizer pressure was set to 40 psi. The scan range was set to 50–600 m/z. Further details are presented in Table S1 in supplementary information. The chromatographic separation was performed using an Agilent 1100 binary pump equipped with a vacuum degasser, an autosampler, a thermostatted column oven set to 30 °C, a Waters Atlantis T3 C18 column (2.1 × 100 mm, 3 μm) and a variable wavelength detector set to 229 nm for the analysis of IBU and 254 for the analysis of DCF. The eluents were 0.1% formic acid in water (A) and 0.1% formic acid in acetonitrile (B). Initially the composition was held at 0% (B) for 1 min, then the composition was increased linearly to 30% (B) over 9 min. The composition was further increased linearly to 95% (B) over 14 min. The eluent composition was returned to the initial conditions over the next 1 min and given 10 min for equilibration. The flow rate was 0.3 ml/min and the injection volume was 30 μL. The draw speed was 100 μL/min and the eject speed was 100 μL/min.
The DCF samples were analyzed with high resolution mass spectrometry. High resolution mass spectra (HRMS) were obtained using a Bruker Daltonics micrOTOF quadrupole and time-of-flight mass spectrometer equipped with an ESI source. The instrument was operated in full scan mode. Argon was used as drying gas and collision gas. Further details are presented in Table S1 in supplementary information. The chromatographic separation was performed using an Agilent 1200 binary pump equipped with a vacuum degasser, an autosampler, a thermostatted column oven and a diode array detector. The column and chromatographic method were the same as for the ion trap method.
The IBU samples were further analyzed with GC-MS. An aliquot (10 ml) of samples taken after ozonation were freeze-dried, reconstituted with pyridine, silylated with HMDS and ClTMS and filtered through a 0.2 μm PTFE filter. The samples were analyzed by using an Agilent Technologies 7890A gas chromatograph with a 5875 C Series inert XL EI/CI MSD Triple-Axis Detector (GC–MS). One microliter samples were injected (splitless) using an injector 7683B Series (Agilent Technology). For the separation, a HP-5 MS column was used with helium as the carrier gas at the flow rate of 1 mL/min. The GC temperature program was as follows: 4 min at 50 °C increased to 300 °C at 10 °C min and held for 5 min. The total runtime was 34 min.
Product identification workflow
Initially, the samples were analyzed using an ion trap mass spectrometer operating in auto MS5 mode. The mass spectra for all the major peaks in the UV chromatogram were investigated. Since IBU was likely to transform into products which might be detected with GC-MS, but not LC-MS, IBU samples were also analyzed with GC-MS. The results were compared to previously published result. Some of the products were available as commercial standards. They were purchased and MRM methods were developed in order to confirm the structures of the products. The DCF products were further analyzed using QToF mass spectrometry in order to obtain high resolution mass spectra (HRMS). For previously unidentified products, the likely fragmentation patterns of potential products were determined and compared with the experimentally obtained results. The confidence level of the products were assigned based on Schymanski et al. (Citation2014). The compounds were divided into five confidence levels. Level one represents compounds whose structures were confirmed with reference standards or NMR analysis. Level two represents probable structures based on matching the mass spectra with literature or database searches (level 2a) or when no other structure fits the observed fragmentation pattern (level 2b). Level three represents tentative candidates for which the exact structure remains speculative, for example if more than one isomer is possible. Level four represents compounds for which only unequivocal molecular formulas exist. Level five represent compounds whose structures and formulas were unknown, but who have an exact mass of interest.
Quantification of IBU and DCF
IBU and DCF were quantified using LC-UV. For IBU, chromatographic separations were performed using an Agilent 1100 quaternary pump equipped with a vacuum degasser, an autosampler, a thermostatted column oven, a diode array detector set at 214 nm and an Ultra Techsphere ODS C18 column (250 mm × 4.6 mm, 5 μm). The mobile phase consisted of a 70:30 mixture of methanol and 0.5% phosphoric acid (pH: 1.8), the flow rate was 1 mL/min and the injection volume was 20 μL. For DCF the LC system was similar, except a binary pump and a variable wavelength detector was used. The chromatographic separation was performed using a Waters Atlantis T3 C18 column (2.1 × 100 mm, 3 μm) with a pre-column made from the same material. The eluents were 0.1% formic acid in water (A) and 0.1% formic acid in acetonitrile (B). Initially the composition was held at 30% (B) for 2 min, then the composition was increased linearly to 95% (B) over 8 min. The eluent composition was held at 95% (B) for 1 min before being returned to the initial conditions over the next 0.1 min and given 8.9 min for equilibration. The flow rate was 0.3 ml/min. The injection volume was 30 μL. The detector was set to 254 nm. For quantification a seven-point calibration curve was prepared in water by diluting the stock solution. The ozonated samples were injected without any further sample preparation. Details concerning the method validation are presented in supporting information.
Product quantification
Due to the low concentrations of the transformation products, the products of IBU and DCF were quantified using an Agilent 6460 triple quadrupole mass spectrometer operating in multiple reaction monitoring (MRM) mode rather than LC-UV, because LC-MS provided higher sensitivity and specificity than LC-UV would have. The mass spectrometer was equipped with an Agilent Jet Spray electrospray ionization (ESI) source. Both positive and negative ionization mode for the analysis, depending on the propertied of the products. The transitions used are presented in Table S2 and S3 in supporting information. The chromatographic separation was performed using an Agilent 1290 binary pump equipped with a vacuum degasser, an autosampler, a thermostatted column oven set to 30 °C, and a Waters xbrigde C18 column (2.1 × 50 mm, 3 μm). For the IBU method, the eluents used were 0.1% formic acid in water (A) and 0.1% formic acid in acetonitrile (B). The composition was initially held at 5% (B) for 0.5 min followed by a linear increase to 95% (B) over 3 min. The eluent composition was held at 95% (B) for 0.5 min before being returned to the initial conditions over the next 0.1 min and given 1.4 min for equilibration. For the DCF method, the eluents used were 10 mM ammonium formate in water (A) and acetonitrile (B). Initially, the composition was held at 10% (B) for 0.5 min, followed by a linear increase to 30% (B) over 2.5 min and a further increase to 95% (B) over 1 min. The eluent composition was then held at 95% (B) for 1 min before being returned to the initial conditions over the next 0.1 min and given 1.4 min for equilibration. The flow rate in both methods were 0.4 ml/min. The injection volume was 10 μL. The internal standard method was used for quantification by adding 50 µL of deuterated internal standard (100 ng/mL) to 450 µL of sample. The final concentration of the internal standard was 10 ng/mL. The quantification was performed using a ten-point calibration curve prepared in water. Details concerning the method validation are presented in supplementary information.
Results
Identification of IBU transformation products
In advanced oxidation treatment, IBU is transformed via hydroxylation (Caviglioli Citation2002; Chakma Citation2016; Choina Citation2013, da Silva Citation2014; Illés Citation2013; Li Citation2014; Madhavan Citation2010; Méndez-Arriaga Citation2010; Michael Citation2014; Paul Citation2014; Skoumal Citation2009; Sun Citation2013; Xiang Citation2016; Huang et al. Citation2015). However, only the structure of one isomer (1-OH-IBU) has been confirmed with a standard (Caviglioli et al. Citation2002). In our study, the structures of 1-OH-IBU, 2-OH-IBU and α-OH-IBU () were confirmed using authentic standards. Thus, they could be identified at confidence level 1 based on the criteria outlined in section 2.4. Also, a fourth hydroxylated isomer (OH-IBU) was detected (). Because more than one position was possible for the OH group, the confidence level of OH-IBU was 3.
Table 1. IBU and detected IBU oxidation products
Table 2. DCF and identified DCF products
In addition to the monohydroxylated products, two hydroxyl groups may be added to IBU (Chakma and Moholkar Citation2016, da Silva Citation2014; Illés et al. Citation2013; Li et al. Citation2014; Madhavan, Grieser, and Ashokkumar Citation2010; Sun, Zeng, and Lemley Citation2013; Xiang, Fang, and Shang Citation2016). In our study one isomer of this product (di-OH-IBU, ) could be detected. Since more than one position was possible, di-OH-IBU had confidence level 3.
The hydroxylated IBU product can be further oxidized to a ketone (Caviglioli et al. Citation2002; Choina et al. Citation2013). In our study, the position of the ketone was confirmed using 1-OXO-IBU as a standard (, confidence level 1).
IBU can undergo decarboxylatation, leading to the formation of 1-ethyl-4-isobutylbenzene with an additional OH group (Caviglioli et al. Citation2002; Chakma and Moholkar Citation2016; Choina et al. Citation2013; Huang et al. Citation2015; Illés et al. Citation2013; Iovino Citation2016; Li et al. Citation2014; Loaiza-Ambuudi Citation2013; Méndez-Arriaga, Esplugas, and Giménez Citation2010; Michael et al. Citation2014; Skoumal et al. Citation2009; Sun, Zeng, and Lemley Citation2013; Szabó et al. Citation2011). This product was detected in our study, but the position of the OH-group was unknown; it might be either in an aliphatic position, as in the OH-IBU isomers, or on the aromatic ring, thus the confidence level was 3. One possible isomer is presented in (TP178).
A product with the molecular formula C12H16O has previously been detected (Caviglioli et al. Citation2002; Chakma and Moholkar Citation2016; Choina et al. Citation2013; Huang et al. Citation2015; Illés et al. Citation2013; Iovino et al. Citation2016; Li et al. Citation2014; Loaiza-Ambuludi et al. Citation2013; Madhavan, Grieser, and Ashokkumar Citation2010; Méndez-Arriaga, Esplugas, and Giménez Citation2010; Michael et al. Citation2014; Skoumal et al. Citation2009; Sun, Zeng, and Lemley Citation2013; Szabó et al. Citation2011). In our study, the main fragments obtained via LC-MS were m/z = 151 and m/z = 119 which correspond to the loss of CH3CO and C4H9 respectively. This indicated that the isobutyl group remained intact in the product, the carboxylic acid group had been removed and a ketone or aldehyde group had been added. One possible structure of the product is presented in (TP176) and had confidence level 3.
Another previously published and tentatively identified product is TP190 (, Caviglioli et al. Citation2002). In this work, the structure of the product was confirmed with a standard, leading to the structure confidence level 1.
TP166 has previously been detected (da Silva Citation2014). The position of the hydroxyl group and the acid groups could not be determined in our study, leading to the confidence level 3. One possible isomer is presented in .
TP134 has previously been detected during advanced oxidation treatments (Chakma and Moholkar Citation2016, da Silva Citation2014; Illés et al. Citation2013; Li et al. Citation2014; Madhavan, Grieser, and Ashokkumar Citation2010; Michael et al. Citation2014; Skoumal et al. Citation2009; Xiang, Fang, and Shang Citation2016) including ozonation (Huang et al. Citation2015). The position of the aldehyde group and the acid groups could not be determined in our study, leading to the confidence level 3. One possible isomer is presented in .
The GC-MS analysis of the ozonated samples revealed a product with an M+ = 263. The fragmentation pattern of the product indicates that the product had been formed via the loss of a CH3 group (TP192, ). The structure of this compound was confirmed using a standard (, confidence level 1). Another isomer of this compound was also detected (confidence level 3).
Quantification of IBU transformation products
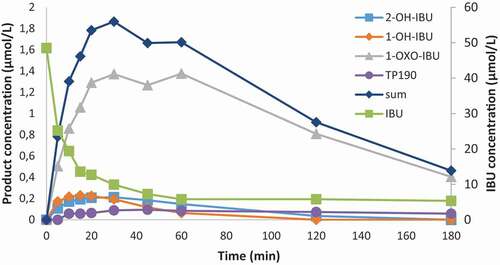
Authentic standards were obtained for the main IBU products (1-OH-IBU, 2-OH-IBU, α-OH-IBU, 1-OXO-IBU and TP190) and they were quantified using a QqQ MS operating in MRM mode. The two main isomers of OH-IBU (1-OH-IBU and 2-OH-IBU) were formed simultaneously, but 1-OH-IBU was transformed faster than 2-OH-IBU (). The highest concentrations of 1-OH-IBU and 2-OH-IBU accounted for 0.5% and 0.4% of the initial concentration of IBU, respectively. The 1-OH-IBU isomer was further oxidized to 1-OXO-IBU, the main product formed during the ozonation of IBU. The maximum concentration appeared after 60 minutes, after which the concentration started to decrease (), and at that point accounted for only 3% of the initial concentration of IBU. Only one sample contained α-OH-IBU at a concentration of 5 µg/L. In the other samples, the concentration was below the limit of quantification. The concentration of TP190 increased to a maximum in 45 minutes (0.2% of the initial concentration of IBU), after which the concentration slowly started to decrease (). The sum of concentrations of the major products accounted for less than 5% of the transformed IBU. It was likely that a significant amount of IBU was transformed e.g. via decarboxylation to smaller, more polar compounds which could not be detected by LC-MS.
Figure 1. The ozonation of IBU and the transformation of the main products.
Identification of DCF transformation products
The products arising from the ozonation of DCF were analyzed with LC- ion trap MS and LC-QToF MS. A total of 15 different transformation products were identified ().
Previously published DCF oxidation products
Hydroxylated products of DCF are formed via several oxidation processes (Hofmann Citation2007; Monteagudo et al. Citation2018; Yu et al. Citation2013), however the position of the hydroxyl group is rarely specified. In this work, two major hydroxylated products (5-OH-DCF and 4ʹ-OH-DCF, ) were observed with the accurate masses 310.0016 (error 7 ppm) and 310.0021 (error 5 ppm) in negative mode. The structures of the isomers were confirmed using authentic standards, leading to the confidence level 1.
The hydroxylation is usually followed by the formation of a quinone-imine product (Banaschik Citation2018; Coelho et al. Citation2009; Yu et al. Citation2013; Zhao et al. Citation2018). In our study, one quinone imine product was formed with the accurate mass 307.9904 (error 7 ppm) in negative mode. Based on the mass spectrometric data it was not possible to determine which isomer was formed, however, because 5-OH-DCF and 4ʹOH-DCF were the most abundant isomers of DCF, it was likely that the isomer QI-DCF () detected was formed from one of them (confidence level 3).
Products with two hydroxyl groups (TP328a) have been reported (Coelho et al. Citation2009; Yu et al. Citation2013). In our study, the accurate mass of TP328a was 325.9995 (error 2 ppm) in negative mode. The major hydroxylated isomers of DCF were 4ʹ-OH-DCF and 5-OH-DCF and consequently TP328a was likely hydroxylated in both the 4ʹ and 5 positions. However, since also other isomers were possible, the structure had the confidence level 3. One possible isomer is presented in .
TP282 has previously been detected as a product formed from DCF during sonolysis (Monteagudo et al. Citation2018). In our study, the accurate mass of TP282 was 279.9927 (error 1.1 ppm) in negative mode. The product was formed via decarboxylation of DCF. The confidence level of the structure was 2b, since no other isomers were possible.
TP178 was formed via the breaking of one of the C-N bonds and the addition of an OH group. The structure had the confidence level 3, since the position of the OH group was unknown. TP178 has previously been detected (Banaschik et al. Citation2018; Coelho et al. Citation2009; Hartmann et al. Citation2008; Monteagudo et al. Citation2018; Yu et al. Citation2013).
Previously unpublished DCF products
TP326 had [M-H]− = 324. The major fragments were m/z = 280, corresponding to the loss of a COOH group and m/z = 244 corresponding to a loss of a COOH group and a Cl atom. This product was likely the quinone imine product formed from DCF with an additional OH group. Both the position of the quinone imine and the OH group were unknown, leading to the confidence level 3. One possible isomer is presented in .
TP302 had [M-H]− = 299.9823, which corresponded to the formula C12H8Cl2NO4 with an error of 3 ppm. This product had consequently lost two carbon atoms and gained four oxygen atoms. The positions of three of the OH groups were most likely 4ʹ, 5 and 1 (confidence level 3). No fragments of this products were detected. possible isomer is presented in .
TP328b had [M + H]+ = 328 and a fragment with m/z = 300, indicating the loss of a CO group. The isotope ratio indicated that both chlorine atoms were still present. The retention time of TP328b (3.9 min) was significantly shorter than the retention time of DCF (20 min), indicating a loss of aromaticity. One likely structure for this product would be formed via the direct ozonation of one of the aromatic rings. It was not clear which ring was cleaved. A possible structure is presented in (confidence level 3).
TP298 had [M-H]− = 296 and a fragment with m/z = 260, indicating the loss of HCl. The product had a peak at m/z = 298 with an abundance of approximately 60% of the [M-H]− peak, indicating that both of the chlorine atoms were still present. The structure of the product was similar to TP282, but with an additional OH group. The position of the OH group was unknown (confidence level 3). One possible isomer is presented in .
TP296 had [M + H]+ = 296 and fragments with m/z = 278, corresponding to the loss of an OH group, m/z = 250, corresponding to the loss of a COOH group and m/z = 215, corresponding to the loss of a COOH group and a Cl atom. TP296 was likely the quinone imine formed from TP298. The position of the quinone imine was unknown (confidence level 3). One possible isomer is presented in .
Due to previously published results it was speculated that NO2-DCF might be produced during the experiments (Osorio et al. Citation2016). NO2-DCF was synthesized and a quantification method was developed. NO2-DCF only produced two transitions. The main transition for NO2-DCF (339 -> 295) was used for quantification and the other transition (339 -> 35) were used to confirm the occurrence of the product in ozonated mixtures. The ratios of the areas of the qualitative peaks to the quantitative peak was 0.068 in the standard and 0.073 in the ozonated samples. The retention time in the standard sample was 1.85 min in both standard samples and ozonated samples, which indicates the presence of NO2-DCF in the ozonated samples (, confidence level 1)
Quantification of DCF transformation products
Two hydroxylated isomers of DCF (4ʹ-OH-DCF and 5-OH-DCF) were purchased and NO2-DCF was synthesized. These standards were used to develop a quantification method. In 10 minutes, 80% of DCF was transformed. The first product to be formed was NO2-DCF. The maximum concentration was observed after one minute, and after that the concentration started to decrease. The maximum concentration of NO2-DCF corresponded to 3.5% of the initial concentration of DCF. The first of the OH-DCF isomers to be formed was 4ʹ-OH-DCF. The maximum concentration was observed after 4 minutes, and after that the concentration remained stable. The maximum concertation of 4ʹ-OH-DCF corresponded to 8.5% of the initial concentration of DCF. The second OH-DCF isomer, 5-OH-DCF was formed more slowly than 4ʹ-OH-DCF. The maximum concentration of 5-OH-DCF appeared after 10 minutes while the maximum concentration of 4ʹ-OH-DCF appeared after 4 minutes. The concentration of 5-OH-DCF was still increasing at the end of the experiment. The maximum concertation of 4ʹ-OH-DCF corresponded to 7.5% of the initial concentration of DCF. The sum of the concentration the DCF products only added up to 20% of the transformed DCF. This indicated that a significant amount of DCF was transformed into other products, such as QI-DCF and small carboxylic acids.
Discussion
Transformation pathways
The main isomer of OH-IBU: 1-OH-IBU was oxidized further to 1-OXO-IBU. One of the mono-hydroxylated IBU products were further transformed to diOH-IBU. Based on the obtained results, it was not possible to conclusively determine the transformation pathway, since there were many possibilities for how the products could be formed. For example, TP166 could be formed from IBU, TP192, TP178 or TP134. In general, IBU was transformed via oxidation and decarboxylation. Oxidation leads to the addition of hydroxyl groups and the oxidation of hydroxyl groups to ketone groups. The products could be further oxidized to carboxylic acids. The hydroxyl groups were added mainly to the aliphatic positions. Based on these results, a transformation pathway was suggested as shown in ().
Figure 2. The ozonation of DCF and the transformation of the main products.
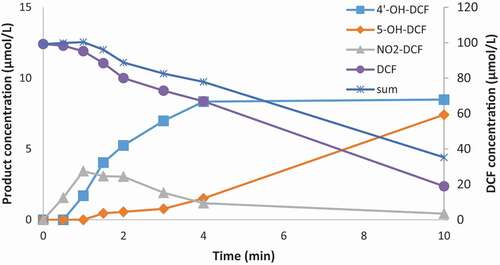
Figure 3. Suggested ozonation pathway for IBU.
A suggested transformation pathway of DCF is displayed in (). DCF was transformed via the addition of hydroxyl groups and the further oxidation to quinone imine. DCF was decarboxylated and the bond aromatic ring was broken. The bond between nitrogen and the aromatic ring was also broken.
Figure 4. Suggested ozonation pathway for DCF.
Comparison of IBU and DCF ozonation reactions
The reaction of ozone with IBU was slower than that of DCF: 80% of DCF transformed in 10 minutes, while 80% of IBU transformed in 30 minutes (). The most common ozonation reaction for both DCF and IBU was the addition of an OH group. The position to which the OH group was added differs between the two compounds. In DCF, the OH group was preferentially added to one of the aromatic rings, while in IBU the OH group was added to an aliphatic carbon. This could be explained by the structural differences between the compounds. The most significant differences between the structures of DCF and IBU is the presence of a nitrogen atom and two chlorine atoms in DCF.
Both IBU and DCF underwent decarboxylation reactions. However, only DCF underwent another (further) bond-breaking reaction, namely the breakage of the bond between the nitrogen and the aromatic ring.
During ozonation of both DCF and IBU, OH groups were oxidized to keto-groups. For IBU, this reaction took place on an aliphatic carbon. For DCF, this reaction occurred for a phenolic OH group, resulting in the formation of quinone imine structures.
A nitrated product of DCF was detected, which was probably formed from a reaction between DCF and nitric acid. Nitric acid was present in the reaction due to the presence of nitrogen gas in the feed gas used during the ozonation, but no nitrated product was detected for IBU.
The detected transformation products account for only a small part of the ozonated compounds: 20% for DCF and 5% for IBU. This indicates that both compounds were further transformed into compounds which cannot be identified with analytical methods used in this study. This probably includes small carboxylic acids and carbon dioxide. The presence of a UV-absorbing peak without retention and which does not give a response in the MS was indicative of this hypothesis.
Conclusions
Both ibuprofen and diclofenac were easily transformed during ozonation treatment. The concentration of IBU decreased by 80% in 30 min, while the concentration of DCF decreased by 80% in 10 minutes. Both pharmaceuticals were transformed via hydroxylation, decarboxylation, and the oxidation of hydroxyl groups to form ketones. The main products formed for both pharmaceuticals involved the addition of a ketone group or a hydroxyl group. Additionally, DCF was transformed via the breaking of C-N bonds and breaking of one of the aromatic rings. In total, 12 ozonation products and were identified for IBU and 14 for DCF.
For IBU, three hydroxylated products and a product with an additional ketone group were quantified. The quantified products accounted for 5% of the initial amount of IBU and the main main product, 1-OXO-IBU, accounted for 3%. For DCF, one nitrated and two hydroxylated products were quantified, in total 20% of the initial amount of DCF. The main products, 4ʹ-OH-DCF and 5-OH-DCF both accounted for around 8% of the initial concentration. This indicated that ozonation not only efficiently transforms the pharmaceuticals, but also the primary products are further transformed. Future studies should quantify additional transformation products, including smaller products such as short-chain carboxylic acids, in order to better understand the ozonation of these pharmaceuticals.
Acknowledgments
This work was supported by Svenska Litteratursällskapet (SLS) under grant 2037; Victoriastiftelsen; and Stiftelsen för Åbo Akademi.
Additional information
Funding
References
- Aziz, K. H. H., H. Miessner, S. Muelle, D. Kalass, D. Moeller, I. Khorshid, and M.A.M. Rashid. 2017. “Degradation of Pharmaceutical Diclofenac and Ibuprofen in Aqueous Solution, a Direct Comparison of Ozonation, Photocatalysis, and Non-thermal Plasma.” Chemical Engineering Journal 313:1033–41. doi: https://doi.org/10.1016/j.cej.2016.10.137.
- Banaschik, R., H. Jablonowski, P. J. Bednarski, and J.F. Kolb. 2018. “Degradation and Intermediates of Diclofenac as Instructive Example for Decomposition of Recalcitrant Pharmaceuticals by Hydroxyl Radicals Generated with Pulsed Corona Plasma in Water.” Journal of Hazardous Materials 342:651–60. doi: https://doi.org/10.1016/j.jhazmat.2017.08.058.
- Banaschik, R., P. Lukes, H. Jablonowski, M.U. Hammer, K-D. Weltmann, and J.F. Kolb. 2015. “Potential of Pulsed Corona Discharges Generated in Water for the Degradation of Persistent Pharmaceutical Residues.” Water Research 84:127–35. doi: https://doi.org/10.1016/j.watres.2015.07.018.
- Caviglioli, G. P., Valeria, P. Brunella, B. Gaetano, B. Gaetano, B. Gaetano, and B. Gaetano. 2002. “Identification of Degradation Products of Ibuprofen Arising from Oxidative and Thermal Treatments.” Journal of Pharmaceutical and Biomedical Analysis 30:499–509. doi: https://doi.org/10.1016/s0731-7085(02)00400-4.
- Chakma, S., and V. S. Moholkar. 2016. “Investigations in Sono-enzymatic Degradation of Ibuprofen.” Ultrasonics Sonochemistry 29:485–94. doi: https://doi.org/10.1016/j.ultsonch.2015.11.002.
- Choina, J., H. Kosslick, C. Fischer, G. U. Flechsig, L. Frunza, and A. Schulz. 2013. “Photocatalytic Decomposition of Pharmaceutical Ibuprofen Pollutions in Water over Titania Catalyst.” Applied Catalysis. B, Environmental 129:589–98. doi: https://doi.org/10.1016/j.apcatb.2012.09.053.
- Coelho, A. D., C. Sans, A. Agüera, M.J. Gómez, S. Esplugas, and M. Dezotti. 2009. “Effects of Ozone Pre-treatment on Diclofenac: Intermediates, Biodegradability and Toxicity Assessment.” Science of the Total Environment 407:3572–78. doi: https://doi.org/10.1016/j.scitotenv.2009.01.013.
- da Silva, J. C. C., Teodoro, J. A. R., Afonso, J. J. C., Aquino, S. F., Augusti, R. 2014. ”Photolysis and photocatalysis of ibuprofen in aqueous medium: characterization of by-products via liquid chromatography coupled to high-resolution mass spectrometry and assessment of their toxicities against Artemia Salina.” Journal of mass spectrometry, 49:145-153. doi: https://doi.org/10.1002/jms.3320
- Ding, T., M. Yang, J. Zhang, B. Yang, K. Lin, J. Li, and J. Gan. 2017. “Toxicity, Degradation and Metabolic Fate of Ibuprofen on Freshwater Diatom Navicula Sp.” Journal of Hazardous Materials 330:127–34. doi: https://doi.org/10.1016/j.jhazmat.2017.02.004.
- Diniz, M. S., R. Salgado, V. J. Pereira, G. Carvalho, A. Oehmen, M. A. M. Reis, and J. P. Noronha. 2015. “”Ecotoxicity of Ketoprofen, Diclofenac, Atenolol and Their Photolysis Byproducts in Zebrafish (Danio Rerio).” Science of the Total Environment 505:282–89. doi: https://doi.org/10.1016/j.scitotenv.2014.09.103.
- Dobrin, D., C. Bradu, M. Magureanu, N.B. Mandache, and V.I. Parvulescu. 2013. “Degradation of Diclofenac in Water Using a Pulsed Corona Discharge.” Chemical Engineering Journal 234:389–96. doi: https://doi.org/10.1016/j.cej.2013.08.114.
- European Commission. 2012. European Commission Proposal for a Directive of the European Parliament and of the Council Amending Directives 2000/60/EC and 2008/105/EC as Regards Priority Substances in the Field of Water Policy European Environment Agency. 35.
- Feito, R., Y. Valcárcel, and M. Catalá. 2012. “Biomarker Assessment of Toxicity with Miniaturised Bioassays: Diclofenac as a Case Study.” Ecotoxicology 21:289–96. doi: https://doi.org/10.1007/s10646-011-0790-2
- Fimea, Finnish Medicines Agency and Social Insurance Institution. 2019. Finnish Statistics on Medicines 2018 http://urn.fi/URN:NBN:fi-fe2019123149481
- Gaw, S., K. V. Thomas, and T. H. Hutchinson. 2014. “Sources, Impacts and Trends of Pharmaceuticals in the Marine and Coastal Environment.” Philosophical Transactions of the Royal Society B: Biological Sciences 369 (1656): 20130572. doi:https://doi.org/10.1098/rstb.2013.0572.
- Hartmann, J., P. Bartels, U. Mau, M. Witter, W. v. Tümpling, J. Hofmann, and E. Nietzschmann. 2008. “Degradation of the Drug Diclofenac in Water by Sonolysis in Presence of Catalysts.” Chemosphere 70:453–61. doi: https://doi.org/10.1016/j.chemosphere.2007.06.063.
- Hofmann, J., U. Freier, M. Wecks, and S. Hohmann. 2007. “Degradation of Diclofenac in Water by Heterogeneous Catalytic Oxidation with H2O2.” Applied Catalysis. B, Environmental 70:447–51. doi: https://doi.org/10.1016/j.apcatb.2005.11.023.
- Huang, H., G. Liu, W. Lv, K. Yao, Y. Kang, F. Li, and L. Lin. 2015. “Ozone-Oxidation Products of Ibuprofen and Toxicity Analysis in Simulated Drinking Water Drug.” Metabolism & Toxicology 6 (3). doi:https://doi.org/10.4172/2157-7609.1000181.
- Illés, E, E. Takács, A. Dombi, K. Gajda-Schrantz, G. Rácz, K. Gonter, and L. Wojnárovits. 2013. “Hydroxyl Radical Induced Degradation of Ibuprofen.” Science of the Total Environment 447:286–92. doi: https://doi.org/10.1016/j.scitotenv.2013.01.007.
- Iovino, P., Chianese, S., Canzano, S., Prisciandaro, M., Musmarra, D. 2016. “Ibuprofen photodegradation in aqueous solutions.” Environmental science and pollution research, 23: 22993–23004. doi:https://doi.org/10.1007/s11356-016-7339-0
- Kaushik, P., and G. Kaushik. 2007. “An Assessment of Structure and Toxicity Correlation Inorganochlorine Pesticides.” Journal of Hazardous Materials 143:102–11. doi: https://doi.org/10.1016/j.jhazmat.2006.08.073.
- Li, X., Y. Wang, S. Yuan, Z. Li, B. Wang, J. Huang, S. Deng, and G. Yu. 2014. “Degradation of the Anti-inflammatory Drug Ibuprofen by Electro-peroxone Process.” Water Research 63:81–93. doi: https://doi.org/10.1016/j.watres.2014.06.009.
- Loaiza-Ambuludi, S., M. Panizza, N. Oturan, A. Özcan, and M. A. Oturan. 2013. “Electro-Fenton Degradation of Anti-inflammatory Drug Ibuprofen in Hydroorganic Medium.” Journal of Electroanalytical Chemistry 702:31–36. doi: https://doi.org/10.1016/j.jelechem.2013.05.006.
- Madhavan, J., F. Grieser, and M. Ashokkumar. 2010. “Combined Advanced Oxidation Processes for the Synergistic Degradation of Ibuprofen in Aqueous Environments.” Journal of Hazardous Materials 178 (1–3): 202–08. doi:https://doi.org/10.1016/j.jhazmat.2010.01.064.
- Margot, J., C. Kienle, A. Magnet, M. Weil, L. Rossi, L. Felippe De Alencastro, C. Abegglen, D. Thonney, N. Chèvre, M. Schärer, et al. 2013. “Treatment of Micropollutants in Municipal Wastewater: Ozone or Powdered Activated Carbon?” Science of the Total Environment 461-462:480–98. doi: https://doi.org/10.1016/j.scitotenv.2013.05.034.
- Mazaleuskaya, L. L., K. N. Thekena, L Gong, C. F. Thorn, G. A. FitzGerald, R. B. Altman, and T. E. Klein. 2015. “PharmGKB Summary: Ibuprofen Pathways.” Pharmacogenetics and Genomics 25 (2): 96–106. doi:https://doi.org/10.1097/FPC.0000000000000113.
- Melvin, S. D. 2016. “Oxidative Stress, Energy Storage, and Swimming Performance of Limnodynastes Peronii Tadpoles Exposed to a Sub-lethal Pharmaceutical Mixture Throughout Development.” Chemosphere 150:790–97. doi: https://doi.org/10.1016/j.chemosphere.2015.09.034.
- Méndez-Arriaga, F., S. Esplugas, and J. Giménez. 2010. “Degradation of the Emerging Contaminant Ibuprofen in Water by photo-Fenton.” Water Research 44 (2): 589–95. doi:https://doi.org/10.1016/j.watres.2009.07.009
- Mezzelani, M., S. Gorbi, Z. Da Ros, D. Fattorini, G. d’Errico, M. Milan, L. Bargelloni, and F. Regoli. 2016. “Ecotoxicological Potential of Non-steroidal Anti-inflammatory Drugs (Nsaids) in Marine Organisms: Bioavailability, Biomarkers and Natural Occurrence in Mytilus Galloprovincialis.” Marine Environmental Research 121:31–39. doi: https://doi.org/10.1016/j.marenvres.2016.03.005
- Michael, I., A. Achilleos, D. Lambropoulou, V. Osorio Torrens, S. Pérez, M. Petrović, D. Barceló, and D. Fatta-Kassinos. 2014. “Proposed Transformation Pathway and Evolution Profile of Diclofenac and Ibuprofen Transformation Products during (Sono)photocatalysis.” Applied Catalysis. B, Environmental 147:1015–27. doi: https://doi.org/10.1016/j.apcatb.2013.10.035.
- Monteagudo, J. M., H. El-Taliawy, A. Durán, G. Caro, and K. Bester. 2018. “Sono-activated Persulfate Oxidation of Diclofenac: Degradation, Kinetics, Pathway and Contribution of the Different Radicals Involved.” Journal of Hazardous Materials 357:457–65. doi: https://doi.org/10.1016/j.jhazmat.2018.06.031.
- Neves, C. M. B., M. M. Q. Simões, M. R. M. Domíngues, I. C. M. S. Santos, M. G. Neves, F. A. A. Paz, A. M. S. Silva, and J. A. S. Cavaleiro. 2012. “Oxidation of Diclofenac Catalyzed by Manganese Porphyrins: Synthesis of Novel Diclofenac Derivatives.” RSC Advances 2:7427–38. doi: https://doi.org/10.1039/C2RA20801F.
- Oaks, J. L., M. Gilbert, M. Z. Virani, R. T. Watson, C.U. Meteyer, B. A. Rideout, H. L. Shivaprasad, S. Ahmed, M. Jamshed, I. Chaudhry, et al. 2004. “Diclofenac Residues as the Cause of Vulture Population Decline in Pakistan.” Nature 427:630–33. doi: https://doi.org/10.1038/nature02317.
- Osorio, V., J. Sanchís, J.L. Abad, A. Ginebreda, M. Farré, S. Pérez, and D. Barceló. 2016. “Investigating the Formation and Toxicity of Nitrogen Transformation Products of Diclofenac and Sulfamethoxazole in Wastewater Treatment Plants.” Journal of Hazardous Materials 309:157–64. doi: https://doi.org/10.1016/j.jhazmat.2016.02.013.
- Paredes, L., F. Omil, J.M. Lema, and M. Carballa. 2018. “What Happens with Organic Micropollutants during UV Disinfection in WWTPs? A Global Perspective from Laboratory to full-scale.„ Journal of Hazardous Materials, 342:670–78. doi:https://doi.org/10.1016/j.jhazmat.2017.08.075
- Parolini, M., A. Binelli, and A. Provini. 2011. “”Chronic Effects Induced by Ibuprofen on the Freshwater Bivalve Dreissena Polymorpha.” Ecotoxicology and Environmental Safety 74 (6): 1586–94. doi:https://doi.org/10.1016/j.ecoenv.2011.04.025.
- Paul (Guin), J., D.B. Naik, Y.K. Bhardwaj, and L. Varshney; Paul (Guin), J., D.B. Naik, Y.K. Bhardwaj and L. Varshney. 2014. “Studies on Oxidative Radiolysis of Ibuprofen in Presence of Potassium Persulfate.” Radiation Physics and Chemistry 100:38–44. doi:https://doi.org/10.1016/j.radphyschem.2014.03.016.
- Preuss, T.G., J. Gehrhardt, K. Schirmer, A. Coors, M. Rubach, A. Russ, P.D. Jones, J.P. Giesy, and A.T. Ratte. 2006. “Nonylphenol Isomers Differ in Estrogenic Activity.” Environmental Science & Technology 40:5147–53. doi: https://doi.org/10.1021/es060709r.
- Quero-Pastor, M.J., M.C. Garrido-Perez, A. Acevedo, and J.M. Quiroga. 2014. “Ozonation of Ibuprofen: A Degradation and Toxicity Study.” Science of the Total Environment 466-467:957–64. doi: https://doi.org/10.1016/j.scitotenv.2013.07.067.
- Saeid, S., P. Tolvanen, N. Kumar, K. Eränen, J. Peltonen, M. Peurla, J-P. Mikkola, A. Franz, and T. Salmi. 2018. “Advanced Oxidation Process for the Removal of Ibuprofen from Aqueous Solution: A Non-catalytic and Catalytic Ozonation Study in A Semi-batch Reactor.” Applied Catalysis. B, Environmental 230:77–90. doi: https://doi.org/10.1016/j.apcatb.2018.02.021.
- Schmitt-Jansen, M., P. Bartels, N. Adler, and R. Altenburger. 2007. “Phytotoxicity Assessment of Diclofenac and Its Phototransformation Products.” Analytical and Bioanalytical Chemistry 387:1389–96. doi: https://doi.org/10.1007/s00216-006-0825-3.
- Schulze, T. 2010. “Identification of a Phytotoxic Photo-transformation Product of Diclofenac Using Effect-directed Analysis.” Environmental Pollution 158:1461–66. doi: https://doi.org/10.1016/j.envpol.2009.12.032.
- Schymanski, E. L., J. Jeon, R. Gulde, K. Fenner, M. Ruff, H. P. Singer, and J. Hollender. 2014. “Identifying Small Molecules via High Resolution Mass Spectrometry: Communicating Confidence.” Environmental Science & Technology 48 (4): 2097–98. doi:https://doi.org/10.1021/es5002105.
- Shen, S., M R. Marchick, M. R. Davis, G. A. Doss, and L. R. Pohl. 1999. “Metabolic Activation of Diclofenac by Human Cytochrome P-450 3A4: Role of 5-Hydroxydiclofenac.” Chemical Research in Toxicology 12:214–22. doi: https://doi.org/10.1021/tx9802365.
- Skoumal, M., R. M. Rodríguez, P. L. Cabot, F. Centellas, J. A. Garrido, C. Arias, and E. Brillas. 2009. “Electro-Fenton, UVA photoelectro-Fenton and Solar photoelectro-Fenton Degradation of the Drug Ibuprofen in Acid Aqueous Medium Using Platinum and Boron-doped Diamond Anodes.” Electrochimia Acta 54 (7): 2077–85. doi:https://doi.org/10.1016/j.electacta.2008.07.014.
- Stierlin, H., J. W. Faigle, A. Sallmann, W. Kung, W. J. Richter, H.-P. Kriemler, K. O. Alt, and T. Winkler. 1979. “Biotransformation of Diclofenac Sodium (Voltaren®) in Animals and in Man.” Xenobiotica 9 (10): 601–10. doi:https://doi.org/10.3109/00498257909042327.
- Sun, S-P., X. Zeng, and A. T. Lemley. 2013. “Nano-magnetite Catalyzed Heterogeneous Fenton-like Degradation of Emerging Contaminants Carbamazepine and Ibuprofen in Aqueous Suspensions and Montmorillonite Clay Slurries at Neutral pH.” Journal of Molecular Catalysis. A, Chemical 371:94–103. doi: https://doi.org/10.1016/j.molcata.2013.01.027.
- Szabó, R. K., C. Megyeri, E. Illés, K. Gajda-Schrantz, P. Mazellier, and A. Dombi. 2011. “Phototransformation of Ibuprofen and Ketoprofen in Aqueous Solutions.” Chemosphere 84 (11): 1658–63. doi:https://doi.org/10.1016/j.chemosphere.2011.05.012.
- Triebskorn, R., H. Casper, A. Heyd, R. Eikemper, H. Köhler, and J. Schwaiger. 2004. “Toxic Effects of the Non-steroidal Anti-inflammatory Drug Diclofenac: Part II. Cytological Effects in Liver, Kidney, Gills and Intestine of Rainbow Trout (Oncorhynchus Mykiss).” Aquatic Toxicology 68:151–66. doi: https://doi.org/10.1016/j.aquatox.2004.03.015.
- Vieno, N., and M. Sillanpää. 2014. “Fate of Diclofenac in Municipal Wastewater Treatment Plant – A Review.” Environment International 69:28–39. doi: https://doi.org/10.1016/j.envint.2014.03.021.
- Vione, D., P. R. Maddigapu, E. De Laurentiis, M. Minella, M. Pazzi, V. Maurino, C. Minero, S. Kouras, and C. Richard. 2011. “Modelling the Photochemical Fate of Ibuprofen in Surface Waters.” Water Research 45 (20): 6725–36. doi:https://doi.org/10.1016/j.watres.2011.10.014.
- Wang, Y., H. Liu, G. Liu, Y. Xie, and S. Gao. 2015. “Oxidation of Diclofenac by Potassium Ferrate (VI): Reaction Kinetics and Toxicity Evaluation.” Science of the Total Environment 506-507:252–58. doi: https://doi.org/10.1016/j.scitotenv.2014.10.114.
- Xiang, Y., J. Fang, and C. Shang. 2016. “Kinetics and Pathways of Ibuprofen Degradation by the UV/chlorine Advanced Oxidation Process.” Water Research 90:301–08. doi: https://doi.org/10.1016/j.watres.2015.11.069
- Yang, Y., Y. S. Ok, K-H. Kin, E. E. Kwon, and Y. F. Tsang. 2017. “”Occurrences and Removal of Pharmaceuticals and Personal Care products(PPCPs) in Drinking Water and Water/sewage Treatment Plants.” A reviewScience of the Total Environment 596-597:303–20. doi: https://doi.org/10.1016/j.scitotenv.2017.04.1020
- Yu, H., E. Nie, J. Xu, S. Yan, W. J. Cooper, and W. Song. 2013. “Degradation of Diclofenac by Advanced Oxidation and Reduction Processes: Kinetic Studies, Degradation Pathways and Toxicity Assessments.” Water Research 47:1909–18. doi: https://doi.org/10.1016/j.watres.2013.01.016.
- Zhao, J., Y. Liu, Q. Wang, Y. Fu, X. Lu, and X. Bai. 2018. “The Self-catalysis of Ferrate (VI) by Its Reactive Byproducts or Reductive Substances for the Degradation of Diclofenac: Kinetics, Mechanism and Transformation Products.” Separation and Purification Technology 192:412–18. doi: https://doi.org/10.1016/j.seppur.2017.10.030.