
Abstract
A study was performed involving a series of double-headed carboxylate collectors with varying distance between the head groups (one, two or three carbon atoms). A collector with the same alkyl chain length but with only one carboxylate group was also included. All these were amino-acid based amphiphiles and the polar head group was connected to the hydrophobic tail via an amide linkage. Selective flotation recovery of different calcium minerals using these collectors was investigated. The double-headed collector with one carbon atom between the carboxylate groups was an apatite and fluorite specific reagent while the monocarboxylate surfactant showed high specificity for calcite. The flotation behavior of a simple conventional collector of the same alkyl chain length, a fatty acid salt, was also determined under identical flotation conditions in order to understand the effect of the amide group. Complementary experiments (ζ potential measurements, adsorption isotherm determinations) were also performed for these reagents. In order to shed light on the selectivity obtained with the dicarboxylate surfactants, the distances between the head groups were calculated and compared with the distances between neighboring calcium atoms on the surface of the minerals. It was found that the high degree of selectivity could be rationalized by perfect matching of these distances. To the best of our knowledge this is the first study where flotation selectivity in complex calcium mineral systems has been explained in terms of molecular recognition governing the interaction between the collector and the mineral surface.
Graphical Abstract
1. Introduction
There is a trend in the mining chemicals industry to design and market tailor-made performance chemicals customized for specific applications rather than offer conventional, generic, multipurpose commodity chemicals as flotation reagents.[Citation1–5] However, the industry is yet to find a solution for the beneficiation of fluorspar ores (fluorite-calcite-apatite separation[Citation6]) and for the processing of phosphate ore containing carbonate (apatite-calcite-dolomite separation[Citation7]), as the design of highly selective collectors for sparingly soluble calcium minerals for specific flotation applications is a challenging task.[Citation6–9] The difficulty arises because of the similar surface properties of the minerals, that is, the same chelating Ca2+ cation on the surfaces, and thereby similar responses to various known families of flotation collectors.[Citation9,Citation10]
For the separation of calcium minerals, surfactants containing a long alkyl chain and a single head group[Citation3] (e.g., carboxylate, hydroxamate, phosphonate) have commonly been used as collectors over the years.[Citation11–13] The functional group is usually selected based on feasibility of binding with the metal ions present at the mineral surface.[Citation4] However, if the ore consists of minerals with the same surface metal ion, this method cannot lead to complete separation of those minerals present in the system.[Citation10] Consequently, differential depression became the option and has been practiced in selective flotation of many complex ores, namely, calcite-fluorite-scheelite, calcite-fluorite, barite-fluorite, calcite-apatite and others; however, with limited efficiency.[Citation11,Citation12,Citation14]
To find a collector with specificity for a given surface, the interaction with the entire surface needs to be considered;[Citation15] it is not enough to consider only its complexation chemistry with the surface metal ion(s).[Citation16,Citation17] For that purpose collector molecules with two functional groups[Citation18,Citation19] have been synthesized and evaluated in order to achieve mineral specificity in flotation separation of calcium minerals. These anionic surfactants[Citation20,Citation21] have only one hydrophobic tail while the polar part consists of two carboxyl groups with varying distance between them (). For comparison, a monocarboxylic analog was also synthesized and evaluated. The flotation efficiency of these novel collectors, as well as of a conventional collector under the same set of experimental conditions, was determined. The aim of the work reported here is to demonstrate that the design of ‘smart’ collectors,[Citation22,Citation23] capable of recognizing a specific mineral surface in a mixture of calcium minerals is a way to achieve preferential flotation. Earlier, we showed[Citation24,Citation25] that the spacing between the carboxyl groups in these surfactants is important in order to recognize a particular calcium mineral surface. In the present study the mechanisms driving this differential flotation behavior is discussed. Adsorption isotherms were also constructed, for the first time, using this type of double-headed collectors. Finally, the theoretical distances between the polar groups of the double-headed reagents and the adjacent Ca-Ca distance in different crystals (apatite, calcite, fluorite) were compared to rationalize the mineral specific behavior of these collectors.
Figure 1. (Top-left) Sodium dodecanoate; (Top-right) Sodium N-dodecanoylglycinate; (Middle) Disodium N-dodecanoylaminomalonate; (Bottom-left) Disodium N-dodecanoylaspartate and (Bottom-right) Disodium N-dodecanoylglutamate.[Citation18]
![Figure 1. (Top-left) Sodium dodecanoate; (Top-right) Sodium N-dodecanoylglycinate; (Middle) Disodium N-dodecanoylaminomalonate; (Bottom-left) Disodium N-dodecanoylaspartate and (Bottom-right) Disodium N-dodecanoylglutamate.[Citation18]](/cms/asset/d4917ee1-4fd8-4d6c-996e-2e3e7cfc6b7e/ldis_a_1503547_f0001_b.jpg)
2. Materials and methods
2.1. Reagents
For the ζ potential measurements sodium chloride (NaCl) was used as background electrolyte. pH was adjusted using hydrochloric acid (HCl) and sodium hydroxide (NaOH). NaOH, HCl and NaCl were of analytical grade (VWR, ≥99%) and used as purchased.
2.1.1. Collectors
Flotation tests were performed with three double-headed collectors, disodium N-dodecanoylglutamate (C12GluNa2), disodium N-dodecanoylaspartate (C12AspNa2) and disodium N-dodecanoylaminomalonate (C12MalNa2) having three, two and one methylene groups between the two carboxylate (-COO−) groups, respectively. A single-headed collector, sodium N-dodecanoylglycine (C12GlyNa), was used as reference. The conventional collector sodium dodecanoate (C11COONa), with the same alkyl chain length (but no linker group), was also used. All the structures are shown in . The syntheses of the collectors have been described in a previous paper.[Citation20]
2.2. Materials
Pure apatite, calcite and fluorite minerals used in this work were purchased from Richard Tayler Minerals, UK. The minerals were received as large >100 g blocks. Those were first crushed in a jaw crusher, and further reduced in size using a stainless-steel ball-mill (in a planetary-motion instrument) and screened to collect the 38–150 µm size fraction. For ζ potential measurements, ≤5 µm size fraction was used, which was produced with a Fritch Pulverisette mortar grinder, followed by screening with a 5 µm filter cloth screen in an ultrasonic bath.
2.3. Microflotation tests
The microflotation tests of the mineral samples were performed in a 100 mL Hallimond cell using 1 g of pure mineral of the 38–150 µm size fraction at the desired pH and collector concentration. The suspension of mineral in Milli-Q water and collector was conditioned for 10 minutes, transferred to the Hallimond cell and floated for 1 minute at ambient temperature. The quotient between the mass of the recovered floated particles and the total mass of mineral particles used gave the flotation recovery (shown in ). The flotation experiments were each repeated at least 3 times and the error limit was ±5%. However, there is no error bar in the Hallimond flotation figures because those experiments give only trend lines.
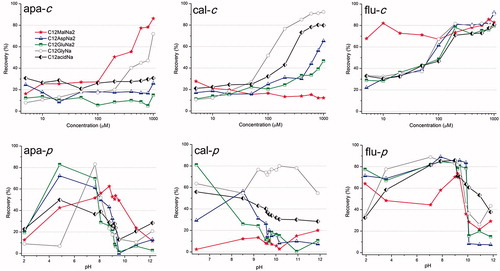
Figure 2. Flotation recovery for different minerals. apa, cal and flu stand for apatite, calcite and fluorite, respectively. The –c and –p terms indicate variation in concentration and pH, respectively.
2.4. ζ Potential measurements
ζ Potential measurements were performed using a Malvern Zetasizer (nano-ZS) instrument. Ten millimolar NaCl was used as background electrolyte and the amount of solid sample was 1 g/L. Each sample was equilibrated for 10 min on a shaking table. The results were analyzed using Zetasizer software® (version 7.02) with the Smoluchowski equation and are an average of three repeated measurements on the same sample, but each time with different aliquots. Every measurement consisted of 20 scans. The trend curves are only guides for the eye and have been added to point out the general development of the adsorption (shown in ).
Figure 3. ζ Potential measurement for different minerals.

2.5. UV spectroscopy
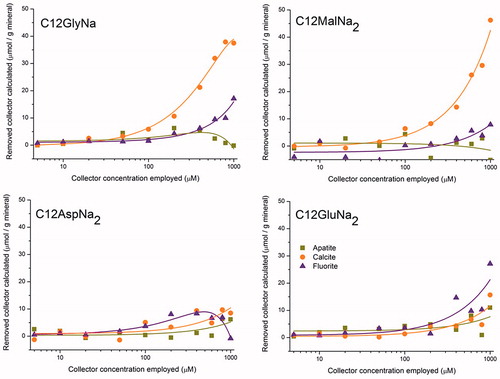
UV spectroscopy at 192 nm (which is the experimentally obtained maximum of the UV absorption curves for the pure collectors in dilute aqueous solution) was performed using an UV-1600PC spectroscope (VWR®) and the obtained results were analyzed with M. Wave Professional software. After the flotation experiment (at the concentrations reported), filtrate from both the floated and the non-floated parts were collected together in a 2 L volumetric flask, and the volume was then made up to the mark. Before this, a standard curve was constructed using pure collector at various concentrations ranging from 5 µM to 100 µM. The amount of collector remaining in solution after adsorption on the particle surface can be estimated from the UV measurement of the respective solution and knowing the slope obtained from the standard curve. These results are shown in Figure SI1. Subtracting these leftover concentrations from the original respective concentrations, the adsorbed amount is obtained and a tentative adsorption isotherm can be constructed, as shown in .
Figure 4. UV absorption measurement of collector solutions after the mineral treatment.
2.6. Total organic carbon determination
The total organic carbon (TOC) determination was performed (using European standard method) with a TOC-V instrument from Shimadzu Corporation, Kyoto, Japan. TOC is the difference between TC (total carbon) and IC (inorganic carbon). IC is analyzed by preparation of the samples with phosphoric acid. TC in the samples is analyzed by oxidation of carbon to carbon dioxide through combustion at 680 °C. Produced carbon dioxide is analyzed with non-dispersive infrared (NDIR) detector. The same filtrate solutions used in the UV-Vis measurements were also used in the TOC measurements, and tentative adsorption isotherms were constructed in a similar way ().
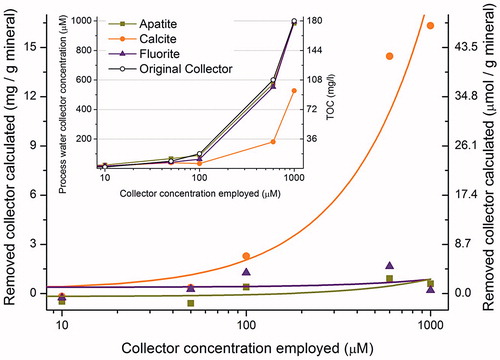
Figure 5. TOC measurement of C12MalNa2 solutions before and after the mineral treatment.
2.7. FTIR spectroscopy measurements
Fourier-transformed infrared (FTIR) spectroscopy measurements were performed using a Bruker IFS 66 v/S instrument with a deuterated triglycine sulfate detector. Standard curves were prepared by adding different but known amounts of pure collector to KBr, mixed homogeneously by grinding well (with a mortar and pestle for a measured time of 5 min). A pellet was prepared using a hydraulic press machine (Specac Brilliant Spectroscopy™), followed by immediate recording of the spectrum in transmittance mode with 128 scans at a resolution of 2 cm−1. The area under the CH2- stretching vibration peaks (2946–2891 cm−1 and 2865–2827 cm−1) was plotted and the best fit straight line was extrapolated to low values.
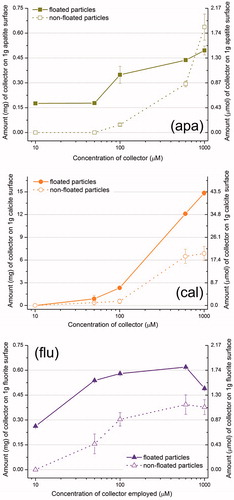
Apatite, calcite and fluorite were treated with the C12MalNa2 collector solutions, at concentrations between 10 µM and 1000 µM (at pH 9.2). This intermediate pH is very suitable for this particular study (and therefore chosen as standard). At this pH the aqueous solutions are stable (no precipitation on standing, especially important for C12MalNa2 which is relatively less soluble at room temperature). At higher pH the mineral surface becomes highly negatively charged, which hinders the approach of collector (of the same charge) to the surface. Hallimond flotation tests were performed in the usual way. The floated and the non-floated particle fractions were collected separately and washed with water in order to remove any loosely bound (physisorbed) collector on the mineral interface. The samples were then air-dried overnight at room temperature. The dried samples were mixed with dry potassium bromide to 16.7 wt% mineral concentration and the spectra were recorded ( and SI2). The amount of collector adsorbed is directly proportional to the area under the CH2-stretching vibration peaks. It is not necessary to subtract a spectrum of pure (freshly ground) mineral from the spectrum of collector-coated mineral to find the spectrum for the adsorbed collector only.
Figure 6. FTIR measurement of C12MalNa2 coated mineral particles (both floated and non-floated).
The reason for this is that the minerals themselves give very small contributions (even though calcite has two clear peaks in the CH2-stretching vibration region at 2993–2967 cm−1 and 2895–2810 cm−1) compared to the contribution of the collector. In order to totally remove the small contribution from the mineral, the mineral spectrum has to be multiplied with an appropriate factor, and then subtracted from the mineral-collector spectrum. All these additional mathematical operations create more errors in the quantitative measurements (and even visible artifacts) compared to simply ignoring the small shoulder contributions of the mineral peaks. No baseline correction was performed in any of mineral-collector spectra in order to avoid any mathematical contribution to these physical data.
Unlike with the UV and TOC measurements, with the FTIR measurements it is possible to estimate the adsorbed quantity directly. In the former two methods only the remaining collector concentration in solution can be measured, and from this values of adsorbed collector amount can be calculated. However, it must be borne in mind that part of the collector might be removed by precipitation with dissolved ions (like Ca2+ from the sparingly-soluble minerals). Therefore, all the observed decrease in collector concentration should not be accounted for as adsorption on the mineral interface.
2.8. Crystal structure data and molecular modeling
Crystal structure data of apatite, calcite and fluorite were evaluated using the software Crystal Maker (Version 9.2.3). The software comprises a structure database library with common minerals. The bond distance measurement tool in the software gives the Ca-Ca surface distances which differ between the minerals because of different crystal structures.
The collector head group distances were measured with ACDLABS 3D viewer software (Version 12.0).
3. Results
3.1. Hallimond flotation test of apatite, calcite and fluorite
3.1.1. Effect of concentration (ranging from 5 µM to 1000 µM) at a constant pH of 9.2
Results from flotation experiments for apatite can be seen in (apa-c). Even at the moderate concentration of 600 µM, apatite was floated efficiently (∼80%) with C12MalNa2 while with C12GlyNa, the highest concentration (1000 µM) was needed to obtain nearly the same efficacy. The three remaining collectors showed virtually no recovery.
(cal-c) shows flotation recovery of calcite. As can be seen, at pH 9.2 the single head group collectors C12GlyNa and C11COONa were the most efficient. With C12AspNa2 and C12GluNa2 there was only a moderate flotation recovery of calcite also at relatively high collector concentrations (above 400 µM). C12MalNa2 did not provide flotation of calcite at any concentration.
The flotation behavior of fluorite is shown in (flu-c). As can be seen, C12MalNa2 recovered fluorite even at very low concentration. All the other collectors gave very poor recovery at low concentration; however, with increasing collector concentration there was substantial improvement in recovery, and the concentration needed to achieve a high recovery did not differ much among these reagents.
3.1.2. Effect of pH at a constant concentration of 200 µM
Flotation recovery was studied in the pH range 2–12 for both apatite and fluorite, while 6–12 for calcite, using a collector concentration of 200 µM (Due to the alkaline nature of CaCO3 it was not feasible to measure at a pH lower than 6.). At this intermediate concentration, flotation of minerals is neither too high nor too low at most of the pH values. So, by avoiding the limiting collector concentrations, it became easier to compare relative collector efficiencies. The data obtained are presented in (apa-p), (cal–p), (flu-p). At low pH, all the collectors except C12GlyNa yielded good apatite recovery at some point, while for calcite the only collector that gave substantial recovery was C12GlyNa at intermediate and high pH. At intermediate pH (9–10.5) C12MalNa2 shows slightly higher recovery of apatite and fluorite compared to the other pH values, while with calcite the only collector without substantial recovery at low pH was C12MalNa2. Fluorite is undoubtedly the most floatable mineral in this series, and can be very efficiently floated over the entire pH range with all the collectors employed unless the pH is very high (>10).
The flotation results at varying collector concentration (at a constant pH of 9.2), shown in (apa-c, cal–c, flu-c), are in good agreement with the recovery shown in (apa-p, cal–p, flu-p) at varying pH (and at a constant concentration of 200 µM).
3.2. ζ Potential measurements of apatite, calcite and fluorite
3.2.1. Effect of concentration (ranging from 5 µM to 1000 µM) at a constant pH of 9.2
(apa-c) shows ζ potential curves for apatite. C12MalNa2 produced a rapid decrease in the ζ potential with increasing collector concentration, due to strong adsorption at the apatite surface. C12GlyNa, which gave the second best recovery in the flotation experiments, gave the second lowest ζ potential especially at high collector concentration. The other collectors, which gave negligible flotation recovery, generated only a minute change in the ζ potential values, demonstrating little or no adsorption at the apatite surface.
As can be seen from (cal-c) the ζ potential curves for calcite show decreasing ζ potential with increasing collector concentration. C12MalNa2 is the collector that affects the ζ potential the most.
(flu-c) shows ζ potential vs. collector concentration curves for the fluorite surface, which became negatively charged already at very low concentration of the collector C12MalNa2, which was also the collector that gave the highest flotation recovery of fluorite. The other collectors gave low ζ-potential at high concentrations.
3.2.2. Effect of pH at a constant collector concentration of 200 µM
(apa-p) illustrates ζ potential results of apatite at various pH values for a collector concentration of 200 µM, as well as when no collector was present. (cal-p) and (flu- p) show the ζ potential for calcite and fluorite, respectively, at the same collector concentration. Apatite displays an isoelectric point slightly above pH 2 in the absence of any collector. The isoelectric point of apatite does not change significantly in the presence of the single-headed collector C11COONa. In the presence of other collectors no isoelectric point was detected in the pH range examined.
(cal-p) shows that the isoelectric point for untreated calcite is around pH 9.4. The curve for C12MalNa2-treated calcite shows very low ζ potential values over the entire pH range, possibly indicating high adsorption. The ζ potential after treatment with the other collectors remained close to that for untreated calcite; however, for C11COONa there was a sudden ζ potential drop at the pH range 10.7–11.7. No specific change in flotation efficiency was seen for this collector in that pH range, however.
In the absence of any flotation collector the fluorite showed an isoelectric point of pH 9.2 ((flu-p)). In the presence of the dicarboxylic collectors (C12MalNa2, C12AspNa2 and C12GluNa2) no definite isoelectric point was observed. The monocarboxylic reagents C12GlyNa and C11COONa, on the other hand, gave an almost neutral fluorite surface at the pH values 3.0 and 2.4, respectively. The change in ζ-potential for C11COONa and C12MalNa2 was more negative compared to the other collectors used. However, C12MalNa2 gave lower flotation recovery of fluorite than the other collectors ((flu-p)). It is interesting to note that the ζ potential vs. pH curves for this mineral, both in presence and in absence of a collector, passes through a minimum around pH 4.5, and then in many cases rises to a local maximum at pH 7–8.
3.3. UV spectroscopy
UV spectroscopy clearly indicates that the amount of collector adsorbed on apatite and on fluorite surfaces is very small throughout the whole concentration range studied (at a constant pH of 9.2) (). This is irrespective of whether the collector caused flotation or not. On the calcite surface, however, the amount of adsorbed C12MalNa2 increased significantly with increasing collector concentration. The amount of C12GlyNa adsorption on calcite was also not negligible.
3.4. Total organic carbon (TOC) determination
The microflotation tests, ζ potential measurements and UV experiments indicate that C12MalNa2 is the most interesting collector for the mineral system under the conditions used in the study. Its concentration in solution, before and after the mineral treatment for the flotation process, was therefore assessed by TOC determination, and the values are shown as a function of initial surfactant concentration in (inset). For the apatite and fluorite surfaces there is very little decrease in collector concentration after exposure to the mineral. On the other hand, for the calcite surface, there is a significant decrease in collector concentration.
3.5. FTIR spectroscopy
The adsorption of the collector C12MalNa2 on apatite, calcite and fluorite mineral surfaces was studied with FTIR spectroscopy. The amount of collector adsorbed is calculated from the area under the alkyl chain (CH2-) absorbance band regions and the results are shown in . Calcite itself has two absorption bands in the CH2-band region, but it is still possible to clearly see the collector absorbance bands (Figure SI2), as the shoulder of the second peak is small and can be neglected. In this figure, we can regard the spectrum of C12MalNa2 on calcite as a combination of the spectra of pure C12MalCa and calcite.
The FTIR curves can be regarded as adsorption isotherms. For the apatite and fluorite surfaces, the amounts of adsorbed collector (at a given concentration of collector used) are similar and in the range 1 micromole per gram of mineral used. The amount of adsorbed collector on the calcite surface is at least one order of magnitude higher.
4. Discussion
Some of the authors of this paper have published preliminary data on a similar topic earlier.[Citation24,Citation25] However, in those previous articles, the pH employed was either rather high (around 10.5, which is not the best choice from an environmental point of view) or uncontrolled (i.e., natural pH). In the latter case some difficulty had arisen regarding collector solubility, especially for C12MalNa2 at higher concentrations (close to 1 mM). At pH 10.5 the surfactant solubility is reasonable, but the flotation recovery is usually poor. On the other hand, at natural pH, the flotation recovery is significantly better, but there are severe concerns about the surfactant solubility. Under such conditions flotation may occur but it may take place through unselective precipitation of collector aggregates[Citation26] on the mineral surface, and the resulting flotation may not be mineral-specific. While performing those experiment, it was realized that it is better to perform the tests at lower pH (because of environmental reasons) but still at a pH where all the collectors are well soluble at room temperature. The intermediate pH of 9.2 was therefore chosen in the work described here. At this pH it is also possible to get proper flotation recovery at low collector concentration.
The set of flotation data presented here is completely new; no single data has been taken from the previous articles. In the present paper we have included molecular modeling as a tool to help explain the experimental results, and molecular modeling was absent in the previous articles. In the present article, the amount of adsorption was quantified using UV, FTIR and TOC, and adsorption isotherms were constructed.
Another difference between this paper and the previous ones is that we here use proper flotation size particles in the FTIR studies; we analyze both the floated and the non-floated fractions separately and quantitatively. In the previous articles <5 µm size particles were used. Such small particles are too fine for flotation to occur but the motivation was to have higher surface area and thereby better FTIR signals. The use of such small particles is a common practice in flotation labs when FTIR is used as an analytical tool but it is a disadvantage that the procedure deviates from the real one.
It is important to point out that this study is performed using pure minerals; thus, there is no competition for added reagents between different solid surfaces. It is likely that in a real or an artificially mixed system, there would be a competition for the surfaces and the collector would to a varying extent adsorb at all available surfaces.
The monocarboxylic reagent C11COONa is a traditional collector, adsorbing on all the calcium minerals, with a slight preference for calcite and fluorite over apatite. A similar behavior is seen with the other monocarboxylic collector used in the study, C12GlyNa. However, the biggest difference in flotation behavior between these two collectors was seen for calcite flotation at the higher pH (pH > 9), where C12GlyNa is an excellent collector while C11COONa gives poor result.
It is also observed (apa-p, cal-p, flu-p) that at low pH, most of the collectors float all three minerals in excellent way. Adsorption of the collectors on the mineral surface at low pH seems reasonable, given that the pH is close to the pKa of the carboxylic groups[Citation27] of the collectors where unselective surface precipitation of the reagent may take place.[Citation26] Both for the mono- and the dicarboxylic surfactants, the surfactant solubility will decrease with a decrease in pH.
(apa-c and flu-c) show that C12MalNa2 gives excellent recovery of apatite (using a collector concentration of 200 µM or larger) and of fluorite (at even lower concentrations). However, no noticeable flotation of calcite at any pH or concentration had occurred with the same collector, as shown in (cal-c and cal-p). The efficient flotation of apatite and fluorite can be correlated to the decreased ζ potential, indicating surface adsorption. Similarly, adsorption of the collector on calcite surface led to a large decrease in ζ potential. This shows that adsorption in itself is not enough for successful flotation.[Citation28]
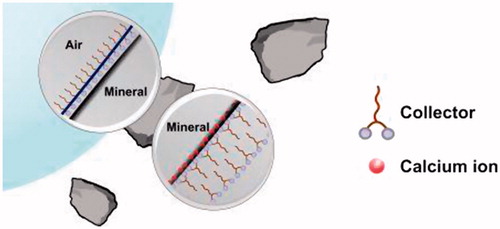
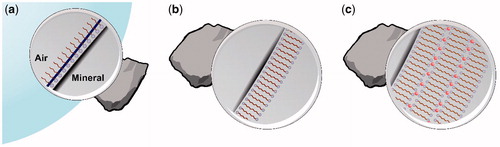
An ionic collector always adsorbs as a bilayer on a hydrophilic mineral surface with the polar head group of the first layer pointing towards the surface and the polar head group of the outer layer pointing towards the surrounding water, according to the modern view of collector-mineral interaction.[Citation29–34] This is in contrast to the older view where the surfactant was thought to adsorb as a monolayer, with the polar group of the surfactant facing the surface and the non-polar hydrocarbon tail striving out into the aqueous solution. That view totally underestimates the importance of the so-called hydrophobic effect as it only gives importance to the interaction between the head group of the collector and the surface. The hydrophobic effect, which is mainly an entropic effect, tries to minimize contact between the hydrophobic tails and water and is the driving force for surfactant self-assembly both in bulk and at surfaces.[Citation35,Citation36] Adsorption at a solid surface results in formation of either a monolayer (if the surface is hydrophobic) or a bilayer (if the surface and the polar head group of the surfactant carry opposite charge). If, in the latter case, there is not enough collector to give a bilayer over the entire surface, then there will be naked surface between the areas covered by the bilayer. During the flotation process, with the bubble-particle interaction, the outer layer of collector molecules gets spontaneously stripped off in such a way that the inner hydrophobic layer becomes available for the bubble to attach.[Citation35,Citation37] The process is pictured in . This mechanism might not work on a mineral surface where the collector is not strongly attached by specific interactions between the polar head group, or groups, of the collector and binding sites on the surface. In such a case the inner surfactant layer, after stripping off the outer layer, may not be attached firmly enough to the adhering bubble for the particle to be floated. Even if both functional groups of a double-headed surfactant are involved in the adsorption, the bubble-particle interaction may not be stable if the collector cannot arrange itself to form a properly oriented hydrophobic island after stripping. Another tentative explanation for a poor flotation recovery in spite of proper collector adsorption is that a bilayer is formed that is so favorably packed that it is resistant to peeling off the outer layer by the approaching bubble, see . In such a case the mineral surface is not rendered hydrophobic and flotation will not occur. However, it is not possible to distinguish between these possible mechanisms with only microflotation tests and ζ potential measurements. Therefore, the system was further studied using UV, TOC and FTIR, and the actual nature of the adsorbed layer is discussed in some detail below, supported by the experimental observations.
Figure 7. (a) Surfactant monolayer at the particle bubble interface. (b) A hypothetical ‘stable’ bilayer formation hindering efficient floatation. (c) A multilayer formation promoted by calcium ions (in red).
The UV absorption measurements as a function of surfactant concentration indicate that, in general, there is only a relatively small additional adsorption of collector with an increased added amount, as can be seen in , with exception of the calcite-C12MalNa2 and the calcite-C12GlyNa pairs, for which the very high amount of adsorbed collector is surprising. It is interesting to note that both for apatite and fluorite there is hardly any decrease in solution concentration of the collector after the mineral has been exposed to the collector solution. This is irrespective of the collector concentration employed, and of whether the mineral is well floated or not. This implies that in order to make the particle hydrophobic enough to attach to the air bubbles, which is needed for flotation, only a very small quantity of collector is required. Possibly less than a fully developed bilayer, i.e. only scattered patches of a bilayer, is enough for successful flotation. The strong decrease in the solution concentrations for the pairs calcite-C12MalNa2 and calcite-C12GlyNa indicates high collector adsorption.
The UV results are totally supported by the TOC determinations. Both methods record the remaining collector concentration in solution. Amount of adsorbed material is calculated by subtracting these values from the initial values.
FTIR is a useful complementary tool because one can measure amount of surfactant adsorbed at the surface. It was found that the amounts of adsorbed material on the floated particles are higher than on the non-floated particles, as expected. However, the adsorption was significant also on the non-floated particles (). An interesting observation is, again, the very high amount of adsorbed collector on the calcite surface, nearly 30 times more than on the other two minerals. It should also be borne in mind that for calcite, the floated fraction is negligible in comparison to the non-floated one. So, even after this high amount of adsorbed collector, the calcite particles do not float.
As calcite does not get floated with the C12MalNa2 collector at any concentration or pH, it is clear that this adsorption does not lead to formation of a hydrophobic surface when the particle is exposed to air bubbles. The very high amount of adsorbed collector indicates possible formation of a multilayer of the surfactant on the mineral surface. An attempt to picture such a multilayer can be found in . The outer layer of polar head groups from the first double layer attracts more surfactants and a new double layer is created. This new double layer will direct polar head groups towards the particle and towards the surrounding water, just as the first double layer does. This process goes on, eventually resulting in formation of a multilayer of collector molecules on the mineral surface. This layer-by-layer assembly would not happen in an electrolyte-free system because the negatively charged head groups would repel each other. It can happen under the conditions of flotation of calcium minerals, however, because the concentration of calcium ions in solution is high and such divalent cations may act as bridging elements for the double layers, as illustrated in the figure.
Extensive multilayer coverage has previously been reported for oleate adsorption on calcite.[Citation28,Citation38,Citation39] This is also attributed to deposition of calcium oleate onto the calcite surface.[Citation40] One may assume that the reason for the poor flotation efficacy of calcite with C12MalNa2 as collector is that peeling off such a multilayer down to the innermost single layer is a complicated matter that is unlikely to occur.
BET measurements showed that the surface area per gram (of flotation size) of all the minerals used are ∼0.15 m2. The area per molecule for C12MalNa2 at the air-water interface has previously been reported[Citation20] to be ∼100 Å2. Assuming similar surface density of the collector on the mineral surface, simple calculations show that the required amount of C12MalNa2 to form a bilayer across the entire surface is of the order of 0.2 mg per gram of mineral, only. This value agrees very well with the measurements discussed above (UV, TOC and FTIR, see , respectively) concerning the apatite and fluorite surfaces, where it is clear that only a tiny fraction of the collector actually goes to the surface. The excess collector is only needed to push the equilibrium towards adsorption. On the other hand, FTIR results on the dried collector-coated mineral particles (for C12MalNa2 adsorption on calcite) showed that nearly 7 mg collector was present per gram of mineral. Such a high amount of collector on the mineral particles is a clear indication of formation of multilayers. To support this conclusion, UV and TOC experiments demonstrated that there was a large decrease in collector concentrations after exposure to the mineral.
displays the maximum possible distance between the two functional groups of the collector when they are oriented on the same side of the molecule, enabling both of them to engage with two metal atoms on the mineral surface at the same instance. The O to neighboring O distance for C12AspNa2 and C12GluNa2 in cis conformation is the same (6.2 Å), while this distance is much smaller for C12MalNa2 (3.6 Å). presents the Ca-Ca distances in the different minerals. Different crystal planes present in the minerals have different Ca-Ca distances and only the shortest possible distances were chosen. The longer distances are not necessary to consider, since the two carboxylic groups of the collectors employed cannot simultaneously interact at very distant adsorption sites.
Table 1. Maximum distance between head groups in the double-headed collector molecules.
Table 2. Surface Ca-Ca shortest distance in calcium minerals.
The Ca-Ca distances in apatite and fluorite are 3.4 Å and 3.5 Å, respectively. These values match very well with that of C12MalNa2. It seems reasonable to assume that this matching of critical interatomic distances is the reason for the supreme flotation efficiency of fluorite with C12MalNa2, even at very low collector concentrations. C12AspNa2 and C12GluNa2 do not float apatite as their head group distances are too large to match with the neighboring Ca-Ca distance in this mineral. However, both these collectors can float calcite and fluorite, with a ∼5.0 Å neighboring Ca-Ca distance if the added amount of collector is high enough. It seems reasonable that when there is poor matching between the head group distance and the Ca-Ca distance, a higher concentration of collector is required to obtain proper bilayer adsorption at the mineral surface.
The same maximum head group distance in C12AspNa2 and C12GluNa2 has another consequence. These collectors, with a given mineral at any given pH and concentration, always generate similar flotation recoveries as well as ζ potential values. As these two collectors have similar head group distances, their adsorption behavior at a given surface is expected to be similar, irrespective of pH and concentration. This is a clear demonstration of how the mineral specific behavior of collectors depend on the matching between the Ca-Ca distance in the minerals and the collector head group O-O distance.
5. Conclusion
C12MalNa2 (where the two carboxylate groups are separated by a single methylene group) seems to be an apatite and fluorite specific reagent while C12GlyNa is a calcite specific collector (especially at high pH). By proper selection of collector and by carefully controlling flotation conditions (concentration, pH) together with the choice of the suitable (specific) collector, it should be feasible to separate the three minerals from each other. Without the presence of any activator/modifier/depressant for flotation, it is demonstrated that a single collector (C12MalNa2) can float apatite and fluorite efficiently while being totally ineffective for calcite, although these three calcium minerals have similar type of adsorption sites on their surfaces. This specificity remains under a broad range of concentrations and pH values. In this article we postulate that it happens due to geometrical matching between the surface calcium sites on the mineral and the carboxylate head groups in the collector.
The good reagent, C12MalNa2, has one methylene group between the carboxylate groups. C12AspNa2 and C12GluNa2, the collectors with two or three methylene groups as spacer, do not float apatite at all at high pH, most likely due to geometrical mismatch. However, for calcite and fluorite these collectors give flotation but only if the added amount is very high. Again, in all these cases, matching was observed between collector head group distance and distance between adsorption sites of the mineral.
However, substantial flotation was seen when the collectors were used at lower pH, where they do not have good solubility in water. It is likely that at low pH the insoluble collector, or aggregates of the collector, adsorbs at the mineral surface. However, if this happens there is usually no selectivity.[Citation26]
The constructed adsorption isotherms based on the TOC, UV and FTIR results all indicate that a multilayer assembly[Citation28,Citation38,Citation39] had taken place during C12MalNa2 adsorption on the calcite surface, but not on the apatite and fluorite surfaces. However, this multilayer formation did not provide hydrophobization of the calcite surface (when the multilayer came in contact with air), and no flotation was observed.
Supplemental Material
Download MS Word (279 KB)Disclosure statement
No potential conflict of interest was reported by the authors.
Related Research Data
References
- Fuerstenau, D.-F. Where We are in Flotation Chemistry After 70 Years of Research. Section Title: Extractive Metallurgy. Proceedings of Int. Miner. Proc. Conf. XIX, 1995.
- Pearse, M.-J. An Overview of the Use of Chemical Reagents in Mineral Processing. Miner. Eng. 2005, 18, 139–149.
- Pradip. Reagents Design and Development for the Mineral Processing Industry: Scientific Challenges and Engineering Issues. Met. Mater. Proc. 1998, 10, 41–54.
- Butcher, A. A Practical Guide to Some Aspects of Mineralogy That Affect Flotation. Australas. Inst. Min. Metall. Spectrum Ser. 2010, 16, 83–93.
- Karsa, D.-R. Design and Selection of Performance Surfactants, Sheffield Academic, CRC Press: Sheffield, Boca Raton, 1999.
- Pugh, R.; Stenius, P. Solution Chemistry Studies and Flotation Behaviour of Apatite, Calcite and Fluorite Minerals with Sodium Oleate Collector. Int. J. Miner. Proc. 1985, 15, 193–218.
- El-Midany, A.; El-Shall, H.; Somasundaran, P.; Stana, R.; Moudgil, B. Novel Flotation Technique for Carbonate Mineral Flotation. Publ. Australas. Inst. Min. Metall. 2005, 5, 743–747.
- Santos, E.-P.; Dutra, A.-J.-B.; Oliveira, J.-F. The Effect of Jojoba Oil on the Surface Properties of Calcite and Apatite Aiming at Their Selective Flotation. Int. J. Miner. Proc. 2015, 143, 34–38.
- Rao, H.-K.; Forssberg, K. S. E. Mechanism of Fatty Acid Adsorption in Salt-Type Mineral Flotation. Miner. Eng. 1991, 4, 879–890.
- Nagaraj, D.-R.; Ravishankar, S.-A. Flotation Reagents—A Critical Overview from an Industry Perspective. In Froth Flotation: A Century of Innovation; Fuetstenau M.-C., Jameson, G., Yoon, R., Eds.; SME: USA, 2007; pp 375–424.
- Hu, Y.; Chi, R.; Xu, Z. Solution Chemistry Study of Salt-Type Mineral Flotation Systems: Role of Inorganic Dispersants. Ind. Eng. Chem. Res. 2003, 42, 1641–1647.
- Finkelstein, N.-P. Review of Interactions in Flotation of Sparingly Soluble Calcium Minerals with Anionic Collectors. Trans. Inst. Min. Metall. 1989, 98, 157–177.
- Rao, H.-K.; Forssberg, K.-S.-E. Interactions of Anionic Collectors in Flotation of Semi-Soluble Salt Minerals. In Innovations in Flotation Technology; Mavros, P., Matis K.-A., Ed(s).; Kluwer Academic Publishers: London, 1992; pp 331–356.
- Tian, X.; Zhang, X.; Li, L.; Wang, D. Activation and Depression of Calcite in Calcium Minerals Flotation. Trans. Nonferrous. Met. Soc. China. 1999, 9, 374–377.
- Pradip, R.,B. Design of Tailor-Made Surfactants for Industrial Applications Using a Molecular Modelling Approach. Coll. Sur. A. 2002, 205, 139–148.
- Xu, L.; Wu, H.; Dong, F.; Wang, L.; Wang, Z.; Xiao, J. Flotation and Adsorption of Mixed Cationic/Anionic Collectors on Muscovite Mica. Miner Eng. 2013, 41, 41–45.
- Tian, J.; Xu, L.; Deng, W.; Jiang, H.; Gao, Z.; Hu, Y. Adsorption Mechanism of New Mixed Anionic/Cationic Collectors in a Spodumene-Feldspar Flotation System. Chem Eng Sci. 2017, 164, 99–107.
- Baldauf, H.; Singh, D.-V.; Schubert, H. Flotation of Tin Ores with Dicarboxylic Acids. Neue Bergbautech. 1980, 10, 692–698.
- Marabini, A.-M.; Ciriachi, M.; Plescia, P.; Barbaro, M. Chelating Reagents for Flotation. Miner. Eng. 2007, 20, 1014–1025.
- Bordes, R.; Holmberg, K. Physical Chemical Characteristics of Dicarboxylic Amino Acid-Based Surfactants. Coll. Surf. A. 2011, 391, 32–41.
- Bordes, R.; Tropsch, J.; Holmberg, K. Role of an Amide Bond for Self-Assembly of Surfactants. Langmuir. 2010, 26, 3077–3083.
- Rai, B. Ed. Molecular Modeling for the Design of Novel Performance Chemicals and Materials; CRC Press: Boca Raton, 2012.
- Lu, S.; Song, Z.; Sun, C. Review on Some Research Methods of Mineral Crystal Chemistry and Computer Simulation on Flotation. Publ. Australas. Inst. Min. Metall. 2010, 7, 3269–3275.
- Karlkvist, T.; Patra, A.; Rao, H.-K.; Bordes, R.; Holmberg, K. Flotation Selectivity of Novel Alkyl Dicarboxylate Reagents for Apatite–Calcite Separation. J. Coll. Inter. Sci. 2015, 445, 40–47.
- Karlkvist, T.; Patra, A.; Bordes, R.; Holmberg, K.; Rao, K.-H. Flotation Selectivity of Novel Alkyl Dicarboxylate Reagents for Calcite-Fluorite Separation. Tenside Surfactants Detergents. 2016, 53, 516–523.
- Castro, S.-H.; Vurdela, R.-M.; Laskowski, J.-S. The Surface Association and Precipitation of Surfactant Species in Alkaline Dodecylamine Hydrochloride Solutions. Coll. Surf. 1986, 21, 87–100.
- Modi, H.-J.; Fuerstenau, D.-W. Flotation of Corundum. An Electrochemical Interpretation. Trans. Am. Inst. Min. Metall. Pet. Eng. 1960, 217, 381–387.
- Young, C.-A.; Miller, J.-D. Effect of Temperature on Oleate Adsorption at a Calcite Surface: An FT-NIR/IRS Study and Review. Int. J. Miner. Process. 2000, 58, 331–350.
- Warr, G.-G. Surfactant Adsorbed Layer Structure at Solid/Solution Interfaces: Impact and Implications of AFM Imaging Studies. Curr. Opin. Coll. Inter. Sci. 2000, 5, 88–94.
- Paria, S.; Khilar, K.-C. A Review on Experimental Studies of Surfactant Adsorption at the Hydrophilic Solid-Water Interface. Adv. Coll. Inter. Sci. 2004, 110, 75–95.
- Zhmud, B.; Tiberg, F. Interfacial Dynamics and Structure of Surfactant Layers. Adv Colloid Interface Sci. 2005, 113, 21–42.
- Tiberg, F.; Brinck, J.; Grant, L. Adsorption and Surface-Induced Self-Assembly of Surfactants at the Solid-Aqueous Interface. Curr. Opin. Coll. Inter. Sci. 1999, 4, 411–419.
- Somasundaran, P.; Fuerstenau, D.-W. Mechanisms of Alkyl Sulfonate Adsorption at the Alumina-Water Interface. J. Phys. Chem. 1966, 70, 90–96.
- Lu, Y.; Drelich, J.; Miller, J.-D. Oleate Adsorption at an Apatite Surface Studied by Ex-Situ FTIR Internal Reflection Spectroscopy. J. Coll. Inter. Sci. 1998, 202, 462–476.
- Kronberg, B.; Holmberg, K.; Lindman, B. Surface Chemistry of Surfactants and Polymers, Wiley: Chichester, 2014.
- Tanford, C. The Hydrophobic Effect: Formation of Micelles and Biological Membranes, 2nd ed.; Wiley-Interscience: New York, 1980.
- Milton, J.-R.; Joy, T.-K. Adsorption of Surface-Active Agents at Interfaces: The Electrical Double Layer. Surfactants and Interfacial Phenomena. 4th ed.; John Wiley & Sons Inc; Hoboken, NY, 2012; pp 39–122.
- Zimmels, Y.; Lin, I.-J.; Friend, J.-P. Relation between Stepwise Bulk Association and Interfacial Phenomena for Some Aqueous Surfactant Solutions. Colloid Polymer Sci. 1975, 253, 404–421.
- Marinakis, K.-I.; Shergold, H.-L. The Mechanism of Fatty Acid Adsorption in the Presence of Fluorite; Calcite and Barite. Int. J. Miner. Proc. 1985, 14, 161–176.
- Somasundaran, P. Adsorption of Starch and Oleate and Interaction between Them on Calcite in Aqueous Solutions. J. Coll. Inter. Sci. 1969, 31, 557–565.