Abstract
Problem, research strategy, and findings: Underpriced and overcrowded curb parking creates problems for everyone except a few lucky drivers who find a cheap space; all the other drivers who cruise to find an open space waste time and fuel, congest traffic, and pollute the air. Overpriced and underoccupied parking also creates problems; when curb spaces remain empty, merchants lose potential customers, workers lose jobs, and cities lose tax revenue. To address these problems, San Francisco has established SFpark, a program that adjusts prices to achieve availability of one or two open spaces per block. To measure how prices affected on-street occupancy, we calculated the price elasticity of demand revealed by over 5,000 price and occupancy changes during the program's first year.
Price elasticity has an average value of –0.4, but varies greatly by time of day, location, and several other factors. The average meter price fell 1% during the first year, so SFpark adjusted prices without increasing them overall. This study is the first to use measured occupancy to estimate the elasticity of demand for on-street parking. It also offers the first evaluation of pricing that varies by time of day and location to manage curb parking.
Takeaway for practice: San Francisco can improve its program by making drivers more aware of the variable prices, reducing the disabled placard abuse, and introducing seasonal price adjustments. Other cities can incorporate performance parking as a form of congestion pricing.
Research support: University of California Transportation Center.
In 2011, San Francisco adopted the biggest price reform for on-street parking since the invention of the parking meter. Oklahoma City installed the world's first parking meters in 1935, charging 5 cents an hour (85 cents in 2013 currency). Most cities’ pricing policies have changed little since then. Parking meters usually charge the same price all day, and some cities charge the same price everywhere.Footnote 1 San Francisco has moved toward a more efficient and equitable system of on-street parking prices that vary by time of day and from block to block.
Is this a good thing? In principle, absolutely. SFpark, San Francisco's new pricing program, incorporates long-established theoretical principles for the optimal pricing of public services. Nobel-prize economist William Vickrey, a visionary on many public pricing topics, recommended variable prices for on-street parking as long ago as 1954. He proposed that curb-parking prices should be set “at a level so determined as to keep the amount of parking down sufficiently so that there will almost always be space available for those willing to pay the fee” (Vickrey, 1954, p. 64).Footnote 2 The primitive metering technology in 1954 made Vickrey's proposal to match prices to demand appear outlandish, and it became one of what he called his “innovative failures in economics” (Vickrey, Citation1993, p. 1).Footnote 3
When using prices to manage transportation demand, Philip Goodwin (Citation2001, p. 29) distinguished between two strategies. The first was to “get the prices right: where travel is currently undercharged, getting the price right will reduce traffic.” The second was “let's decide how much traffic we want, and then use prices to achieve it” (p. 29). These two strategies have been called the price and quantity approaches to dealing with externalities, where individual decisions fail to account for spillover effects.Footnote 4 Setting a target occupancy rate for curb parking represents the second approach; for a typical block, this means aiming for at least one open space on each side of the street. Rather than choosing the right price for curb parking, planners adjust prices to reach the right occupancy rate.
Distorted prices are either too high or too low. In analyzing the city as a distorted-price system, Wilbur Thompson (Citation1968) argued that the failure to use prices in the public sector is the root of many urban problems, using on-street parking as an example: “Rationing need not always be achieved with money, as when a motorist circles the block over and over looking for a place to park….The parking ‘problem’ may be reinterpreted as an implicit decision to keep the money price artificially low (zero or a nickel an hour at a meter) and supplement it with a waiting cost or time price” (p. 29). This waiting cost is the time drivers spend circling the block searching for an open space.
The parking price that achieves one or two open spaces per block is not a free-market price; it is instead a public price for a public service, and it should be set to achieve the public goal of effectively managing the parking supply. Because cities can charge parked cars more easily than moving cars, getting the prices right for curb parking is a cheaper version of congestion pricing for traffic.
In this article, we first review the problems caused by mispriced curb parking. We next explain how San Francisco aims to set the right prices for curb parking by establishing a target occupancy rate. We then analyze the data on changes in occupancy rates after more than 5,000 price changes to learn how parking prices affected occupancy during SFpark's first year. While endorsing many of the details of SFpark, we conclude by suggesting ways to improve it.
The Problem of Cruising for Curb Parking
Scholars have clearly established the conceptual basis for cities to treat curb space as a valuable commodity rather than a free good (Arnott & Inci, Citation2006; Klein, Moore, & Reja, 1997; Shoup Citation2011; Vickrey, 1954, 1994). They generally conclude that cities should set the right prices for curb parking because the wrong prices do so much harm. Where curb parking is underpriced and overcrowded, drivers cruise the streets hoping to find an open space. This cruising greatly increases traffic congestion: Ten studies conducted in eight cities between 1927 and 2011 found that an average of 34% of cars in congested downtown traffic were cruising for parking (). In 2007, for example, researchers interviewed drivers stopped at traffic signals in New York City and found that roughly one third were cruising. Another study in a 15-block commercial district in Los Angeles estimated that cruising for curb parking created nearly 1.5 million excess vehicle kilometers of travel per year, equivalent to 38 trips around the earth or four trips to the moon (Shoup, Citation2011, Chapter 14).
Table 1 Studies of cruising for curb parking.
Underpriced parking creates large social costs for everyone except a few lucky drivers who happen to find a cheap space. Overpriced parking also causes problems; when curb spaces remain empty, nearby stores lose potential customers, employees lose jobs, and governments lose tax revenue. To avoid the problems caused by mispriced parking, some cities, including San Francisco, Seattle, and Washington, DC, have begun to adjust their curb-parking prices by location and time of day. The process of adjusting prices based on occupancy has been called demand-based or performance-based pricing. This pricing policy can improve the performance of both curb parking and the adjacent roads.
The Advantages of Performance-Parking Prices
San Francisco has embarked on an ambitious program, called SFpark, to get the price of curb parking right.Footnote 5 The U.S. Department of Transportation sponsored SFparkwith an $18 million grant from its Value Pricing Pilot Program to test “demand-responsive pricing to manage parking towards availability targets, enhanced parking regulation enforcement, and new parking information systems” (see the USDOT's website for its Tolling and Pricing Program, http://ops.fhwa.dot.gov/tolling_pricing/value_pricing/projects/not_involving_tolls/parking_pricing/ca_sfpark_sf.htm).
In seven pilot zones, San Francisco has installed sensors that report the occupancy of each curb space on every block and parking meters that charge variable prices according to the time of day. Using this new technology, the city adjusts parking prices in response to the occupancy rates about once every six weeks. This trial-and-error process aims to create a structure of prices that vary by time and location to produce an average occupancy rate of between 60% and 80% on every block.
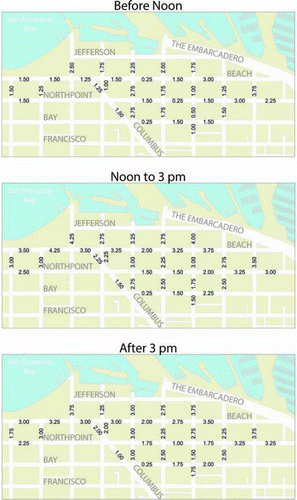
Consider the prices of curb parking on a weekday at the well-known tourist destination, Fisherman's Wharf, in May 2012 (). Each block has different prices during three periods of the day (before noon, from noon to 3 p.m., and after 3 p.m.). Before the first changes in August 2011, the price was $3 an hour at all times. By May 2012, prices on almost every block had declined for the period before noon, while most prices had increased between noon and 3 p.m. Most prices after 3 p.m. were lower than during mid-day, but higher than in the morning. The price of parking on the block on the far left of the maps in , for example, was $1.50 an hour before noon, $3 an hour from noon to 3 p.m., and $1.75 an hour after 3 p.m. A driver who arrived at 11 a.m. and parked for two hours thus paid $1.50 for the first hour and $3 for the second hour.
Figure 1 Parking prices on a weekday at Fisherman's Wharf in May 2012. (Color figure available online.)
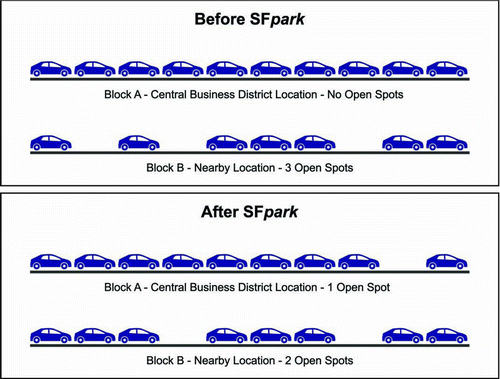
SFpark based these price adjustments purely on observed occupancy. Planners cannot predict the right price for parking on every block at every time of day, but they can use a simple trial-and-error process to adjust prices in response to occupancy rates. illustrates how nudging prices up on crowded block A and down on underoccupied block B can shift only one car to improve the performance of both blocks.
Figure 2 Performance prices create open spaces on every block. (Color figure available online.)
Will Performance Prices Change Drivers’ Behavior?
Using prices to change the behavior of only a few parkers can open up one or two spaces on every block. By reducing the need to cruise for curb parking, this small change will provide large benefits for almost everyone. As Stanford University professor Balaji Prabhakar commented about small policy changes that produce large benefits, “This is one of the nicer problems. You don't have to change everyone's behavior; in fact, it's better if you don’t” (Markoff, 2012, p. D1).
Nudging the price up on an underpriced, overcrowded block provides several important benefits. First, creating one or two open spaces will save time that drivers previously spent cruising. Shoup (Citation2011) found that, in a single year, drivers wasted 100,000 hours while cruising for underpriced curb parking in a 15-block business district in Los Angeles. Second, if fewer cars are cruising, both drivers and bus passengers will save time in less congested traffic. Third, if prices are higher, drivers will park for a shorter time, increase the turnover rate, and thus enable more cars to use the curb spaces. Fourth, some people will carpool when meter rates increase, so more customers will arrive in the cars that park at the curb. Using prices to change only a few parkers’ behavior can thus improve transportation, the economy, and the environment.
Beyond managing the on-street supply, SFpark helps to depoliticize parking by stating a clear principle for setting the prices for curb spaces. San Francisco charges the lowest prices possible without creating a parking shortage. Relying on transparent, data-based rules to set prices makes an end run around the usual politics of parking prices (). Demand sets the prices for parking, and wanting more revenue no longer justifies raising prices.
Table 2 Prices change according to occupancy rates in the previous period.
First Movers
If higher prices encourage a few parkers to move away from the most crowded blocks, who will move first? Three types of drivers are most likely to park farther away: long-term parkers, solo drivers, and those who place a low value on saving travel time. (Shoup's [2011] chapter 18 presents a model of how parking prices affect location choices.)
Vickrey (1954) noted that if prices are set to create an open space on every block, “there would be an incentive for each parker to park as far as possible in locations where the demand is light, and there will be a natural tendency for the long-term parkers to park somewhat farther away from the areas of heaviest demand” (p. 64). Long-term parkers have more to gain from moving to cheaper curb spaces. A driver who parks for four hours in a distant space that costs $1 an hour less will save $4, while a driver who parks for 15 minutes would save only 25 cents. It therefore seems likely that drivers who park for a longer time will be among the first to move to the cheaper but less convenient spaces. If someone who parks for four hours shifts to a distant space, several drivers who each park for a shorter time can use the more convenient space and save walking time.
Solo drivers will also have more to gain from shifting to cheaper curb spaces. A solo driver who parks for an hour and shifts to a more distant space that costs $1 an hour less will save $1, while a four-person carpool will save only 25 cents per person. Therefore, it seems likely that solo drivers will be among the first to move to the cheaper but less expensive spaces, while carpoolers will park in the more convenient but more expensive spaces.
Drivers who enjoy walking or who place a low value on saving time spent walking will also shift toward the cheaper spaces. For example, drivers who arrive early and have time to spare will park farther away, while drivers who arrive late will park closer. Lower-income drivers who place a lower value on saving time are also more likely to park farther away. If parking prices remain the same everywhere, lower-income drivers cannot save money by shifting their parking locations and walking farther.
SFpark thus allocates parking spaces more efficiently than uniform prices can. Short-time parkers, carpoolers, those who have difficulty walking, and those who place a high value on saving time will shift toward the more convenient parking spaces. In contrast, long-time parkers, solo drivers, those who enjoy walking, and those who place a low value on saving time will shift toward the more distant parking spaces. SFparkwill give all drivers a new opportunity to save money or time, which should benefit everyone.
Did SFpark Change Drivers’ Behavior in the Right Direction?
Following several years of planning, the San Francisco Municipal Transportation Authority (SFMTA) launched SFpark in April 2011 by installing new parking meters and extending or removing the time limits on curb spaces. The pilot program covers seven zones that contain 7,000 metered curb spaces and 14 public garages. The initial prices in each zone simply carried over from the previous, uniform pricing scheme. SFpark made the first price changes at the block level in August 2011.
Most meters operate daily from 9 a.m. to 6 p.m., with prices that vary by the time of day and between weekdays and weekends.Footnote 6 SFMTA established the desired target occupancy rate for SFpark blocks at between 60% and 80%. If average occupancy for a given period falls in this range, the price will not change in the following period. Otherwise, prices change based on occupancy rates in the preceding period according to the schedule in . The minimum price per hour on any block is 25 cents and the maximum is $6. San Francisco's pricing policy is thus data-driven and transparent, while most other cities’ pricing policies are political and opaque.
In setting a target occupancy rate, SFpark has two goals. First, curb parking will be readily available if one or two spaces are open on every block; this will prevent cruising and ensure that customers have easy access to adjacent businesses. Second, curb parking will be well used because most spaces are occupied; they will deliver as many customers as possible to the adjacent businesses. The greater the unpredictability of parking demand, the greater the conflict becomes between the two goals.
Raising the meter rates to ensure at least one vacant space most of the time will reduce the average occupancy rate. For example, large groups gathering for lunch at a restaurant may generate exceptionally high parking demand on a block on some days, so cities cannot aim for a consistently high occupancy rate of 80%–90% without often reaching 100% occupancy. Fully occupied curb parking produces unwanted cruising, while a low average occupancy means fewer customers. San Francisco set the target occupancy rate at between 60% and 80% to deal with the stochastic variation in parking demand and to balance the competing goals of reliable availability and high occupancy.
If SFpark works as intended, prices will move occupancy rates toward the target range. So how did prices affect occupancies during the first year of the program? To answer this question, we can examine how the 5,294 price changes during SFpark's first year affected occupancy rates in the subsequent periods.
The Data
SFpark made six price adjustments during the first year (). Prices increased in 32% of the cases, declined in 31%, and remained the same in 37%, with almost no change in the average price. There was, however, a pronounced spatial pattern to the changes.
Table 3 Average curb-parking prices in pilot zones on weekdays.
Prices rose during all periods for the downtown area, but fell during all periods in the Civic Center, Fisherman's Wharf, and South Embarcadero. In the other areas, prices rose during some periods and fell during others. On average, prices declined in the morning and increased in the midday and afternoon. The average price fell 1% during the first year, so SFpark adjusted prices up and down according to demand without increasing prices overall.
Before each price change, SFpark publishes data on the occupancy and prices for all curb spaces in the pilot zones.Footnote 7 The price elasticity of demand measures how these price changes affected occupancy rates. Price elasticity is defined as the percent change in the occupancy rate (the quantity parking demanded) divided by the percent change in the meter price. For example, if a 10% price increase leads to a 5% fall in occupancy, the price elasticity of demand is –0.5 (= –5% ÷ 10%).
Using data from parking meters in Seattle, Ottosson Chen, Wang, and Lin (2013) calculated the price elasticity of demand for on-street parking by time of day at the block level. Because the authors did not have data on parking occupancy, however, they inferred occupancy from the meter payment data. Our study is the first to use measured occupancy to estimate the elasticity of demand for on-street parking.
We illustrate the price elasticity of demand for curb parking by referring to the results of two SFpark price changes reported in the New York Times (Cooper & McGinty, 2012). shows the price and occupancy changes at two locations: the 600 block of Beach Street at Fisherman's Wharf and the 200 block of Drumm Street in Downtown. On Beach Street, the initial price in August 2011 was $3 an hour and the initial occupancy only 27%. By February 2012, the price had decreased to $1.75 an hour, while occupancy had increased to 56%. Because occupancy rose by 70% after the price fell by 53%, the elasticity of demand was –1.3.Footnote 8 Meter revenue rose after the price fell because demand was elastic: Higher occupancy more than offset the lower price. In this case, SFpark produced lower prices, higher occupancy, and more revenue.
Figure 3 Pricing parking by demand. Source: Cooper and McGinty, 2012. Reprinted with permission from the New York Times. (Color figure available online.)
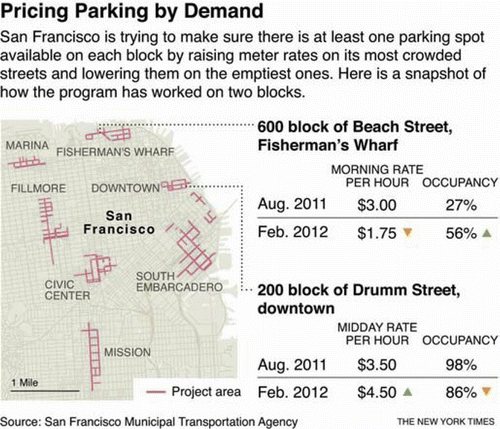
On Drumm Street, the initial price was $3.50 an hour and the initial occupancy was 98%. After the price increased to $4.50 an hour, occupancy decreased to 86%. The price elasticity of demand was –0.5 because occupancy fell by 13% after the price rose by 25%. Meter revenue increased when the price increased because demand was inelastic: Occupancy decreased by less than the price increased.
The price changes moved occupancy toward the desired goal and increased total revenue on both Beach and Drumm Streets. Nevertheless, given the target occupancy range of 60% to 80%, the price remained too low on Beach (where occupancy was only 56%) and too high on Drumm (where occupancy was 86%). This result likely occurred because prices change slowly with each adjustment (up by no more than 25 cents an hour and down by no more than 50 cents an hour), and the program had operated for only six months. The schedule of price adjustments may be too gradual in such cases.
The Results
We calculated the elasticity of demand revealed by 5,294 price changes during SFpark's first year. For each price change, we compared the old price and the average occupancy during the previous six weeks to the new price and the average occupancy during the next six weeks. We, thus, have 5,294 elasticity measurements, one for each price change during the year at each time of day and at each location. The data show that the price elasticity of demand for curb parking is far from uniform. Elasticity varies according to location, time of day, day of the week, initial price, and date of the price change. The data also show astonishing variation in the price elasticity of demand at the block level.
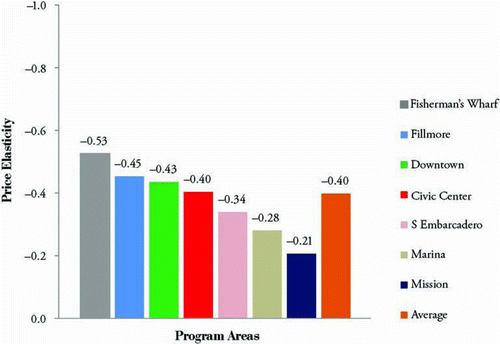
Elasticity Varies by Location. shows that the average price elasticity varies considerably across the seven pilot zones of SFpark, from –0.53 at Fisherman's Wharf to –0.21 in the Mission District. The greatest disparity appears between the mostly residential Mission and Marina zones, which are the least elastic and therefore respond least to price changes, and the predominantly commercial and office zones that are most elastic and respond the most to price changes.
Figure 4 Elasticity by location. (Color figure available online.)
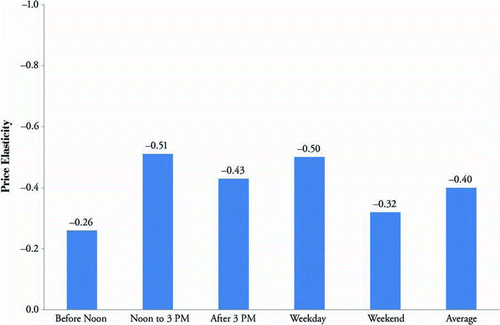
Elasticity Varies by Time of Day and Day of Week. shows that the price elasticity also varies by time of day and day of the week. Demand is less elastic in the morning than in the midday and afternoon, perhaps because many trips in the morning are to work and school while more trips later in the day are made for leisure purposes. Demand is also less elastic on the weekend than on weekdays.Footnote 9
Figure 5 Elasticity by time of day and day of the week. (Color figure available online.)
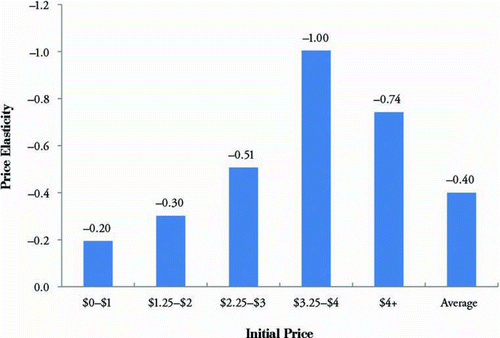
Elasticity Varies by Initial Price. shows that the elasticity also varies according to the initial price of parking before a price change. The price elasticity of demand for the cheapest parking (between $0 and $1) is very low. Elasticity increases as price rises until it reaches $4, and then declines.
Figure 6 Elasticity by initial price. (Color figure available online.)
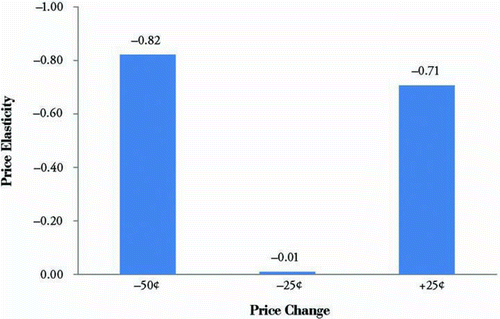
Elasticity Varies by the Size of the Price Change. SFpark adjusts prices in only three increments: +25 cents, –25 cents, or –50 cents an hour. shows that the greatest elasticity occurs after the largest price change, a reduction of 50 cents an hour. For price changes of 25 cents an hour, customers reacted more strongly to price increases than to price decreases, a phenomenon often observed in other markets (for example, see Kalyanaram and Winer, Citation1995; Thaler, Citation1985).
Figure 7 Elasticity by size of the price change. (Color figure available online.)
Elasticity Varies Over Time. shows the price elasticity of demand for parking in response to each of the first six price changes of the pilot program. The absolute value of elasticity was small after the first price change, increased dramatically after the second, and then declined following subsequent price changes.
Figure 8 Elasticity over time.(Color figure available online.)
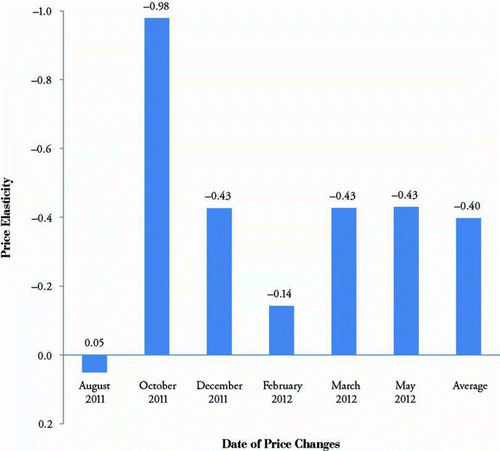
Two factors may explain the small positive elasticity after the first price change. First, many drivers probably had not heard about SFpark when the first price changes occurred in August 2011. If so, they were unaware of the lower prices available to those who were willing to walk farther from their parking spaces to their destinations. More drivers may have learned about SFpark after the second price change in October. Thus, those most willing to shift their parking locations to save money may have moved from expensive blocks to cheaper blocks to take advantage of the new options SFpark made available. After subsequent price changes, drivers who could save the most from changing their parking patterns had probably already done so, which helps to explain the declining elasticity.
A second reason for the small response after the first price change is that many factors other than price affect parking demand and supply (for example, seasonal variations, street closures, construction projects, and parking bans for special events like parades). Therefore, if the price changes had little effect on demand in August 2011, all these other factors may have swamped the response to price changes.
Elasticity Varies Greatly After Individual Price Changes. The previous calculations reflected the average elasticities of demand for price changes at different locations, times of day, initial prices, sizes of price changes, and dates. These average elasticities varied over a wide range of values, from +0.05 to –0.98 (). When we plot the elasticity of demand for individual price changes at the block level, we find astonishing variety. shows the distribution of the price elasticities calculated for 5,294 individual price and occupancy changes on 1,492 city blocks.
Figure 9 Distribution of elasticities for 5,294 price changes. (Color figure available online.)
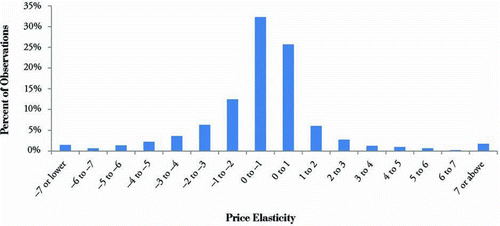
The wide range of price elasticities suggests, as one would expect, that many variables other than price affect parking demand. In many cases, the price elasticity was positive, which means that occupancy either rose after prices rose or fell after prices fell. Higher prices do not cause higher occupancy and lower prices do not cause lower occupancy, so other factors must have overwhelmed the effects of prices on occupancy in the cases of positive price elasticity. The wide range of elasticity at the block level also suggests that the circumstances on individual blocks vary so greatly that planners will never be able to develop a robust theoretical model to predict the correct prices needed to achieve the target occupancy for every block. Instead, the best way to achieve target occupancy is to do what SFpark does: Adjust prices in response to the observed occupancy. This simple trial-and-error method mirrors how other markets establish prices, so it should also work in the market for on-street parking.
We can further illustrate the difficulty of predicting the right price of parking by examining the variation in price elasticity of demand in the Civic Center on weekday mornings during the first year of SFpark. shows the 10 city blocks with the largest range of elasticity. All are located within a short walk from City Hall.Footnote 10 Yet, even on the same block and at the same time of day, elasticity varies greatly.
Table 4 Blocks with largest elasticity range in Civic Center on weekday mornings.
For instance, on the 200 block of Van Ness Avenue the initial average occupancy was 33% on weekday mornings. After the price fell from $3.00 to $2.75 an hour, occupancy rose to 47%, yielding a price elasticity of –4.0. In the subsequent period, even though the price dropped to $2.50 an hour, occupancy fell to 20%, yielding an elasticity of +8.5. Powerful factors other than price must have influenced demand on this block. Because demand is clearly site-and-time specific, there is no way to measure the aggregate demand for curb parking and no way to set the right prices other than by aiming for the right occupancy.
Have the Occupancy Rates Moved Toward the Goal?
Occupancy data in the first year of the program suggest that SFpark has made considerable progress toward solving the important problems of severe overcrowding on some blocks and very low occupancy on others. shows that, on severely under- and overoccupied blocks (those with initial occupancy rates below 30% or above 90%), the price changes tended to move occupancy in the right direction in the subsequent period. Occupancy on the underoccupied blocks rose after two thirds of the price decreases, and occupancy on the overcrowded blocks fell after two thirds of the price increases.
Table 5 Improvement in the occupancy rates on under- and overoccupied blocks.
Removing the Obstacles to Performance Pricing
SFpark has moved occupancy rates in the right direction, but this is only the beginning. SFpark can do more to provide information to drivers, to prevent abuse of disabled placards, and to demonstrate the equity of the program.
Information About Performance Prices
Because parking prices and availability can vary greatly within a short distance, drivers need real-time information on prices and availability to park in the optimal spots. (If SFpark achieves its goal of open parking spaces on every block, drivers can choose parking location only by price.) On its website, SFpark publishes maps that show the price and availability of parking on every block at each time of day (as in ), and it makes the same information available on smart phones. In addition, anyone can enroll to receive email messages from SFpark when prices change. Nevertheless, many drivers, especially tourists, remain unaware of these price variations and thus miss the opportunity to save money by walking a few blocks from their cars to their destinations. If most drivers do not know that parking prices vary by location and time of day, SFpark will not easily achieve the desired one or two open spaces on each block.
Many drivers may think it is not worth the effort to research parking prices to get the best deal possible. These drivers are not irrational, but rather are displaying what economists call rational inattention (for example, see Wiederholt, Citation2010). Parking for a short time does not cost much, and drivers who automatically park close to their destinations without thinking hard about prices are not necessarily making bad choices. Instead, they are saving time and energy by taking advantage of the open spaces they see, demonstrating their inelastic demand for parking. Everyone buys some things without doing the research necessary to learn about all the cheaper or better alternatives.
SFpark aims to improve parking and transportation, not to ensure that every driver achieves the optimal combination of cost and convenience when choosing a parking space. Nevertheless, SFpark provides more information about on-street parking prices than is available about the geography of prices for almost anything else in the city. Parking also makes a lively topic of conversation, which is another way to learn about prices. Consequently, most drivers who park frequently in an area will learn which blocks are cheaper and which are more expensive. Even if only a few parkers learn that they can save money by walking farther, small changes by these parkers can produce a few open spaces everywhere (see ). By reducing the need to cruise for scarce curb parking, SFpark can thus save time for parkers, reduce congestion, speed up public transit, and improve transportation for almost everyone.
Although SFpark makes the parking market more efficient, it cannot guarantee that everyone will choose the optimal parking space. Technology is advancing rapidly, however, and automobile guidance systems can easily incorporate pricing data from SFpark (SFpark encourages people to develop apps and software using their data at http://sfpark.org/how-it-works/open-source-data/). Drivers may soon be able to input their destinations, the length of time they want to park, and how much they value time spent walking from their parking spaces to their destinations. When they approach their destinations, the guidance systems will give them turn-by-turn voice directions to the optimal curb or off-street parking space. The system will then show the best walking route to and from their destination. As communications systems become cheaper and easier to use, more drivers will use finer-grained information to make better transportation and parking choices. When that time comes, occupancy rates will respond more quickly to curb-parking prices, and SFpark will come closer to achieving its goals.
SFpark is a work in progress, but the information it produces may eventually convert curb parking from a frustrating source of congestion and pollution into one of the most efficient transportation markets in the 21st century.
Disabled Placard Abuse
The staff of SFpark report that widespread abuse of disabled parking placards helps to explain why occupancy does not reliably respond to price changes. California allows all drivers with disabled placards to park free for an unlimited time at parking meters, so higher prices increase the temptation to abuse placards. Raising prices on crowded blocks may simply drive out paying parkers and make more spaces available for placard abusers. If so, prices will not reduce occupancy, and the price elasticity of demand will remain artificially low.
Reforms in other states show how California can prevent placard abuse at parking meters. In 1995, Michigan adopted a two-tier placard system that takes into account different levels of disability. Drivers with severe disabilities receive special placards allowing them to park for free at meters. Drivers with less severe disabilities receive ordinary placards and must pay (Michigan Secretary of State, 2011). Before this reform, Michigan had issued 500,000 disabled placards that allowed all users to park free at meters. After the state enacted its two-tier reform, only 10,000 people (2% of the previous placard holders) applied for the special placards that allow free parking at meters. Enforcement is easy because an able-bodied driver who misuses the distinctive severely disabled placard is conspicuously violating the law. Illinois adopted a similar two-tier placard reform in 2012 (Illinois General Assembly Public Act 097-0845, 2013).
Equity in Performance Pricing
While it is clear that performance-parking prices can improve transportation efficiency, are they fair? In San Francisco, 30% of households do not own a car, so they do not pay anything for parking (U.S. Census Bureau, 2010). How the city spends its parking revenue also affects the equity implications of charging for parking.Footnote 11 San Francisco uses all its parking meter revenue to subsidize public transit, so if SFpark increases parking revenue, higher-income drivers who park at the curb will subsidize lower-income families who rely on public transit. Also, because buses are often mired in traffic congested by drivers who are cruising for underpriced curb parking, SFpark will further aid bus riders by reducing traffic congestion and increasing bus speeds.
Performance pricing is not price discrimination, which is a strategy of charging different people different prices for the same thing. All drivers who park on the same block at the same time pay the same price. Performance pricing is also not the same as maximizing revenue. shows that the average price of parking fell by 1% during the first year of SFpark. Because demand was, on average, inelastic (−0.4), the city could increase revenue by charging higher prices. SFpark's goal, however, is to optimize occupancy, not to maximize revenue.
Charging demand-responsive prices for curb parking has even more obvious implications for fairness in developing countries. Mexico City, for example, is in the process of adopting a system like SFpark to solve the problems caused by underpriced and overcrowded curb parking. The current system leads many drivers to feel they have no alternative to parking illegally. Although, perhaps exaggerating the problem, the Los Angeles Times describes this chaotic parking situation: “Cars dominate nearly every square inch of Mexico City's public space. Drivers double- and triple-park on the streets, to say nothing of curbs, sidewalks, gardens, alleys, boulevards and bike paths” (Dickerson, 2004, p. 26).
Policies like SFpark will achieve progress toward fairness in Mexico City and in many other cities worldwide for two reasons. First, fewer than half of households in Mexico City own a car, and households with a car have an average income more than twice that of households without a car.Footnote 12 Therefore, charging performance prices for curb parking and spending the revenue to pay for public services (e.g., public transport and sidewalk improvements) will help the majority of poorer households without cars at the expense of richer households who now park free on the streets and sidewalks. Performance-parking prices will also reduce traffic congestion and, thus, improve the lives of all transit riders, pedestrians, and cyclists.
To defend free parking on streets and sidewalks, car owners sometimes rhetorically push poor people in front of them as human shields, claiming that charging for parking will harm the poor. This is inaccurate. Free curb parking limits the revenue available to pay for public services, and poor people cannot replace public services with private purchases as easily as richer people can. The poorest cannot afford cars, but they do benefit from public services, such as public transport, that parking revenues can finance. Using curb-parking revenue to pay for local public services is much fairer than keeping curb parking free, losing the revenue needed to pay for public services, creating chaotic parking problems on busy streets, and increasing traffic congestion caused by drivers who are searching for free parking. Claiming that performance-parking prices will harm the poor defends a narrow special interest by feigning a concern for the broad public interest.
Two Suggested Improvements
Our findings suggest at least two ways to improve SFpark: 1) refine its periods of operation and 2) shift from reaction to prediction in setting prices.
Refine the Time Periods
Most meters stop operating at 6 p.m., so anyone who arrives at 5 p.m. and pays for one hour can park all night. Drivers who park during the evening thus have an incentive to arrive during the last hour of meter operation while a few open spaces are still available. Since SFpark sets the price to achieve an average target occupancy for the three-hour period from 3 p.m. to 6 p.m., a price can be too high at 4 p.m. (and occupancy too low) but too low at 5 p.m. (and occupancy too high).
Operating the meters in the evening for as long as they are needed to achieve the optimal occupancy can solve this problem. Free parking after 6 p.m. is a holdover from the days when meters had one- or two-hour time limits to increase turnover during the daytime. Most businesses closed by 6 p.m., so they did not need parking turnover at night. Because older meters could not charge different prices at different hours or have different time limits at different times of day, free parking in the evening made sense.
Because many businesses are now open in the evenings, and meters can charge variable prices and have variable time limits (or no time limits), the old rationale for free parking in the evening no longer applies. Meters in the Port of San Francisco operate until 11 p.m., and several other cities operate their parking meters until midnight in the busiest areas, so SFpark will not break new ground by extending its meter hours past 6 p.m. The purpose of metering in the evening is to prevent shortages, not to create turnover.
If SFpark is a good policy before 6 p.m., it does not become a bad policy after 6 p.m. Because the occupancy sensors and parking meters are already in place for the pilot program, it seems unwise to cease operating at 6 p.m. simply because the old meters did. If pricing to achieve the optimal parking occupancy reduces cruising, congestion, traffic accidents, energy waste, air pollution, and greenhouse gases, San Francisco can incrementally extend metering to additional hours when it will also provide these same benefits. shows that SFpark has not increased curb-parking prices overall, so the major benefit is better management, not higher revenue from the existing meters. Nevertheless, higher revenue can come from installing more meters and extending meter hours. In 2013, the city extended meter operation to include Sundays, so SFpark increased meter revenue without increasing the average meter rates.
Taking this process to its logical end, SFpark can continually refine its pricing strategy to fit the demand on specific blocks at different times of the day across different days of the week. Matching prices to narrow demand windows will increase the efficiency of the program.
Shift from Reaction to Prediction
The wide range of occupancy changes after each price change shows that many factors other than price affect parking demand. Therefore, basing the next period's parking prices only on the previous period's occupancy rates will not reliably achieve target occupancy goals. For example, SFpark should not increase prices in January because occupancy rates were high during the Christmas shopping season. Seasonal adjustments based on occupancy rates in previous years may greatly improve the program's performance.
SFpark can also adjust prices for other predictable factors, such as construction projects that reduce the parking supply or events that increase demand. SFpark already charges special prices during San Francisco Giants games at AT&T Park: $7 an hour for spaces closest to the ballpark, and $5 an hour for spaces farther away. For major public events, such as San Francisco's Gay Pride Parade that attracts over a million revelers to the city streets, SFpark charges up to $18 an hour for curb parking. The current policy of charging special prices for special events thus provides a precedent for setting other prices based on expected demand. Shifting from reaction to prediction in adjusting parking prices may allow SFpark to keep parking occupancy closer to the target rates. Like hockey players who skate to where the puck is going, SFpark can price parking based on future demand, not simply on past occupancy.
Conclusion: A Promising Pilot Program
SFpark was established as a pilot program to examine the feasibility of adjusting prices to achieve availability targets. SFpark appears to be meeting this goal, and other cities are watching the results closely. Los Angeles has already adopted a similar program called LA Express Park (see http://www.laexpresspark.org/).
As a test of new transportation technology, SFpark is similar to the trial runs of congestion pricing programs in London, Singapore, and Stockholm. In comparison to congestion pricing, however, SFpark has shown that parking pricing is relatively simple and cheap. Cities can adopt programs like SFpark even if they do not yet have all the resources and political will to adopt congestion pricing. In effect, performance-parking prices are a poor man's congestion pricing, and they may represent a step toward full congestion pricing.
SFpark shows the value of the U.S. Department of Transportation's Value Pricing Pilot Program. With a federal grant of $18 million (one new parking garage can cost far more), SFpark has shown an entirely new way to manage on-street parking.Footnote 13 Unfamiliarity may explain some skepticism about performance-parking prices, and only the experience gained in pilot programs will change minds. Once drivers see that prices decline as well as increase, they may appreciate the availability of open curb spaces and learn to use information on prices to optimize their parking choices for every trip. What seemed unthinkable in the past may become indispensable in the future.
With performance-parking prices, drivers will find places to park their cars just as easily as they find places to buy gasoline. But drivers will also have to think about the price of parking just as they now think about the prices of fuel, tires, insurance, registration, repairs, and cars themselves. Parking will become a part of the market economy, and prices will help manage the demand for cars and driving.
If SFpark succeeds in setting prices to achieve the right occupancy for curb parking, almost everyone will benefit. Other cities can then adopt their own versions of performance-parking prices. Getting the prices for curb parking right can do a world of good.
Acknowledgments
We are grateful to Eric Agar, Heather Jones, Jay Primus, Chirag Rabari, Justin Resnick, Hank Willson, and two anonymous referees for their excellent editorial advice. We are also grateful to Hyeran Lee for assistance with the graphic art. The University of California Transportation Center provided financial support for our research.
Notes
1. In Boston, for example, the meters charge $1.25 an hour throughout the city. Glaeser (2013) explains the problems with this policy.
2. In a preface to the article, the editor wrote about Vickrey's proposal that “unfortunately, the complexity of the system proposed is that there is much room for doubt as to its practicability” (1954, p. 62).
3. The title of Vickrey's 1992 Presidential Address to the Atlantic Economic Society was “My Innovative Failures in Economics” (Vickrey, Citation1993). He noted that demand-determined parking prices were his first venture into marginal-cost pricing, one of the many ideas for which he received the Nobel Prize in Economics in 1966.
4. Weitzman (Citation1974) demonstrates why the price and quantity approaches produce the same outcome.
5. The San Francisco Municipal Transportation Authority (2011) explains how SFpark was established and how it works in more detail.
6. A few meters operate from 7 a.m. to 6 p.m., meters in Fisherman's Wharf operate from 7 a.m. to 7 p.m., and some meters in the Port of San Francisco operate from 7 a.m. to 11 p.m.
7. Newspapers, radio, and television are other sources of information that frequently report on SFpark. Some residents of San Francisco seem obsessed about parking, as suggested by a recently published 168-page guide to parking in the city (Labua, Citation2011).
8. We used the midpoint formula to measure the price elasticity of demand because it provides the same result regardless of the direction of the price change. See Krugman and Wells (Citation2005), for example, for a discussion of the midpoint formula for the price elasticity of demand.
9. The generally higher levels of traffic congestion in the afternoon and on weekdays may also help to explain the more elastic demand for parking at those times. If traffic is more congested, a smaller increase in the price of parking may tip the decision against driving for less essential trips.
10. We tried to explore whether these blocks were subject to abnormal exogenous shocks in this time period, such as special events, building construction, or street closures. Our search did not turn up any abnormalities, but we still cannot rule this out as a possibility.
11. Goodwin (Citation1989, 1997), Small (Citation1992), and King, Manville, and Shoup (2007) emphasize that the use of the revenue from charges on cars (either from congestion tolls or parking meters) strongly affects both the equity and political popularity of the charges.
12. The 2010 Mexican National Institute of Statistics and Geography census found that 46% of households in Mexico City owned at least one car. Families in Mexico City who owned at least one car had an average income of 29,280 pesos (U.S. $2,236) per month; families who did not own a car had an average income of only 11,560 pesos (U.S. $883) per month.
13. For example, in 2002, UCLA built a new 1,500-space parking structure for $47 million (Shoup, Citation2011).
Related Research Data
References
- Arnott , R. and Inci , E. 2006 . An integrated model of downtown parking and traffic congestion . Journal of Urban Economics , 60 ( 3 ) : 418 – 442 .
- Cooper , M. and McGinty , J. C. 2012, March 15 . A meter so expensive, it creates parking spots . New York Times , : A1
- Dickerson , M. 2004, December 26 . Mexico's economy is vrooming . Los Angeles Times , : 26
- Glaeser , E. 2013, February 7 . Boston's plague of cheap parking . Boston Globe , Retrieved from http://www.bostonglobe.com/opinion/2013/02/07/boston-plague-cheap-parking/XxeQ6jvF6D0yuEX0HIquaK/story.html
- Goodwin , P. 1989 . The rule of three: A possible solution to the political problem of competing objectives for road pricing . Traffic Engineering and Control , 30 ( 10 ) : 495 – 497 .
- Goodwin , P. 1997 . Inaugural lecture for the professorship of transport policy , University College London . Retrieved from http://www.cts.ucl.ac.uk/tsu/pbginau.htm
- Goodwin , P. 2001 . “ Traffic reduction ” . In Handbook of transport systems and traffic control , Edited by: Button , K. and Hensher , D. 21 – 32 . Amsterdam , , The Netherlands : Pergamon .
- Illinois General Assembly . Public Act 097-0845. Amendment to Illinois Vehicle Code (January 1, 2013). Retrieved from http://www.ilga.gov/legislation/publicacts/97/pdf/097–0845.pdf
- Kalyanaram , G. and Winer , R. 1995 . Empirical generalizations from reference price research . Marketing Science , 14 ( 3 ) : G161 – G169 .
- King , D. , Manville , M. and Shoup , D. 2007 . The political calculus of congestion pricing . Transport Policy , 14 ( 2 ) : 111 – 123 .
- Klein , D. , Moore , A. and Reja , B. 1997 . Curb rights: A foundation for free enterprise in transit , Washington, DC : The Brookings Institute .
- Krugman , P. and Wells , R. 2005 . Microeconomics , New York, NY : Worth .
- Labua , D. 2011 . Finding the sweet spot, the insiders guide to parking in San Francisco , Sausalito, CA : Terrapin Books .
- Markoff , J. 2012, June 11 . Incentives for drivers who avoid traffic jams . New York Times , : D1
- Mexican National Institute of Statistics and Geography . 2010 . Census of population and housing , Retrieved from http://www.inegi.org.mx/default.aspx
- Michigan Secretary of State . 2001 . Disability parking. , Retrieved from http://www.michigan.gov/documents/disability_brochure_33616_7.pdf
- Ottosson , D. , Chen , C. , Wang , T. and Lin , H. 2013 . The sensitivity of on-street parking demand in response to price changes: A case study in Seattle, WA . Transport Policy , 25 : 222 – 232 .
- San Francisco Municipal Transportation Authority . 2011 . SFpark: Putting theory into practice , Retrieved from http://sfpark.org/wp-content/uploads/2011/09/sfpark_aug2011projsummary_print-2.pdf
- Shoup , D. 2011 . The high cost of free parking. , Chicago, IL : Planners Press .
- Small , K. 1992 . Using the revenues from congestion pricing . Transportation , 19 ( 4 ) : 359 – 381 .
- Thaler , R. 1985 . Mental accounting and consumer choice . Marketing Science , 4 ( 3 ) : 199 – 214 .
- Thompson , W. 1968 . The city as a distorted price system . Psychology Today , 2 ( 3 ) : 28 – 33 .
- U.S. Census Bureau . 2010 . American Community Survey: City of San Francisco , Retrieved from http://factfinder2.census.gov/faces/tableservices/jsf/pages/productview.xhtml?src = bkmk
- Vickrey , W. 1954, November . The economizing of curb parking space . Traffic Engineering , : 62 – 67 .
- Vickrey , W. 1993 . My innovative failures in economics . Atlantic Economic Journal , 21 ( 1 ) : 1 – 9 .
- Vickrey , W. 1994 . Statement to the Joint Comittee on Washington, DC, Metropolitan Problems . Journal of Urban Economics , 36 : 42 – 65 .
- Weitzman , M. 1974 . Prices versus quantities . Review of Economic Studies , 41 ( 4 ) : 477 – 491 .
- Wiederholt , M. 2010 . “ Rational inattention ” . In The new Palgrave dictionary of economics (online ed.) Edited by: Durlauf , S. N. and Blume , L. E. Retrieved from http://www.dictionaryofeconomics.com/article?id=pde2010_R000281