
Abstract
Problem, research strategy, and findings: Historical patterns of discrimination and disinvestment have shaped the current landscape of vulnerability to heat in U.S. cities but are not explicitly considered by heat mitigation planning efforts. Drawing upon the equity planning framework and developing a broader conceptualization of what equity means can enhance urban heat management. Here I ask whether areas in Baltimore (MD), Dallas (TX), and Kansas City (MO) targeted for disinvestment in the past through practices like redlining are now more exposed to heat. I compare estimates of land surface temperature (LST) derived from satellite imagery across the four-category rating system used to guide lending practices in cities around the United States, summarize the demographic characteristics of current residents within each of these historical designations using U.S. Census data, and discuss the connection between systematic disinvestment and exposure to heat. LST and air temperatures are not equivalent, which makes it difficult to reconcile existing research on the human health impacts of heat exposure that rely on a sparse network of air temperature monitoring stations with more granular LST data. Areas of these cities that were targeted for systematic disinvestment in the past have higher mean land surface temperatures than those that received more favorable ratings. Poor and minority residents are also overrepresented in formerly redlined areas in each of the three study cities.
Takeaway for practice: By examining areas that have experienced sustained disinvestment, cities may be able to more quickly narrow the focus of heat mitigation planning efforts while furthering social equity. Efforts to mitigate the negative impacts of rising temperatures in U.S. cities must be tailored to the local climate, built environment, and sociodemographic history. Finally, geospatial data sets that document historical policies are useful for centering and redressing current inequalities when viewed through an equity planning lens.
Centering Equity in Urban Heat Management
The Fourth National Climate Assessment, released in November 2018, identified extreme heat among the most serious threats to human health in urban areas across the United States (Reidmiller et al., Citation2018). Similarly, a recent review of the human health impacts of heat concluded that “given projected changes in population, urbanization, and demography, heat will continue to be a substantial public health issue in the decades to come in both the developed and developing worlds” (Sheridan & Allen, Citation2018, p. 9). In the United States, the Centers for Disease Control (Citation2017) estimates that more than 600 people are killed by extreme heat each year. Though this may not seem a large number, heat accounted for almost as many deaths as flooding and hurricanes combined and was the single largest cause of weather-related fatalities between 1986 and 2017 (National Weather Service, Citation2018). The most recent climate assessment notes that low-income and marginalized groups with “lower capacity to prepare for and cope with extreme weather and climate-related events” will continue to be most affected, and that “adaptation actions for the most vulnerable populations” should be prioritized (Reidmiller et al., Citation2018, p. 25). Although there is evidence that equity is receiving more attention in planning discourse, “many U.S. cities continue to ignore equity goals as part of their climate and sustainability plans, or at least treat them as secondary or tertiary goals relative to environmental and economic goals” (Schrock et al., Citation2015, p. 287). A more recent study also concluded that equity is not prioritized and that “the uneven impacts of hazards on socially vulnerable populations” are often ignored by formal planning efforts (Berke et al., Citation2019). As cities around the United States begin to more explicitly address the threat posed by extreme heat, strategies for better integrating equity into these planning and mitigation efforts are needed (Agyeman, Citation2005; Schlosberg & Collins, Citation2014).
Urban planners must think differently about how equity dimensions are framed to support advocacy at the local level and to elevate equity goals within the climate adaptation and sustainability planning discourse. The equity planning model emphasizes centering social problems like poverty and segregation, recognizing planning practice as inherently political, and leveraging information and analysis to influence decision makers (Krumholz, Citation1982). Equity planning requires each practitioner to be “not only a technocrat but an advocate within public institutions,” integrating clearly defined principles and measurable goals into established decision-making processes (Zapata & Bates, Citation2017, p. 412). This approach, coupled with more recent scholarship on how equity is framed in resilience planning, identifies a way forward (Chu et al., Citation2017; Meerow et al., Citation2019). Connecting current disparities in heat exposure to past decisions and policies brings a procedural and recognitional equity lens to bear and forcefully makes the case for planning interventions to redress long-standing injustices (Meerow et al., Citation2019).
In this article I focus on two related questions: 1) Are areas that experienced systematic disinvestment driven by racial bias in the past currently more exposed to heat? 2) How can geospatial data that reflect historical practices like redlining1 be used to inform climate adaptation and sustainability planning efforts? I hypothesize that systematic disinvestment exemplified by historical redlining is detectable in uneven patterns of heat exposure in contemporary U.S. cities. The differential access to mortgage credit and other funds characteristic of redlining (Crossney & Bartelt, Citation2005; Hillier, Citation2003) codified existing stigma and compounded the effect of formal and informal racial, ethnic, and income segregation practices in the intervening decades.
Redlining is worth examining because in addition to reflecting systematic bias, it was widespread in its geographic reach, and new data sets make it possible to examine its relationship to an array of contemporary urban challenges. The persistent social, economic, and environmental effects of redlining (Hoffman et al., Citation2020; Rutan & Glass, Citation2018) reflect both the historical importance of housing as a primary vehicle for wealth creation and the privileged position of single-family residential uses within the hierarchy of Euclidean zoning (Moga, Citation2017). These and other factors warrant approaching heat mitigation not only from a vulnerability perspective but also through the lens of environmental justice2 and the related concepts of procedural and recognitional equity (Meerow et al., Citation2019).
Using residential security maps created by the Home Owners’ Loan Corporation (HOLC) in the late 1930s as a proxy for redlining, I compare estimates of land surface temperature (LST) derived from Landsat 8 satellite imagery across the four-category rating system used to guide lending practices for decades in more than 250 cities around the United States. Specifically, I use evidence from Baltimore (MD), Dallas (TX), and Kansas City (MO) to assess the relationship between past patterns of disinvestment and present exposure to heat and then describe mechanisms linking historical practices like redlining to uneven exposure to heat in these cities. I argue that the equity planning framework can be used to better integrate equity considerations into urban heat management efforts, as well as broader climate adaptation and sustainability planning. The legacy of redlining is observable in the distribution of LST within each of the three cities considered, and geospatial data sets like those created by the Mapping Inequality project make it possible to link past policies to current inequalities, consistent with Krumholz’s (Citation1982) articulation of equity planning.
Health Effects and Risk Factors of Heat Exposure
A significant literature from the public health and medical fields documents the effects of extreme heat on the human body (Hajat et al., Citation2010; Kovats & Hajat, Citation2008; Zanobetti & O’Neill, Citation2018). Rising temperatures can overwhelm the body’s capacity to cool itself, leading first to heat exhaustion—dizziness, muscle cramping, fainting—and, if untreated, to heat stroke. In the United States, heart disease is leading cause of death (Kochanek et al., Citation2017), and individuals with this condition are particularly vulnerable during a heatwave because the heart beats faster in an attempt to regulate body temperature (Hajat et al., Citation2010). The urban heat island (UHI) effect (Oke, Citation1973) intensifies heat stress in cities, and higher temperatures can also make air pollution worse (Harlan & Ruddell, Citation2011). The UHI effect describes the phenomenon in which temperatures in developed areas are elevated compared with that of more rural surroundings (Oke, Citation1973; Stone & Rodgers, Citation2001). On average, surface temperatures in developed areas can range from 18 °F to 27 °F hotter during the day and from 9 °F to 18 °F warmer at night than in rural areas (U.S. Environmental Protection Agency, Citation2008). The extent and nature of urban development affects the UHI effect, as does a city’s geographic location and local weather patterns. The health and mortality impacts of extreme heat are consistently higher among the elderly, racial minorities, those with chronic illnesses, and low-income groups (Curriero et al., Citation2002; Ebi et al., Citation2018; Jones et al., Citation1982). However, social factors like living alone, fear of crime, and linguistic isolation are gaining attention as important contributors to heat vulnerability and as risk factors for heat-related illness and mortality in their own right (Gronlund, Citation2014; Klinenberg, Citation2015).
Managing Urban Heat
Characterizing heatwaves as natural hazards ranks among the oldest planning responses to urban heat and serves as a clear antecedent for climate adaptation planning (Burton et al., Citation1978). Under the natural hazard mitigation planning paradigm, local planning decisions aim “to lessen exposure to risk from natural hazards” through mitigation and recovery actions (Bedsworth & Hanak, Citation2010, p. 480; Berke, Citation2014). In the case of extreme heat, mitigation might include preserving and expanding tree canopy or albedo modification, whereas recovery strategies involve minimizing suffering by opening cooling centers. Since the establishment of the Intergovernmental Panel on Climate Change in 1988, understanding of climate has changed. A broader awareness of its dynamism has changed the planning response to heat; specifically, heat mitigation planning has been driven by a conceptual model of vulnerability to heat that emphasizes exposure, sensitivity, and adaptive capacity (Turner et al., Citation2003; Wilhelmi & Hayden, Citation2010). This orientation is encapsulated in the new term urban heat management, which refers to “an ongoing function of municipal governments designed to physically reduce the intensity and duration of heat exposure both during and outside of periods of extreme heat” (Stone et al., Citation2019) by proactively engaging in tree planting or adopting cooling materials (e.g., high albedo and high emissivity) to reduce exposure. Mapping vulnerability to heat as a means of geographically targeting interventions like these has also grown in popularity, but heat vulnerability mapping has been the target of criticism as well.
For example, a recent study argues against using composite indices derived from census data to visualize the location of vulnerable populations during a heatwave because they do not perform well (r = 0.03) in terms of approximating mortality estimates generated from climate models (Mallen et al., Citation2019). The authors also conclude that the underlying census data indicators themselves (e.g., age, race, poverty, air conditioning access) may be better suited for use as proxies for heat-related mortality and that mapping these individual risk factors associated could be useful for identifying and selecting among heat management strategies. It may seem that rather than measuring heat vulnerability at all, a single factor like the poverty rate could be used to guide climate adaptation and sustainability planning efforts. Though poverty is an important indicator of adaptive capacity and predictor of vulnerability to heat, it is not a sufficient criterion to guide urban heat management. The spatial distribution of poverty in U.S. cities has changed significantly in the past 2 decades (Kneebone & Berube, Citation2013), and relying on this criterion alone minimizes the importance of exposure and sensitivity aspects of heat vulnerability.
Here I argue that pursuing urban heat management through the lens of equity planning represents an important opportunity for the field. Confronting the role of past policies and planning interventions in creating the inequalities we observe today and then harnessing data as a means of “redressing the impacts with targeted remedial action and resources” (Cutter, Citation1995, p. 112) is consistent with Krumholz’s (Citation1982) articulation of equity planning. Such an approach offers clear guidance for planning practice that draws upon familiar conceptual scaffolding while centering equity considerations in climate adaptation and sustainability planning efforts.
Environmental Inequality and Redlining
Just as prior research has established that the negative consequences of urban development are not evenly distributed, ecosystem services and the benefits they provide are socially produced, inviting questions of access, prioritization, and participation (Bullard & Wright, Citation1993; Clark et al., Citation2014; Ernstson, Citation2013). Racial discrimination and persistent patterns of residential segregation shape access to amenities like parks and greenspace in cities as well as the ecological benefits such as climate regulation they provide (Haase et al., Citation2014; Rigolon & Németh, Citation2018). For example, access to and ability to pay for air conditioning (Hayden et al., Citation2011; Sailor et al., Citation2019) as well as the temperature-moderating effect of tree canopy and vegetative cover are important indicators of adaptive capacity with respect to urban heat (Sailor et al., Citation2019; Stone, Citation2012).
Koo et al. (Citation2019) argue that urban tree canopy is a public good that is capitalized into real estate prices and affords a variety of ecological and health benefits, from filtering air pollutants to mitigating heat (Hogrefe et al., Citation2004; Stone, Citation2005). Given that trees and vegetation contribute to adaptive capacity, this represents an important conceptual linkage between hazard mitigation, urban heat management, and environmental equity. Urban form also shapes climatic conditions in cities, which is significantly influenced by planning through regulatory factors (e.g., building codes, design guidelines, and land use controls) and procedural factors (e.g., public financing, eminent domain; Heris et al., Citation2019). My central argument here is that the unevenly distributed heat exposure in cities observed today is due in part to past planning and investment decisions that shaped the location and character of urban development and, by extension, the distribution of ecological benefits.
Observed intracity variations in heat exposure are directly influenced by factors such as land cover, urban form, and local climatic conditions. Urban planning plays a role in shaping these aspects of the physical environment as well as household locations, alongside other determinants like state and federal policy, market forces, and individual preferences. Hoffman et al. (Citation2020) summarize the underlying mechanisms through which this influence has occurred, including “federal programs that provided incentives for major roadway and building construction projects” often in “the lowest income neighborhoods of cities” (p. 10) involving heat-retaining materials like asphalt, brick, and cinder block. Land use planning and administrative tools like zoning have been connected to UHIs and microclimate more generally through their direct influence on the location, density, mix, and construction materials of buildings in urban areas (Coseo & Larsen, Citation2014; Heris et al., Citation2019; Kim et al., Citation2019; Stone, 2012; Stone & Norman, Citation2006). However, there is relatively little literature on the impacts of historical policies and planning interventions and even fewer studies that discuss how planning should engage those legacies.
In the United States, the practice of redlining and federal policies facilitating suburban development for the White middle-class had a monumental effect on shaping cities and regions during the postwar period (Fishman, Citation2000; Jackson, Citation1985). Hillier (Citation2003) details the impacts of the HOLC on housing markets and patterns of investment following its establishment as part of the New Deal in 1933. The original purpose of the HOLC was to provide relief for households at risk of foreclosure or who had already lost their homes, but HOLC staff were eventually tasked with working with local realtors to assess the level of risk for banks making real estate loans in U.S. cities. They created maps with a four-class typology of investment risk in which “areas with African Americans, as well as those with older housing and poorer households, were consistently given a fourth grade, or ‘hazardous,’ rating and colored red” (Hillier, Citation2003, p. 395). For decades, homeownership was a primary vehicle for household wealth building, and policies like this exacerbated the racial wealth gap over time (Krivo & Kaufman, Citation2004). Recent studies of Baltimore and Pittsburgh (PA; Rutan & Glass, Citation2018) demonstrate the long-lasting effect of redlining and sustained patterns of disinvestment.3 It is possible that areas redlined decades ago have built environment characteristics that exacerbate heat exposure today. For example, high-speed roadway construction in poor and minority communities during the 1960s (Mohl, Citation2004) would likely have increased impervious surface coverage. There is a higher probability of finding trees on the parcels of owner-occupied housing units (Heynen et al., Citation2006), underscoring the importance of access to mortgage lending. As Pellow (Citation2000) and others argue, understanding how environmental inequalities are produced is critically important in devising strategies to dismantle and repair them.
A report released by the Congressional Black Caucus in Citation2004 finds that the negative consequences of climate, including heat-related deaths and illness, are likely to disproportionately affect African Americans living in cities across the United States. Similarly, Harlan et al. (Citation2006) find “a pattern of positive correlations between heat stress exposure and percentages of poor and minority inhabitants” (p. 2860) and that marginalized populations faced much higher risk from extreme heat. Mitchell and Chakraborty (Citation2014) use Landsat imagery to estimate land surface temperature in Pinellas County (FL) and find that census tracts with more poor and minority residents are also exposed to higher temperatures. The authors use the term thermal inequity to describe systematic disparities in exposure to extreme heat and situate it within the broader environmental justice literature.
Jesdale et al. (Citation2013) find that minority groups were more likely to live in areas with land cover characteristics that heighten heat exposure (e.g., no tree canopy, high impervious surface coverage), and that this positive correlation increased with the level of residential segregation at the metropolitan level. White-Newsome et al. (Citation2009) study the relationship between risk factors for heat-related mortality and impervious surface cover at the census tract level in Wayne County (MI). Impervious surfaces were used as a proxy for exposure to extreme heat. Using Spearman rank correlation coefficients, they find that impervious surface cover (i.e., a lack of vegetative cover) is positively correlated with other risk factors like poverty rate, minority racial status, and having a disability that makes going outside difficult. Pearsall (Citation2017) uses satellite imagery and cadastral data to examine how the distribution of vacant lots and exposure to heat varies across Philadelphia (PA) and correlates with indicators of social vulnerability. He finds that “hot spots … had higher poverty rates, lower median household income, and employment rates than the remainder of the city” (Pearsall, Citation2017, p. 90), and that the protective effect of vegetation observed in wealthy neighborhoods is the mirror image of disinvestment in Philadelphia’s poorest neighborhoods. Finally, a recent study by Hoffman et al. (Citation2020) considers the relationship between land surface temperature and redlining in a larger sample of U.S. cities (N = 108) and finds that areas carrying the HOLC designation “D” are “now on average 2.6 °C warmer than ‘A’-rated areas.” My study builds on those findings by considering intraurban heat exposure at multiple points in time, providing a more detailed discussion of who currently lives in formerly redlined areas, and articulating how geospatial data like those created by the Mapping Inequality project can be used to further center equity within climate adaptation and sustainability planning (Nelson et al., Citation2018).
Research Design and Methods
I ask whether areas targeted for disinvestment in the past through practices like redlining are now more exposed to heat in Baltimore, Dallas, and Kansas City. To answer this question, I compare estimates of LST derived from satellite imagery across the four-category rating system used to guide lending practices in cities around the United States, summarize the demographic characteristics of current residents within each of these historical designations, and discuss the connection between systematic disinvestment, heat exposure, and mitigation planning efforts. I collected satellite imagery from the Landsat 8 sensor because it offers the highest spatial resolution of any publicly available source for thermal analysis. I then processed these images to derive estimates of LST and vegetative cover in the form of the Normalized Difference Vegetation Index (NDVI). Note that land surface temperature is not the same as air temperature and instead reflects how warm or cool the surface of the Earth would feel to the touch. However, LST has been used to study the UHI effect as well as the human health effects of extreme heat (Harlan et al., Citation2013; Jenerette et al., Citation2016; Pearsall, Citation2017; White-Newsome et al., Citation2013). A recent study by He et al. (Citation2019) also uses the single-window method I apply here to derive LST from Landsat 8 imagery. I calculated mean LST for all polygons in the HOLC residential security map for each of the three study cities and used Kruskal-Wallis tests4 used to compare the mean LST values across each of the four rating classes.
I used U.S. Census Bureau data to assess who lives in formerly redlined areas. I extracted all census tracts with their centroids inside the polygons representing each of the four HOLC categories, summarized selected demographic characteristics, and compared those with the entire city. I limited study areas to current city boundaries rather than metropolitan areas for two reasons: 1) to avoid confounding of suburban and rural UHI influences and 2) because heat mitigation activities are more likely to be implemented at the city scale. Each of the demographic characteristics selected is directly related to environmental justice (e.g., race, ethnicity, poverty) or established risk factors for human health impacts during extreme heat events (e.g., older people and young children, disability status, poverty, citizenship status). Although relying on census tracts and selecting those with their centroids within HOLC category polygons is not ideal, I am unaware of other data sources that would provide insight into the characteristics of residents within those areas of the study cities without sacrificing spatial or temporal resolution.
Overview of Site Selection
Three cities representing three distinct climate regions were selected for this study: Baltimore (northeast), Dallas (south), and Kansas City (Ohio Valley/south; Karl & Koss, Citation1984). Each of these was among the 10 urban areas with highest number of heat-related deaths between 1996 and 2017 according to the National Centers for Environmental Information (Citation2017). These three cities also have a history of race-based residential segregation, with all ranking as “hypersegregated” in 1980 according to Massey and Denton (Citation1993); both Baltimore and Kansas City earned this distinction in 2010 (Massey & Tannen, Citation2015). Further, housing authorities in both Baltimore and Dallas “were sued for unlawfully concentrating their public housing in predominantly minority and high-poverty neighborhoods” (Goetz, Citation2015, p. 831).
The nature of residential segregation varies across the three study cities and has been arguably most rigidly codified in Baltimore. In 1911, the city enacted a municipal ordinance stating that “no white person would be permitted to move to a block the majority of whose occupants were black, and no black person would be permitted to move to a block the majority of whose occupants were white” (Boger, Citation2009, p. 237). This law and others like it were struck down by a U.S. Supreme Court decision in 1917, but the methods for maintaining residential segregation evolved. Suburbanization and the practice of redlining facilitated the separation of racial groups in metropolitan areas around the country, a legacy continuing to shape environmental inequality in Baltimore and other cities (Grove et al., Citation2018).
In Kansas City, residential segregation was less formal than in Baltimore. Kansas City’s African American population increased dramatically following World War II, but it ranked among the U.S. cities with the lowest rates of African American suburbanization (Massey & Denton, Citation1993). Although White households moved out of Kansas City to the suburbs, racially restrictive covenants and mandatory membership in a neighborhood association helped to establish persistent patterns of racial segregation. Gotham (Citation2002) shows how real estate developers maintained these patterns, with the north–south thoroughfare of Troost Avenue an important dividing line between racial groups.
In contrast to both Baltimore and Kansas City, African Americans are not the largest minority group in Dallas. In fact, Dallas is more diverse than most U.S. cities: “White, non-Hispanic residents now make up only 29 percent of the population” (Urban Land Institute, Citation2016, p. 11), due in large part to significant growth in the city’s Hispanic and Latino population since 1970. Less research has been published about the history of racial segregation and housing discrimination in Dallas. This disparity has been described as “academic amnesia”; as a result, leaders of this “obsessively image-conscious city” deliberately “transformed the community into a laboratory of forgetfulness” (Phillips, Citation2006, p. 3). Still, residential segregation persists, with the African American population largely concentrated in the southern portion of the city with very little mixing with non-Hispanic Whites or Latinos (Urban Land Institute, Citation2016).
Description of the Data
For each of the cities considered, I downloaded two Landsat 8 images with Level 1 processing5 using the USGS EarthExplorer tool with the following selection criteria: 1) image acquired within the past 3 years, 2) image acquired during the summer months, and 3) less than 5% cloud cover over land area. Digital files showing the redlined areas in each of the four study cities were downloaded from the Mapping Inequality project website hosted at the University of Richmond (Nelson et al., Citation2018). These files are based on the HOLC residential security maps produced between 1935 and 1940 and allow users to map areas rated as carrying varying levels of investment risk: A is “best,” B is “still desirable,” C is “definitely declining,” and D is “hazardous” (Jackson, Citation1980). Ratings imply assumptions about the economic value and viability of neighborhoods under prevailing social practices and cultural norms that prioritized racial segregation and marginalized non-Whites (Nelson et al., Citation2018). Maps locating these designations within each of the three cities are presented in the Technical Appendix. Water bodies were excluded from the calculation of land surface temperature due to the cooling effect these features exert on their surroundings (Gunawardena et al., Citation2017).
Information on the demographic characteristics of residents at the census tract level was obtained from the American Community Survey 2012–2016 5-year estimates (Walker, Citation2018). The variables selected were informed by the environmental justice literature in terms of testing for disparate exposure to extreme heat on the basis of race, ethnicity, income, etc., as well as important risk factors for health impacts during extreme heat events such as age, disability status, poverty, and citizenship status (Bullard, Citation1993; Holifield, Citation2001; Kovats & Hajat, Citation2008; Taylor et al., Citation2018). Population density was included as a control, given the variation in census tract size within U.S. cities.
Race and ethnicity were measured using the percentage of African American residents and the percentage of Hispanic or Latino residents in each census tract. Racial and ethnic minorities have been typically marginalized, and the environmental inequality these groups face often parallels broader questions of social and political justice in the city (Schweitzer & Stephenson, Citation2007). The percentage of very young (5 years and younger) and older residents (65 years and older) was included because of the heightened health risk individuals in these age groups face from extreme heat (Kovats & Hajat, Citation2008; Sheffield et al., Citation2018). Similarly, I included the poverty rate, percentage of residents with a disability, and percentage of non-citizen residents in the analysis to account for the role of factors such as income, mobility limitations, and linguistic isolation in heightening vulnerability to heat and other hazards.
Limitations of the Work
This study has several limitations. First, it relies on Landsat 8 satellite imagery, which offers a high degree of spatial resolution but at the expense of temporal resolution (Wilson, Citation2018). Images with little cloud cover may not be available for hot summer days when afternoon thunderstorms are a common occurrence. Further, as a result of the roughly 2-week period between acquisition of Landsat images, it may not be possible to study land surface temperature during a heatwave or at times that would be ideal from the analyst’s perspective. I used a pair of images for each city acquired within the past 2 years to estimate LST at two points in time with the hypothesis that the pattern of heat exposure within the cities considered is stable in the short term. The information presented in and derived from these pairs of images suggests that the general pattern of heat exposure is the same within the cities considered, but a broader study that analyzes a larger sample of images is needed to more firmly test this hypothesis. The modifiable areal unit problem is always an issue for studies of this type, and although census tracts do not align with the HOLC designation polygons, tracts are well established in the literature as a proxy for neighborhoods and have the added benefit of being relatively stable over time, which could be helpful for future research that incorporates longitudinal analysis (Openshaw & Taylor, Citation1979). Finally, some scholars have questioned how accurately the HOLC ratings in the residential security maps I use in this study reflect actual lending patterns (Hillier, Citation2003).
Table 1 Land surface temperature and vegetative cover by HOLC class.
The Legacy of Redlining in Degrees Fahrenheit
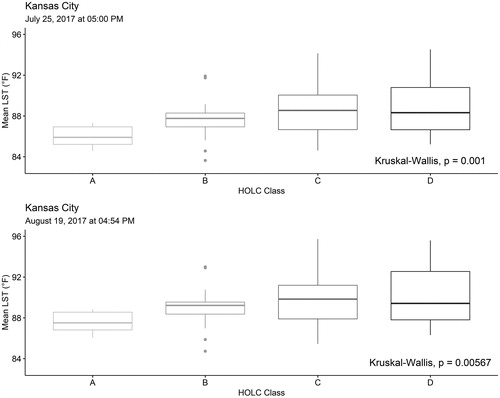
show the mean LST in degrees Fahrenheit by HOLC category for each of the three study cities and both of the Landsat 8 images analyzed. The source layer of HOLC designation polygons extends beyond the city boundary in each case. All polygons available in the files provided by the Mapping Inequality project were included in the analysis presented here (Nelson et al., Citation2018). I used Kruskal-Wallis tests to assess statistical significance of differences in median values between the HOLC classifications; in each case, pixels located within areas deemed “definitely declining” (Class C) and “hazardous” (Class D) were clearly and consistently hotter than other designated areas. In Kansas City and Dallas the difference between Class C and Class D was not as pronounced as in Baltimore, and there was much less variation in land surface temperature within the areas of Baltimore that were designated Class D. These box plots and the accompanying statistical tests provide evidence of greater heat exposure in these areas.
Figure 1. Box plot of mean land surface temperature by HOLC class in Baltimore. Source: U.S. Census Bureau (Walker, Citation2018), University of Richmond Mapping Inequality project (Nelson et al., Citation2018, and US Geological Survey (Citation2020b)).
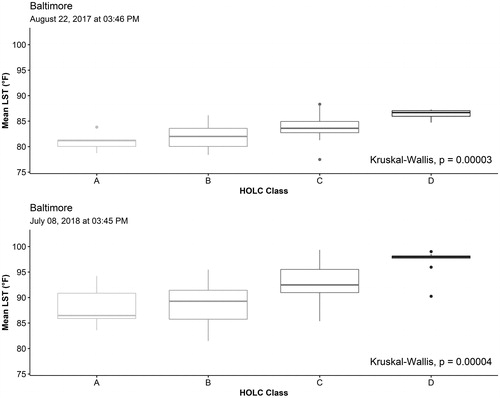
Figure 2. Box plot of mean land surface temperature by HOLC class in Dallas. Source: U.S. Census Bureau (Walker, Citation2018), University of Richmond Mapping Inequality project (Nelson et al., Citation2018), and US Geological Survey (Citation2020b).
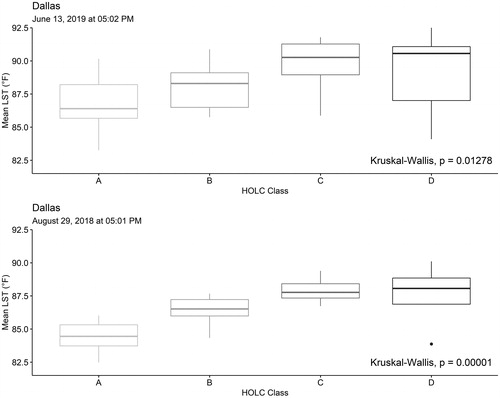
Figure 3. Box plot of mean land surface temperature by HOLC class in Kansas City. Source: U.S. Census Bureau (Walker, Citation2018), University of Richmond Mapping Inequality project (Nelson et al., Citation2018), and US Geological Survey (Citation2020b).
presents descriptive statistics for land surface temperature and the NDVI by HOLC category and for the entire city.
In Baltimore, the mean LST was higher within the areas formerly carrying the HOLC designation Class D than in the other designations and for the entire city for both satellite images considered. Similarly, the NDVI was lower, consistent with the hypothesis that formerly redlined areas may have higher heat exposure than other parts of the city. In Dallas, mean LST was highest and NDVI was lowest in the former HOLC Class D category, as in Baltimore. However, in Kansas City the difference between HOLC categories with respect to mean land surface temperature and NDVI was much smaller. Here, mean LST was used an indicator of heat exposure, whereas mean NDVI reflects vegetative cover, which has been shown to help mitigate heat (Coutts & Hahn, Citation2015).
To connect these findings with the human health impacts of extreme heat events, summarizes selected demographic characteristics for census tracts whose centroids fall within each of the historical HOLC designations captured in the Mapping Inequality project data layers (Nelson et al., Citation2018). The rightmost column reflects all tracts within the city, including those areas that were not assigned an HOLC designation.
Table 2 Demographic characteristics of census tracts with centroids in each HOLC class.
In each of the study cities, formerly redlined areas (i.e., HOLC Class D) had higher percentages of Hispanic/Latino (Baltimore), African American (Dallas), or both (Kansas City) residents than other HOLC designations or relative to the city as a whole. In all three cities, the poverty rate was higher and in Baltimore and Kansas City the percentage of non-citizen residents was also higher. This is important given the relevance of race, ethnicity, and arguably citizenship status to the emerging view that heat exposure in cities should be understood as an environmental justice issue (Harlan et al., Citation2006; Mitchell & Chakraborty, Citation2015; White-Newsome et al., Citation2009). Further, citizenship status, poverty, and disability status are important indicators of vulnerability to heat that overlap with the elevated exposure documented in formerly redlined areas of the three study cities.
Planning Implications
I find that areas of the study cities that were targeted for systematic disinvestment in the past (i.e., within HOLC Class D) had higher mean land surface temperatures than those receiving more favorable ratings. This discrepancy in exposure could be attributed in part to differences in vegetation that emerged from the way in which these parts of the city developed since the HOLC residential security maps were created in the late 1930s. Though there are no empirical data that span this time period, the fact that poor and minority residents were overrepresented in areas formerly carrying the HOLC Class D designation suggests that the observed “landscapes of thermal inequity” cannot be divorced from processes of suburbanization and prevailing practices of residential segregation enabled and replicated by market forces and government policy (Mitchell & Chakraborty, Citation2015).
The UHI effect coupled with rising global mean temperatures ensures that managing heat exposure in urban areas will take on even greater importance in the coming decades. Extreme heat is more than a public health issue; it is a question of environmental justice. In Baltimore, Dallas, and Kansas City, formerly redlined areas had higher poverty rates and lower vegetative cover and exhibited higher land surface temperatures than other areas of the city. This finding is consistent with prior research that establishes the protective benefits of vegetation with respect to heat are more frequently enjoyed by non-Hispanic Whites and higher income households (Jesdale et al., Citation2013; Rigolon & Németh, Citation2018). Responding to this challenge will require greater coordination among researchers and practitioners in fields like public health, emergency management, and urban planning to ensure that the disparities in heat exposure demonstrated in this study and in prior research are addressed and not deepened or propagated.
This study contributes to a growing body of literature that leverages remote sensing and statistical techniques to assess the equity impacts of climate change (Mitchell & Chakraborty, Citation2014, Citation2015; Pearsall, Citation2017). However, considering historical practices such as redlining as part of this work can deepen our understanding of the contemporary landscape of exposure to extreme heat in urban areas. The built environment is durable, and past development decisions have lasting and sometimes unanticipated consequences. In fact, a recent study finds that 74% of the neighborhoods “graded as high-risk, or ‘Hazardous’ eight decades ago are low-to-moderate income (LMI) today,” and nearly 64% are currently minority neighborhoods (Mitchell & Franco, Citation2018, p. 4). Mean LST was consistently higher in areas assigned a D or “hazardous” grade in two of the three cities considered; the reliability of this relationship is a testament to “interplay between racism, administrative culture, economics, and the built-environment” (Nelson et al., Citation2018). When situated within the equity planning framework, geospatial data and mapping can help make the impacts of past injustices visible and lay the foundation for what Meerow et al. (Citation2019) call “recognitional equity” and describe as “identifying and changing the social and cultural factors that undermine self-respect within a particular group and prevent them from being fully accepted and valued within the community” (p. 797).
Urban Heat Management as Equity Planning
The dominant approach to managing heat in cities emphasizes identifying and mitigating vulnerability—typically defined as exposure coupled with high sensitivity and/or low adaptive capacity—to reduce human health impacts and mortality. This approach engages with questions of distributional equity but ignores other aspects of equity (Meerow et al., Citation2019). If the goals of urban heat management are only to stave off the most visible and extreme effects of rising temperatures in cities, then planners miss an opportunity to more fully integrate equity into climate adaptation and sustainability planning efforts. Here I argue that there is room to consider the distributional equity of human health impacts upon individuals and the fairness of processes that construct patterns of vulnerability (procedural equity) and to acknowledge how past injustices affect the identity and culture of marginalized groups (recognitional equity) when deciding how and where to deploy heat mitigation strategies. The equity planning model also emphasizes using information and data to center and actively redress inequalities. Increased availability of geospatial data—including longitudinal data or digital information that documents past policies or planning interventions—offers new opportunities to critique and improve planning practice.
An important insight from this study is that there is value in considering which areas of the city have experienced sustained disinvestment as part of heat mitigation planning efforts. Urban heat management can identify exposed areas, sensitive populations, or low adaptive capacity individually or simultaneously (Wilhelmi & Hayden, Citation2010). By examining areas that have experienced sustained disinvestment, however, cities may be able to more quickly narrow the focus of these efforts while addressing the equity dimensions more comprehensively. One of the key tenets of environmental justice is “redressing the impacts with targeted remedial action and resources” (Cutter, Citation1995, p. 112), and urban heat management can proactively pursue this objective by considering past practices like redlining. My findings also imply that efforts to mitigate the negative impacts of rising temperatures in U.S. cities must be tailored to the local climate, built environment, and socio-demographic history. Historical processes like White flight to the suburbs reshaped cities, but suburbanization and gentrification processes add nuance and complexity to the question of who is vulnerable to climate change impacts. The effects of these drivers vary from place to place (Kneebone & Berube, Citation2013; Wilson & Chakraborty, Citation2019; Wolch et al., Citation2014).
Additional and different research is needed to better understand how and over what timescales prevailing patterns of heat exposure change in urban areas. Adopting a more longitudinal perspective would help to reduce duplicated effort, foster critical reflection, and enhance urban climate research’s coherence (Stewart, Citation2019). The qualitative difference between LST and air temperature makes it more difficult for LST to bridge the gap between existing studies that examine human health impacts of heat exposure and the sparseness of existing air temperature monitoring stations. Further, the vast majority of research that examines human health impacts of heat exposure relies on air temperature data rather than LST, but air temperatures are typically not gathered at locations that reflect the variety of land use patterns in cities (Gallo et al., Citation2011). As a result, there is a need for research that explores the connection between LST and human health in greater detail precisely because of the greater spatial resolution that satellite imagery can offer. Similarly, privacy constraints and a general lack of transparency with health data make testing connections between heat-related illness and LST very difficult to achieve and even harder to replicate at scale.
Overcoming limitations on the spatial resolution of data used to measure heat exposure and facilitating access to the health information used to gauge its impacts would significantly advance urban heat management, but other adjustments are needed to integrate equity in a more holistic way. Maps and geospatial data have proven useful for visualizing contemporary disparities in exposure to environmental hazards. In the same way, creating and leveraging resources like the HOLC redlining layers make it possible to link inequalities that may have emerged from past policies to specific challenges facing cities and planners today. However, historical data that document disinvestment and other forms of marginalization are only useful if their relevance to climate adaptation, sustainability planning, and other contemporary efforts is recognized. Rethinking what equity means in the context of urban heat management involves grappling with the legacy of historical policies like redlining and affirming planning’s ethical obligation to proactively address the inequitable provision of ecological services like heat mitigation. Krumholz’s (Citation1982) equity planning model offers a familiar framework for action that can leverage emerging digital resources like the redlining data layers I use here to inform planning practice.
Supplemental Material
Supplemental data for this article can be accessed on the publisher’s website.
Technical Appendix
Download PDF (1.6 MB)ACKNOWLEDGMENTS
I thank Editor Ann Forsyth and the anonymous reviewers for their valuable comments.
Additional information
Notes on contributors
Bev Wilson
BEV WILSON ([email protected]) is an associate professor of urban and environmental planning at the University of Virginia's School of Architecture.
Notes
1 The term redlining refers to systematic disinvestment in minority and low-income neighborhoods by banks, lending organizations, and insurance companies and was coined in the 1960s by community groups in Chicago (Hillier, Citation2003).
2 This term is commonly associated with the disproportionate burdening of communities of color and the poor with environmental contamination or public health threats.
3 Hillier (Citation2003) notes that the HOLC ratings most reliably explain interest rates rather than access to mortgage loans and, though not denying the existence of systematic disinvestment in poor and minority communities, challenges the notion that HOLC originated or directly practiced redlining.
4 The Kruskal-Wallis test is a nonparametric analysis of variance technique that relies on ranks.
5 These are the highest quality Landsat 8 images available and have undergone radiometric and geometric correction.
References
- Agyeman, J. (2005). Sustainable communities and the challenge of environmental justice. New York University Press.
- Bedsworth, L. W., & Hanak, E. (2010). Adaptation to climate change: A review of challenges and tradeoffs in six areas. Journal of the American Planning Association, 76(4), 477–495. https://doi.org/10.1080/01944363.2010.502047
- Berke, P. R. (2014). Rising to the challenge: Planning for adaptation in the age of climate change. In B. C. Glavovic & G. P. Smith (Eds.), Adapting to climate change: Lessons from natural hazards planning (pp. 171–190). Springer.
- Berke, P. R., Yu, S., Malecha, M., & Cooper, J. (2019). Plans that disrupt development: Equity policies and social vulnerability in six coastal cities. Journal of Planning Education and Research. Advance online publication. https://doi.org/10.1177/0739456X19861144
- Boger, G. (2009). The meaning of neighborhood in the modern city: Baltimore’s residential segregation ordinances, 1910–1913. Journal of Urban History, 35(2), 236–258. https://doi.org/10.1177/0096144208327915
- Bullard, R. D. (1993). Race and environmental justice in the United States. Yale Journal of International Law, 18, 319–335.
- Bullard, R. D., & Wright, B. H. (1993). Environmental justice for all: Community perspectives on health and research. Toxicology and Industrial Health, 9(5), 821–841. https://doi.org/10.1177/074823379300900508
- Burton, I., Kates, R. W., & White, G. F. (1978). The environment as hazard. Oxford University Press.
- Centers for Disease Control and Prevention (CDC). (2017). About extreme heat. https://www.cdc.gov/disasters/extremeheat/heat_guide.html
- Chu, E., Anguelovski, I., & Roberts, D. (2017). Climate adaptation as strategic urbanism: Assessing opportunities and uncertainties for equity and inclusive development in cities. Cities, 60, 378–387. https://doi.org/10.1016/j.cities.2016.10.016
- Clark, L. P., Millet, D. B., & Marshall, J. D. (2014). National patterns in environmental injustice and inequality: Outdoor NO2 air pollution in the United States. PLoS One, 9(4), e94431. https://doi.org/10.1371/journal.pone.0094431
- Congressional Black Caucus Foundation. (2004). African Americans and climate change: An unequal burden. Redefining Progress.
- Coseo, P., & Larsen, L. (2014). How factors of land use/land cover, building configuration, and adjacent heat sources and sinks explain urban heat islands in Chicago. Landscape and Urban Planning, 125, 117–129. https://doi.org/10.1016/j.landurbplan.2014.02.019
- Coutts, C., & Hahn, M. (2015). Green infrastructure, ecosystem services, and human health. International Journal of Environmental Research and Public Health, 12(8), 9768–9798. https://doi.org/10.3390/ijerph120809768
- Crossney, K. B., & Bartelt, D. W. (2005). The legacy of the Home Owners’ Loan Corporation. Housing Policy Debate, 16(3–4), 547–574. https://doi.org/10.1080/10511482.2005.9521555
- Curriero, F. C., Heiner, K. S., Samet, J. M., Zeger, S. L., Strug, L., & Patz, J. A. (2002). Temperature and mortality in 11 cities of the eastern United States. American Journal of Epidemiology, 155(1), 80–87. https://doi.org/10.1093/aje/155.1.80
- Cutter, S. L. (1995). Race, class and environmental justice. Progress in Human Geography, 19(1), 111–122. https://doi.org/10.1177/030913259501900111
- Ebi, K. L., Balbus, J. M., Luber, G., Bole, A., Crimmins, A., Glass, G., Saha, S., Shimamoto, M. M., Trtanj, J., & White-Newsome, J. L. (2018). Human health. In D. R. Reidmiller, C. W. Avery, D. R. Easterling, K. E. Kunkel, K. L. M. Lewis, T. K. Maycock, & B. C. Stewart (Eds.), Impacts, risks, and adaptation in the United States: Fourth national climate assessment, volume II. U.S. Global Change Research Program. http://doi.org/10.7930/NCA4.2018.CH14
- Ernstson, H. (2013). The social production of ecosystem services: A framework for studying environmental justice and ecological complexity in urbanized landscapes. Landscape and Urban Planning, 109(1), 7–17. https://doi.org/10.1016/j.landurbplan.2012.10.005
- Fishman, R. (2000). The American metropolis at century’s end: Past and future influences. Housing Policy Debate, 11(1), 199–213. https://doi.org/10.1080/10511482.2000.9521367
- Gallo, K., Hale, R., Tarpley, D., & Yu, Y. (2011). Evaluation of the relationship between air and land surface temperature under clear- and cloudy-sky conditions. Journal of Applied Meteorology and Climatology, 50(3), 767–775. https://doi.org/10.1175/2010JAMC2460.1
- Goetz, E. G. (2015). From breaking down barriers to breaking up communities: The expanding spatial strategies of fair housing advocacy. Urban Affairs Review, 51(6), 820–842. https://doi.org/10.1177/1078087414563179
- Gotham, K. F. (2002). Race, real estate, and uneven development: The Kansas City experience, 1900–2000. SUNY Press.
- Gronlund, C. J. (2014). Racial and socioeconomic disparities in heat-related health effects and their mechanisms: A review. Current Epidemiology Reports, 1(3), 165–173. https://doi.org/10.1007/s40471-014-0014-4
- Grove, M., Ogden, L., Pickett, S., Boone, C., Buckley, G., Locke, D. H., Lord, C., & Hall, B. (2018). The legacy effect: Understanding how segregation and environmental injustice unfold over time in Baltimore. Annals of the American Association of Geographers, 108(2), 524–537. https://doi.org/10.1080/24694452.2017.1365585
- Gunawardena, K. R., Wells, M. J., & Kershaw, T. (2017). Utilising green and bluespace to mitigate urban heat island intensity. Science of the Total Environment, 584–585, 1040–1055. https://doi.org/10.1016/j.scitotenv.2017.01.158
- Haase, D., Larondelle, N., Andersson, E., Artmann, M., Borgström, S., Breuste, J., Gomez-Baggethun, E., Gren, A., Hamstead, Z., Hansen, R., Kabisch, N., Kremer, P., Langemeyer, J., Rall, E. L., McPhearson, T., Pauleit, S., Qureshi, S., Schwarz, N., Voigt, A., Wurster, D., & Elmqvist, T. (2014). A quantitative review of urban ecosystem service assessments: Concepts, models, and implementation. AMBIO, 43(4), 413–433. https://doi.org/10.1007/s13280-014-0504-0
- Hajat, S., O'Connor, M., & Kosatsky, T. (2010). Health effects of hot weather: From awareness of risk factors to effective health protection. The Lancet, 375(9717), 856–863. https://doi.org/10.1016/S0140-6736(09)61711-6
- Harlan, S. L., Brazel, A. J., Prashad, L., Stefanov, W. L., & Larsen, L. (2006). Neighborhood microclimates and vulnerability to heat stress. Social Science & Medicine, 63(11), 2847–2863. https://doi.org/10.1016/j.socscimed.2006.07.030
- Harlan, S. L., Declet-Barreto, J. H., Stefanov, W. L., & Petitti, D. B. (2013). Neighborhood effects on heat deaths: Social and environmental predictors of vulnerability in Maricopa County. Environmental Health Perspectives, 121(2), 197–204. https://doi.org/10.1289/ehp.1104625
- Harlan, S. L., & Ruddell, D. M. (2011). Climate change and health in cities: Impacts of heat and air pollution and potential co-benefits from mitigation and adaptation. Current Opinion in Environmental Sustainability, 3(3), 126–134. https://doi.org/10.1016/j.cosust.2011.01.001
- Hayden, M. H., Brenkert-Smith, H., & Wilhelmi, O. V. (2011). Differential adaptive capacity to extreme heat: A Phoenix. Weather, Climate, and Society, 3(4), 269–280. https://doi.org/10.1175/WCAS-D-11-00010.1
- He, J., Zhao, W., Li, A., Wen, F., & Yu, D. (2019). The impact of the terrain effect on land surface temperature variation based on Landsat-8 observations in mountainous areas. International Journal of Remote Sensing, 40(5-6), 1808–1827. https://doi.org/10.1080/01431161.2018.1466082
- Heris, M. P., Muller, B., & Wilson, A. M. (2019). Why does planning matter in microclimate management and urban heat mitigation? Journal of Planning Education and Research. Advance online publication. https://doi.org/10.1177/0739456X19883000
- Heynen, N., Perkins, H. A., & Roy, P. (2006). The political ecology of uneven urban green space: The impact of political economy on race and ethnicity in producing environmental inequality in Milwaukee. Urban Affairs Review, 42(1), 3–25. https://doi.org/10.1177/1078087406290729
- Hillier, A. E. (2003). Redlining and the home owners’ loan corporation. Journal of Urban History, 29(4), 394–420. https://doi.org/10.1177/0096144203029004002
- Hoffman, J. S., Shandas, V., & Pendleton, N. (2020). The effects of historical housing policies on resident exposure to intra-urban heat: A study of 108 US urban areas. Climate, 8(1), 12. https://doi.org/10.3390/cli8010012
- Hogrefe, C., Lynn, B., Civerolo, K., Ku, J. Y., Rosenthal, J., Rosenzweig, C., Goldberg, R., Gaffin, S., Knowlton, K., & Kinney, P. L. (2004). Simulating changes in regional air pollution over the eastern United States due to changes in global and regional climate and emissions. Journal of Geophysical Research: Atmospheres, 109(D22). https://doi.org/10.1029/2004JD004690
- Holifield, R. (2001). Defining environmental justice and environmental racism. Urban Geography, 22(1), 78–90. https://doi.org/10.2747/0272-3638.22.1.78
- Jackson, K. T. (1980). Race, ethnicity, and real estate appraisal: The home owners loan corporation and the federal housing administration. Journal of Urban History, 6(4), 419–452. https://doi.org/10.1177/009614428000600404
- Jackson, K. T. (1985). Crabgrass frontier: The suburbanization of the United States. Oxford University Press.
- Jenerette, G. D., Harlan, S. L., Buyantuev, A., Stefanov, W. L., Declet-Barreto, J., Ruddell, B. L., Myint, S. W., Kaplan, S., & Li, X. (2016). Micro-scale urban surface temperatures are related to land-cover features and residential heat related health impacts in Phoenix, AZ, USA. Landscape Ecology, 31(4), 745–760. https://doi.org/10.1007/s10980-015-0284-3
- Jesdale, B. M., Morello-Frosch, R., & Cushing, L. (2013). The racial/ethnic distribution of heat risk–related land cover in relation to residential segregation. Environmental Health Perspectives, 121(7), 811–817. https://doi.org/10.1289/ehp.1205919
- Jones, T. S., Liang, A. P., Kilbourne, E. M., Griffin, M. R., Patriarca, P. A., Wassilak, S. G. F., Mullan, R. J., Herrick, R. F., Donnell, H. D. Jr, Choi, K., & Thacker, S. B. (1982). Morbidity and mortality associated with the July 1980 heat wave in St Louis and Kansas City, MO. JAMA: The Journal of the American Medical Association, 247(24), 3327–3331. https://doi.org/10.1001/jama.1982.03320490025030
- Karl, T. R., & Koss, W. J. (1984). Regional and national monthly, seasonal, and annual temperature weighted by area, 1895–1983 (Historical Climatology Series 4-3). National Climatic Data Center.
- Kim, J. I., Jun, M. J., Yeo, C. H., Kwon, K. H., & Hyun, J. Y. (2019). The effects of land use zoning and densification on changes in land surface temperature in Seoul. Sustainability, 11(24), 7056. https://doi.org/10.3390/su11247056
- Klinenberg, E. (2015). Heat wave: A social autopsy of disaster in Chicago. University of Chicago Press.
- Kneebone, E., & Berube, A. (2013). Confronting suburban poverty in America. Brookings Institution Press.
- Kochanek, K. D., Murphy, S. L., Xu, J., & Arias, E. B. (2017). Mortality in the United States, 2016. NCHS Data Brief No. 293. National Center for Health Statistics, Centers for Disease Control and Prevention.
- Koo, B. W., Boyd, N., Botchwey, N., & Guhathakurta, S. (2019). Environmental equity and spatiotemporal patterns of urban tree canopy in Atlanta. Journal of Planning Education and Research. Advance online publication. https://doi.org/10.1177/0739456X19864149
- Kovats, R. S., & Hajat, S. (2008). Heat stress and public health: A critical review. Annual Review of Public Health, 29(1), 41–55. https://doi.org/10.1146/annurev.publhealth.29.020907.090843
- Krivo, L. J., & Kaufman, R. L. (2004). Housing and wealth inequality: Racial-ethnic differences in home equity in the United States. Demography, 41(3), 585–605. https://doi.org/10.1353/dem.2004.0023
- Krumholz, N. (1982). A retrospective view of equity planning Cleveland 1969–1979. Journal of the American Planning Association, 48(2), 163–174. https://doi.org/10.1080/01944368208976535
- Mallen, E., Stone, B., & Lanza, K. (2019). A methodological assessment of extreme heat mortality modeling and heat vulnerability mapping in Dallas, Texas. Urban Climate, 30, 100528. https://doi.org/10.1016/j.uclim.2019.100528
- Massey, D. S., & Denton, N. A. (1993). American apartheid: Segregation and the making of the underclass. Harvard University Press.
- Massey, D. S., & Tannen, J. (2015). A research note on trends in black hypersegregation. Demography, 52(3), 1025–1034. https://doi.org/10.1007/s13524-015-0381-6
- Meerow, S., Pajouhesh, P., & Miller, T. R. (2019). Social equity in urban resilience planning. Local Environment, 24(9), 793–808. https://doi.org/10.1080/13549839.2019.1645103
- Mitchell, B. C., & Chakraborty, J. (2014). Urban heat and climate justice: A landscape of thermal inequity in Pinellas County. Geographical Review, 104(4), 459–480. https://doi.org/10.1111/j.1931-0846.2014.12039.x
- Mitchell, B. C., & Chakraborty, J. (2015). Landscapes of thermal inequity: Disproportionate exposure to urban heat in the three largest U.S. cities. Environmental Research Letters, 10(11), 115005. https://doi.org/10.1088/1748-9326/10/11/115005
- Mitchell, B. C., & Franco, J. (2018). HOLC ‘Redlining’ maps: The persistent structure of segregation and economic inequality. National Community Reinvestment Coalition.
- Moga, S. T. (2017). The zoning map and American city form. Journal of Planning Education and Research, 37(3), 271–285. https://doi.org/10.1177/0739456X16654277
- Mohl, R. A. (2004). Stop the road: Freeway revolts in American cities. Journal of Urban History, 30(5), 674–706. https://doi.org/10.1177/0096144204265180
- National Centers for Environmental Information. (2017). Storm events database. https://www.ncdc.noaa.gov/data-access/land-based-station-data/land-baseddatasets/automated-surface-observing-system-asos
- National Weather Service. (2018). 78-year list of severe weather fatalities. http://www.nws.noaa.gov/om/hazstats/resources/weather_fatalities.pdf
- Nelson, R. K., Winling, L., Marciano, R., & Connolly, N. (2018). Mapping inequality. https://dsl.richmond.edu/panorama/redlining
- Oke, T. R. (1973). City size and the urban heat island. Atmospheric Environment (1967), 7(8), 769–779. https://doi.org/10.1016/0004-6981(73)90140-6
- Openshaw, S., & Taylor, P. J. (1979). A million or so correlation coefficients: Three experiments on the modifiable areal unit problem. In N. Wrigley (Ed.), Statistical applications in spatial sciences (pp. 127–144). Pion.
- Pearsall, H. (2017). Staying cool in the compact city: Vacant land and urban heating in Philadelphia. Applied Geography, 79, 84–92. https://doi.org/10.1016/j.apgeog.2016.12.010
- Pellow, D. N. (2000). Environmental inequality formation: Toward a theory of environmental injustice. American Behavioral Scientist, 43(4), 581–601. https://doi.org/10.1177/0002764200043004004
- Phillips, M. (2006). White metropolis: Race, ethnicity, and religion in Dallas, 1841–2001. University of Texas Press.
- Reidmiller, D. R., Avery, C. W., Easterling, D. R., Kunkel, K. E., Lewis, K. L. M., Maycock, T. K., & Stewart, B. C. (Eds.). (2018). Impacts, risks, and adaptation in the United States: Fourth national climate assessment, Volume II. Global Change Research Program. https://doi.org/10.7930/nca4.2018
- Rigolon, A., & Németh, J. (2018). What shapes uneven access to urban amenities? Thick injustice and the legacy of racial discrimination in Denver’s parks. Journal of Planning Education and Research. Advance online publication. https://doi.org/10.1177/0739456X18789251
- Rutan, D. Q., & Glass, M. R. (2018). The lingering effects of neighborhood appraisal: Evaluating redlining’s legacy in Pittsburgh. The Professional Geographer, 70(3), 339–349. https://doi.org/10.1080/00330124.2017.1371610
- Sailor, D. J., Baniassadi, A., O’Lenick, C. R., & Wilhelmi, O. V. (2019). The growing threat of heat disasters. Environmental Research Letters, 14(5), 054006. https://doi.org/10.1088/1748-9326/ab0bb9
- Schlosberg, D., & Collins, L. B. (2014). From environmental to climate justice: Climate change and the discourse of environmental justice. Wiley Interdisciplinary Reviews: Climate Change, 5(3), 359–374. https://doi.org/10.1002/wcc.275
- Schrock, G., Bassett, E. M., & Green, J. (2015). Pursuing equity and justice in a changing climate: Assessing equity in local climate and sustainability plans in US cities. Journal of Planning Education and Research, 35(3), 282–295. https://doi.org/10.1177/0739456X15580022
- Schweitzer, L., & Stephenson, M., Jr. (2007). Right answers, wrong questions: Environmental justice as urban research. Urban Studies, 44(2), 319–337. https://doi.org/10.1080/00420980601074961
- Sheffield, P. E., Herrera, M. T., Kinnee, E. J., & Clougherty, J. E. (2018). Not so little differences: Variation in hot weather risk to young children in New York City. Public Health, 161, 119–126. https://doi.org/10.1016/j.puhe.2018.06.004
- Sheridan, S. C., & Allen, M. J. (2018). Temporal trends in human vulnerability to excessive heat. Environmental Research Letters, 13(4), 043001. https://doi.org/10.1088/1748-9326/aab214
- Stewart, I. D. (2019). Why should urban heat island researchers study history? Urban Climate, 30, 100484. https://doi.org/10.1016/j.uclim.2019.100484
- Stone, B., Jr. (2005). Urban heat and air pollution: An emerging role for planners in the climate change debate. Journal of the American Planning Association, 71(1), 13–25. https://doi.org/10.1080/01944360508976402
- Stone, B., Jr. (2012). The city and the coming climate: Climate change in the places we live. Cambridge University Press. https://doi.org/10.1017/cbo9781139061353
- Stone, B., Jr., Lanza, K., Mallen, E., Vargo, J., & Russell, A. (2019). Urban heat management in Louisville, Kentucky: A framework for climate adaptation planning. Journal of Planning Education and Research. Advance online publication. https://doi.org/10.1177/0739456X19879214
- Stone, B., Jr., & Norman, J. M. (2006). Land use planning and surface heat island formation: A parcel-based radiation flux approach. Atmospheric Environment, 40(19), 3561–3573. https://doi.org/10.1016/j.atmosenv.2006.01.015
- Stone, B., Jr., & Rodgers, M. O. (2001). Urban form and thermal efficiency: How the design of cities influences the urban heat island effect. Journal of the American Planning Association, 67(2), 186–198. https://doi.org/10.1080/01944360108976228
- Taylor, E. V., Vaidyanathan, A., Flanders, W. D., Murphy, M., Spencer, M., & Noe, R. S. (2018). Differences in heat-related mortality by citizenship status: United States, 2005–2014. American Journal of Public Health, 108(S2), S131–S136. https://doi.org/10.2105/AJPH.2017.304006
- Turner, B. L., Kasperson, R. E., Matson, P. A., McCarthy, J. J., Corell, R. W., Christensen, L., Eckley, N., Kasperson, J. X., Luers, A., Martello, M. L., Polsky, C., Pulsipher, A., & Schiller, A. (2003). A framework for vulnerability analysis in sustainability science. Proceedings of the National Academy of Sciences, 100(14), 8074–8079. https://doi.org/10.1073/pnas.1231335100
- Urban Land Institute. (2016). Dallas, Texas: Expanding affordable and mixed-income housing opportunities. http://uli.org/wp-content/uploads/ULI-Documents/DallasPanel_web.pdf
- U.S. Environmental Protection Agency. (2008). Urban heat island basics. In Reducing urban heat islands: Compendium of strategies (pp. 1–22). https://www.epa.gov/heat-islands/heat-island-compendium
- U.S. Geological Survey. (2020a). EarthExplorer. https://earthexplorer.usgs.gov
- U.S. Geological Survey (USGS). (2020b). Landsat 8 OLI/TIRS Collection 1. Earth Resources Observation and Science (EROS) Center.
- Walker, K. (2018). tidycensus: Load US Census boundary and attribute data as “tidyverse” and “sf”-ready data frames. R package version 0.8.1 [Computer software]. https://CRAN.R-project.org/package=tidycensus
- White-Newsome, J. L., Brines, S. J., Brown, D. G., Dvonch, J. T., Gronlund, C. J., Zhang, K., Oswald, E. M., & O’Neill, M. S. (2013). Validating satellite-derived land surface temperature with in situ measurements: A public health perspective. Environmental Health Perspectives, 121(8), 925–931. https://doi.org/10.1289/ehp.1206176
- White-Newsome, J., O'Neill, M. S., Gronlund, C., Sunbury, T. M., Brines, S. J., Parker, E., Brown, D. G., Rood, R. B., & Rivera, Z. (2009). Climate change, heat waves, and environmental justice: Advancing knowledge and action. Environmental Justice, 2(4), 197–205. https://doi.org/10.1089/env.2009.0032
- Wilhelmi, O. V., & Hayden, M. H. (2010). Connecting people and place: A new framework for reducing urban vulnerability to extreme heat. Environmental Research Letters, 5(1), 014021. https://doi.org/10.1088/1748-9326/5/1/014021
- Wilson, B. (2018). Data integration and web mapping for extreme heat event preparedness. In B. Huang (Ed.), Comprehensive geographic information systems (Vol. 2, pp. 281–289). Elsevier. https://doi.org/10.1016/B978-0-12-409548-9.09647-0
- Wilson, B., & Chakraborty, A. (2019). Mapping vulnerability to extreme heat events: Lessons from metropolitan Chicago. Journal of Environmental Planning and Management, 62(6), 1065–1088. https://doi.org/10.1080/09640568.2018.1462475
- Wolch, J. R., Byrne, J., & Newell, J. P. (2014). Urban green space, public health, and environmental justice: The challenge of making cities “just green enough”. Landscape and Urban Planning, 125, 234–244. https://doi.org/10.1016/j.landurbplan.2014.01.017
- Zanobetti, A., & O’Neill, M. S. (2018). Longer-term outdoor temperatures and health effects: A review. Current Epidemiology Reports, 5(2), 125–139. https://doi.org/10.1007/s40471-018-0150-3
- Zapata, M. A., & Bates, L. K. (2017). Equity planning or equitable opportunities? The construction of equity in the HUD sustainable communities regional planning grants. Journal of Planning Education and Research, 37(4), 411–424. https://doi.org/10.1177/0739456X16657874