
 ?Mathematical formulae have been encoded as MathML and are displayed in this HTML version using MathJax in order to improve their display. Uncheck the box to turn MathJax off. This feature requires Javascript. Click on a formula to zoom.
Abstract
In hybrid clustering, several basic clustering is first generated and then for the clustering aggregation, a function is used in order to create a final clustering that is similar to all the basic clustering as much as possible. The input of this function is all basic clustering and its output is a clustering called clustering agreement. However, this claim is correct if some conditions are met. This study has provided a hybrid clustering method. This study has used the basic k-means clustering method as a basic cluster. Also, this study has increased the diversity of consensus by adopting some measures. Here, the aggregation process of the basic clusters is done by the meta-clustering technique, where the primary clusters are re-clustered to form the final clusters. The proposed hybrid clustering method has the advantages of k-means, its high speed, as well as it does not have its major weaknesses, the inability to detect non-spherical and non-uniform clusters. In the empirical studies, we have evaluated the proposed hybrid clustering method with other up-to-date and robust clustering methods on the different datasets and compared them. According to the simulation results, the proposed hybrid clustering method is stronger than other clustering methods.
1. Introduction
Nowadays, clustering plays an important role in most research fields such as engineering, medicine, biology, and data mining (Sun et al. Citation2018; Tan et al. Citation2020). Clustering is one of the fields of unsupervised learning and is an automatic process during which samples are divided into categories whose members are similar to each other, and these categories are called clusters. Therefore, a cluster is a collection of samples in which the samples are similar to each other and are not similar to the samples in other clusters (Wei et al. Citation2019; Trik, Pour Mozaffari, and Bidgoli Citation2021). Different criteria can be considered for similarity. For example, the distance criterion can be used for clustering and samples that are closer to each other can be considered as a cluster. This type of clustering is known as distance-based clustering. In simple words, the purpose is to separate groups with similar features and divide them into clusters (Yang et al. Citation2021; Ma et al. Citation2021).
Clustering methods take the data and form these groups using some kind of similarity criterion. The results obtained from these clusters/groups can be used on many applications such as image processing, pattern recognition, social network analysis, recommendation engine and information retrieval (Zhao et al. Citation2019). In the process of machine learning for clustering, a similarity measure based on distance plays a pivotal role in clustering decision (Ghobaei-Arani and Shahidinejad Citation2021). In all kinds of clustering methods, two main objectives should be considered in order to obtain the least error: one, the similarity between one data point with another point and the second, the distinction of those similar data points with other points (Forouzandeh et al. Citation2021; Berahmand et al. Citation2021). The basis for such divisions begins with our ability to scale large datasets, and this is a starting point. Another challenge in clustering is the different types of features in the data. Data can be structured, unstructured, hierarchical, and continuous (Ghobaei-Arani Citation2021; Shahidinejad, Ghobaei-Arani, and Esmaeili Citation2020). Also, it is evident that the data is not dimensionally limited and is multidimensional in nature.
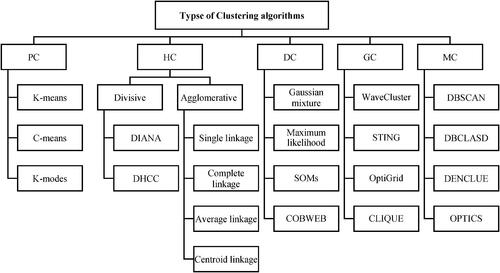
Basically, a suitable distance measure can be very effective in clustering. However, the appearance of the clusters can be geometric, so this challenge must also be considered. On the other hand, the results of the clustering method should be understandable in order to solve business problems. Therefore, scalability, features, dimensions, appearance, noises, and interpretability are the things that clustering methods should consider to solve the problem (Nasiri et al. Citation2022; Jadidi and Dizadji Citation2021). In general, performing clustering using different methods have a similar architecture. This is while the differences among the clustering methods include the distance/similarity criteria, initial cluster values and how to form the final clusters. These differences have led to the development of different clustering methods over time. Basically, there are five main classes of clustering methods including Density-based Clustering (DC), Grid-based Clustering (GC), Model-based Clustering (MC), Hierarchical Clustering (HC), and Partitional Clustering (PC), as shown in (Wei, Li, and Zhang Citation2018).
Figure 1. Taxonomy of clustering methods.
Since most of the basic clustering methods emphasize on specific aspects of the data, they are efficient on specific datasets (Niu et al. Citation2020; Li, Qian, and Wang Citation2021). For this reason, there is a need for approaches that can create better results by using the combination of these methods and considering their strengths. Meanwhile, hybrid clustering is a new clustering method that is obtained by combining the results of different clustering methods. Accuracy, correctness, and stability are important characteristics of a hybrid clustering method compared to classical clustering methods (Zheng et al. Citation2021; Zhu et al. Citation2021; Tan et al. Citation2020). In fact, the main purpose of hybrid clustering is to search for better and stronger results, using the combination of information and results obtained from several primary clustering (as partitions). So far, many studies have been done on hybrid clustering. Recent research in this field has shown that data clustering can significantly benefit from the combination of several data parts. In addition, their parallelization power has a natural adaptation to the need of distributed data mining. Hybrid clustering can provide better solutions in terms of robustness, scalability, stability, and flexibility than basic clustering methods (as individual).
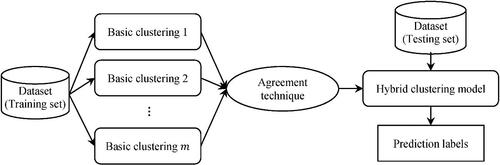
Basically, hybrid clustering includes two main steps: (1) producing different results from basic clustering methods and (2) combining the results obtained from basic clustering methods to produce final clusters (Zhu et al. Citation2021). The first is related to the creation of partitions with dispersion and diversity by different methods, and the second refers to an agreement function to combine the results (Wei et al. Citation2019). Usually, in the first step of hybrid clustering, a number of primary clusters are created, each of which emphasizes a specific feature of the data. Applying a clustering method on several different parts of the data or using several different clustering methods can cause dispersion and diversity in the partition results (Yang et al. Citation2021). After the primary partitions are formed, these results are usually combined by using an agreement function. One of the most common methods of combining the results is using the correlation matrix. A hybrid clustering framework is shown in , where the results of several basic clustering methods are combined to achieve more stable, scalable, and quality clustering.
Figure 2. Hybrid clustering framework.
Therefore, nowadays instead of addressing the making a strong global clustering method, more attention has been paid to building frameworks that integrate several weak clusters (Zhao et al. Citation2019; Trik et al. Citation2022). In this regard, the “hybrid cluster” or “clusters aggregation”, has been provided for improving the strength and quality of the clustering process (Tan et al. Citation2020). The k-means clustering method, which is one of the flat approaches, is known as a very fast and fairly efficient method (Yang et al. Citation2021; Ma et al. Citation2021). This method, as a weak clustering method, is one of the best basic clustering methods for contributing to consensus building in hybrid clustering. This paper addresses the existing problems by presenting valid local cluster theory. Here, the similarity between valid local clusters is estimated by applying an inter-cluster and intra-cluster similarity metric. In the next step of the method, the aggregation process of the basic clusters is done by the meta-clustering technique, where the primary clusters are re-clustered to form the final clusters. Eventually, the output of these clusters is considered along with the average credits to optimize the final agreement. The proposed hybrid clustering method has the advantages of k-means, its high speed, as well as it does not have its major weaknesses.
The main contribution of this paper is as follows:
The aggregation process of the basic clusters with a new meta-clustering technique.
Definition of valid local clusters by considering the data around the cluster centers in k-means.
Generating diverse primary clusters by applying a duplicate strategy on nonappearance data in valid local clusters.
Perform extensive experiments to demonstrate the efficacy of the proposed clustering method and give credence to our idea.
The rest of the paper is organized as follows. A brief discussion of related works in the literature is provided in Section 2. The formulation of the problem is provided in Section 3. The proposed clustering method is presented in Section 4. Experimental results are demonstrated in Section 5. Finally, Section 6 concludes the paper.
2. Related Works
So far, many studies have been presented by the research community on the development of clustering methods (Jain Citation2010; Hansen and Mladenović Citation2001; Zhang, Hsu, and Dayal Citation2000). The k-means method is one of the popular clustering approaches with many improved versions. For example, H-means solves the empty cluster problem in k-means (Jain Citation2010; Walid et al. Citation2021). Problems of k-means such as outliers, sensitive to noise and local optimum are considered by J-means method (Hansen and Mladenović Citation2001). This method can also solve the problem of degeneracy in k-means. Jiang et al. (Citation2010) proposed K-Harmonic Means (KHM) to solve the primary clustering problem in k-means. KHM has succeeded in obtaining high-quality results by considering the harmonic mean of intervals as the objective function. However, KHM is not suitable for global optimization. In this regard, Swarm Intelligence techniques are being developed to replace KHM. The ACOKHM (Ant Colony Optimization and K-Harmonic Means) method for clustering with a global approach was presented by Bouyer and Hatamlou (Citation2018). Although ACOKHM provides high-quality and accurate results, it has a slow convergence to the global optimum.
Hybrid clustering has become very popular as a technique to improve clustering results. The results of hybrid clustering using basic clustering methods with higher diversity and more quality are far more accurate (Bouyer and Hatamlou Citation2018). However, obtaining more accurate results by having more diversity in some collections has not yet been proven (Azimi and Fern Citation2009). Link-based Cluster Ensemble (LCE) was proposed as a hybrid clustering method by Jain (Citation2010). LCE is an improved version of Hybrid Bipartite Graph Formulation (HBGF) in which bipartite graph is used. The authors first create a dense graph for each pair of samples and clusters and then form the final clusters using spectral clustering. Niu et al. (Citation2020) proposed a hybrid clustering method that they developed based on the hybrid of locally reliable cluster solutions. This method is configured based on k-medoids and provides the concept of valid local clusters. Here, weighted undirected graph is used to find relationships between clusters.
Huang, Wang, and Lai (Citation2017) proposed Locally Weighted Meta-Clustering (LWMC) to improve hybrid clustering methods. Here, the Jaccard coefficient is used to calculate the weight of connections between clusters. LWMC uses the normalized cut method to create meta-clusters, where each meta-cluster contains several clusters (Huang et al. Citation2020). The authors use a weighted voting-based technique to create the final clusters. Consensus clustering by partitioning similarity graph was proposed by Hamidi, Akbari, and Motameni (Citation2019). This method uses graph pruning for clustering, where the number of clusters is automatically estimated. The authors use meta-cluster and majority vote as an aggregation function to create the final clusters. Here, the Jaccard coefficient is used to calculate the similarity. Iterative Combining Clustering Method (ICCM) was proposed by Khedairia and Khadir (Citation2022). ICCM uses an iteratively based technique to analyze data and create primary clusters. Here a voting method is used to create a set of partitions. For this, each sample votes for its own sub-cluster so that samples with higher votes are assigned to the corresponding sub-clusters. In the meantime, the samples that do not get the highest vote are clustered in the next iterations.
The hybrid clustering is still considered as a tool as well as a research field of the theory studied. A review paper is presented by Golalipour et al. (Citation2021) for a variety of these methods. Due to the fact that precision in clustering does not have a straightforward meaning such as classification, an alternative concept is presented for it, which states that a precise clustering is clustering which is most similar to other clusters formed on the given data, in other words, a better clustering means a more stable clustering. For a reason similar to the reason for the suitability of a diverse collection of classifiers for hybrid classification, a set of the clustering is considered as a goof set, if its basic clustering is varied (Bai, Liang, and Cao Citation2020). In order to generate a diverse clustering consensus, a weak clustering method must be applied to the data several times.
We use the k-means clustering method as a weak cluster for solving this problem (Abapour, Shafiesabet, and Mahboub Citation2021). Four sub-problems in hybrid clustering are presented as follows: (1) The problem of recognizing relatively correct labels in clustering: Unlike categorization, there is no real information about labels in clustering. (2) The problem of obtaining a variety of clustering that describe the entire data: In hybrid learning, while several poor learners are combined as strong learners, whatever the basic learners more complement each other, the hybrid learner acts better (Rezaeipanah, Nazari, and Ahmadi Citation2019; Rezaeipanah et al. Citation2021). That is, any weak clustering will cover the rest of the clustering. Therefore, for this purpose, we need to create several complementary clustering by applying k-means clustering methods. (3) The problem of determining the appropriateness between clusters: Unlike classifications in which each label is exclusively assigned to a category, the labels do not have a single meaning in clustering, and they simply represent that data has the same cluster (Mojarad et al. Citation2021). The clusters with the same name in two different clustering do not imply any truth. Therefore, before doing anything in hybrid clustering, the label of different clustering should be re-labeled based on correspondence. In addition, even two clusters of the same clustering are likely to signify a real cluster. (4) The problem of combining the results of matched basic clustering: In different clustering, each sample may have different labels. So, we have to determine a final label called an agreement label. In hybrid learning, while several poor learners are combined as a strong learner, whatever the action is more effective, the hybrid learner acts better (Li, Rezaeipanah, and El Din Citation2022).
3. Problem Formulation
A dataset is defined as a set of data samples that each data sample itself is a numerical vector (or feature vector). The dataset is shown by and each data sample is shown by
and obviously
The
-th feature of the
data sample is shown by
The size of each dataset
is shown by
The number of features of the dataset
is shown by
Let
be the number of samples and
the number of features from a dataset. Let
be the subset of data as clustered/partitioned. When the union of all subsets is equivalent to the original data set and each pair of subsets has no intersection, then each subset can be defined as a cluster. A clustering is shown by
where
represents the
-th cluster. Obviously,
and
The center of each cluster
is shown by
and its
-th feature is defined as EquationEq. (1)
(1)
(1)
(1)
(1)
A valid sub-cluster from a cluster is shown by
and is defined according to EquationEq. (2)
(2)
(2)
(2)
(2)
where
is a threshold parameter. It should be noted that a sub-cluster can be considered as a cluster.
Basically, there are many similarity/distance measures in the literature to define the difference between two clusters. In this paper, we define the similarity metric between the two clusters and
which is shown by
and defined as EquationEq. (3)
(3)
(3)
(3)
(3)
where
is calculated using EquationEq. (4)
(4)
(4)
(4)
(4)
where
is a point and
-th feature is denied as EquationEq. (5)
(5)
(5)
(5)
(5)
Let be a set of
samples of the dataset
where
is an
-th sample with
features. Also, let
be a hybrid of
individual clustering method, where
is the
-th member of the hybrid. Each
returns a set of clusters
(as a partition), where
refers to the number of clusters created by
For each
represents the cluster label belonging to
in
Here, the problem of hybrid clustering is defined as finding a new partition
from the consensus results of set
where
is the number of final clusters.
A weighting graph corresponding to a consensus of the clustering is shown by with
and is defined as
The vertex set of this graph is also the valid subsets of all consensus’s clusters, namely,
The weight of the edges between the vertices of this graph or the cluster-cluster connections is considered as the similarity value, as shown in EquationEq. (6)
(6)
(6)
(6)
(6)
Basically, the k-means clustering method is considered as an unsupervised learning method, where it is used to process unlabeled data. The purpose of this clustering is to find the best group in the data and determines the number of clusters. The data is placed in clusters based on the degree of similarity. In such a way that the data with the most similarity are placed in one group and have the least similarity with other groups. Here,
specifies the number of clusters and means the averaging. Clusters have a number of characteristics. The first feature: all the data in a cluster must be most similar to each other. The second feature: the data in different clusters should have the greatest difference. The time complexity of the k-means method is
so that
is the number of iterations.
The pseudocode for k-means-based hybrid clustering is shown in Algorithm 1. In this pseudocode, the original dataset is saved as and then an improved version of k-means is called sequentially to find and store the clustering results.
Algorithm 1.
The hybrid clustering method based on k-means method.
01:
02:
03: For = 1 to
do
04: = modified k-means (
);
05:
06:
07: End
Since the difference between basic clustering is a prerequisite for the effectiveness of the cluster group, in the following, how to obtain several k-means clustering with different valid local labels will be discussed. For the first time, we define an optimization problem for generating basic clustering as EquationEqs. (7)(7)
(7) and Equation(8)
(8)
(8)
(7)
(7)
(8)
(8)
where
is a Boolean variable that if is equal to 1,
will partly play a role in the production of the basic cluster
is provided to control this issue that how many times do each sample play.
Here, constraint is required to each of the samples is applied only once simultaneously to produce basic clustering that is provided by cluster centers in clustering. The purpose of minimizing the objective function is to create cluster centers in each basic cluster to indicate that samples are in the valid local and possible spaces. We suggest an incremental learning method for solving the optimization problem. This method gradually produces the productive basic clustering by trying to optimize an incremental problem in each step. The incremental problem is as EquationEq. (9)
(9)
(9) . Given that
has gained the first basic cluster
(9)
(9)
In addition, is estimated through EquationEq (10)
(10)
(10)
(10)
(10)
where
Given this constraint, we see that samples which are obtained by cluster centers and not shown in play an important role in basic clustering
The incremental learning method is as follows: We first set
for
and
At each step, we select
samples as the primary cluster centers from
randomly and use k-means with limitation for its cluster. In the clustering method, the cluster centers are limited, which can be seen only in relation to their neighborhoods in EquationEq. (9)
(9)
(9) . This will cause the final cluster centers obtained to show samples in local spaces to be valid. After executing k-means, we will update
where
is a set of samples that have valid local labels in the
basic clustering. Additionally, we will update
if
then
otherwise, for
it will be 0.
The above method repeats until the number of samples in is less than
Updating the cluster centers at each step through the iteration mechanism leads to the production of the final cluster centers. It can guarantee data description by multiple clustering. On the other hand, the importance of satisfying the final conditions should be determined. Many researchers argued that the maximum number of clustering in the set
of samples should be less than
(Zheng et al. Citation2021; Zhu et al. Citation2021; Tan et al. Citation2020). Thus, while the number of samples in
is less than
we assume that
cannot be divided into
clusters. Finally, if these conditions are met, the repetition can be stopped.
Algorithm 2.
Pseudocode of the MKM scheme.
Input:
Output:
01:
02:
03: Randomly select primary cluster centers as
on
04: While do
05:
06: Given
is updated by
07: For
08: Given
is updated by
09: where
10: For
11:
12:
13: End For
13: For = 1 to
do
14: If then
15:
16: else
17:
18: End If
19: End For
20:
21:
22:
23: End For
24: End While
The incremental method is called the Modified k-means (MKM) clustering method, which is formally described in Algorithm 2. The time complexity of MKM, where
is the number of partitions generated. The outputs of the algorithm have been the clustering set
and also the set of cluster centers, which is equal to
In order to simplify the basic clustering generation process, we determine a number of clusters in each basic clustering as
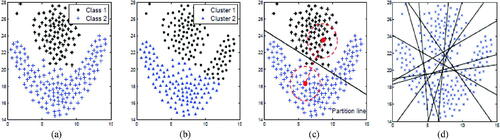
We continue the following example in . Here, we obtain a set of data as
on the dataset as well as 10 cluster bases. Part (d) shows the partition lines of these basic clusters generated by the MKM scheme. We observe that these basic clusters are somewhat different, which is useful for the cluster group.
Figure 3. An example of MKM: (a) real class labels, (b) clustering from k-means, (c) local hypothesis of the clusters, and (d) multiple partitions by MKM.
Note that the number of basic cluster depends on the parameter
When the amount of
decreases, the
value must be increased, because a small amount of
indicates that each basic cluster contains a number of local modifications. Therefore, while the
is set to a smaller value, we need a more basic clustering to describe the whole data. The setting of
depends on the needs of users, so that users can set the parameter to control the basic cluster number based on their needs.
4. Proposed Clustering Method
This study has provided a hybrid clustering method. This study has used the basic k-means clustering method as a basic cluster. Also, this study has increased the diversity of aggregation by adopting some measures. Here, the aggregation process of the basic clusters is done by the meta-clustering technique, where the primary clusters are re-clustered to form the final clusters. The proposed hybrid clustering method has the advantages of k-means, its high speed, as well as it does not have its major weaknesses.
In general, the labels in the dataset represent classes, but the labels in clustering only represent groups. Therefore, the labels in the clustering cannot be used for comparisons and cluster analysis. In this regard, it is necessary to align labels in clustering. Additionally, since the k-means method can only detect spherical and uniform clusters, two of the same clustering can represent a clustering. Hence, analysis of the relationship between clusters through similar clustering in needed. Now, there are inconsistent measures among the clusters proposed in the research literature (Yang et al. Citation2021; Ma et al. Citation2021). An example of this can be seen in chain clustering, where the intersection between clusters is determined by the distance between the farthest/closest sample between two clusters (Zhao et al. Citation2019). This method is sensitive to noise because it depends on a few specific samples to determine the final clusters. On the other hand, the distance between centers in center-based clustering approaches is defined as the absence of correlation. This method does not have the ability to effectively identify the border between clusters, but it has high computational efficiency and is resistant to noise.
In general, the similarity between two clusters in different partitions can be estimated based on the number of samples belonging to those clusters. This strategy cannot reflect samples with wrong labels in the cluster. However, some of these samples can have a high impact on the similarity calculation. Also, two clusters from the same partition share no sample, which is the reason for the inability of this metric to calculate similarity. Although there is good practice coordination between measures, they are not suitable for hybrid clustering. As mentioned, the labels of the created base partitions are different from the valid local labels. In other words, the validity of labels of each cluster may be low or high. Hence, the calculation of differences between clusters should be considered based on local labels. However, due to the use of MKM to generate initial partitions, the overlap between local labels should be relatively small. In this regard, we use an indirect overlap technique to calculate the similarity between clusters.
If and
are two clusters,
and
are their cluster centers and
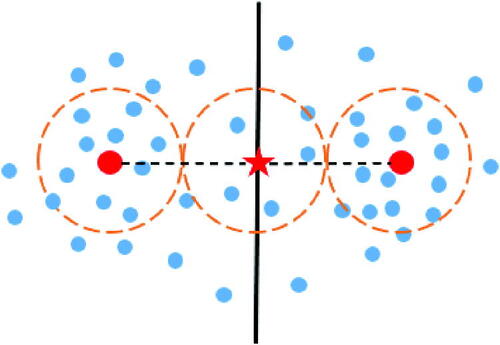
is the middle point of two centers. We assume there is a hidden cluster
whose cluster center is
for hidden for the cluster. Let the probability of samples being in valid local locations be greater with the density of samples. If there is a hidden cluster and the distance between
and
is not greater than
valid local spaces from the clusters
and
are overlapping with the hidden clusters
as shown in . In this case, the valid local spaces
and
are indirectly overlapping with the hidden cluster. For clusters
and
we consider these parameters to estimate the similarity between clusters.
Figure 4. Hidden cluster between clusters.
The distance between cluster centers is estimated based on the probability of a hidden cluster between them. As we know, whatever is smaller, the valid local spaces between them and
will more overlap. In this respect, it is a fact that their similarity is inversely related to
Also, k-means is a clustering approach with a linear mechanism and can identify the border of two clusters through a line between their centers. If the range around them is among several samples, they can be clearly identified. We use the following example in .
Figure 5. Similarity between clusters.
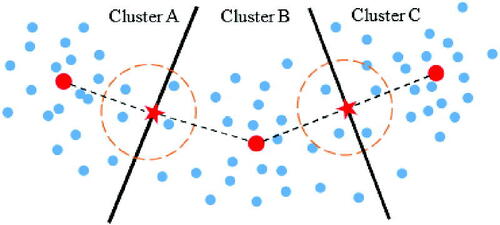
It is clearly seen that clusters B and C have centers with larger distances compared to clusters A and B. Meanwhile, it is easier to determine the border between clusters A and B. Hence, the distance between the centers of clusters A and B may be increased considering the clarity of the boundary identification. According to this hypothesis, let the similarity between two clusters be estimated through a hidden cluster. Formally, similarity is measured as EquationEq (11)(11)
(11)
(11)
(11)
Given the defined similarity matrix, we use an undirected weight graph (e.g., ) to describe the relationships between clusters. In this graph,
refers to the set of nodes that represent the cluster labels in
On the other hand,
in
refers to the weight of edges, which expresses the similarity between clusters. Hence, the similarity of both clusters is the concept of the weight of the edges between them, for example,
and whatever there is similarity between them. By calculating the weighted graph, the relationships between the clusters can be mapped to the normal graph discharge challenge, which is as EquationEq. (12)
(12)
(12)
(12)
(12)
where
is a partition of nodes in
and
is one of the subsets of
Our goal is to measure this partition using the minimization of the objective function This is achieved by creating a partition that has high similarity between nodes in similar subsets and low similarity with nodes in other subsets. To solve this problem and create partition A, the normalized spectral clustering method has been used, where nodes in similar subsets represent a cluster. Hence, if
is the label of the subset which
belongs to it, then we will have
if
If
and
the time complexity of the making of the cluster relationship is
The use of hybrid clustering leads to the mapping of the clustering problem from the sample level to the cluster level. Assume that is a set containing all primary clusters created from all basic methods. Taking each cluster as a sample, the clustering process is applied again, where this time the clusters are clustered. This technique can create meta-clusters, where each meta-cluster contains several clusters. Meta-clusters have more knowledge about the data than clusters because they combine the latent knowledge from different clustering methods. Here, the clusters’ clustering method is done using k-means. Let the similarity of two samples from the available dataset be
Anyway, in meta-clusters the concept of similarity is extended from the sample level to the cluster level. We define the similarity measure of clusters in a meta-cluster through EquationEq. (13)
(13)
(13)
(13)
(13)
where
and
are two meta-clusters, and
refers to the average similarity between them. Also,
and
are the number of clusters in
and
respectively. Moreover,
and
describe the number of samples in
and
respectively.
We create the final clusters by considering meta-clusters, where each instance of the dataset is assigned to a meta-cluster with maximum similarity. Meanwhile, the number of suitable clusters can be recognized by merging the initial clusters and applying a threshold value. Therefore, is determined as the number of optimal clusters by merging the initial clusters until the threshold
is reached, as defined in EquationEq. (14)
(14)
(14) . In other words, clusters are merged until the similarity of each existing pair of clusters is greater than
(14)
(14)
where
and
are two clusters of the
Also,
defines to the average similarity between
and
5. Experimental Results
This section is related to the evaluation of the proposed clustering method based on four synthetic datasets and five real datasets. Here, the efficiency of the proposed method is evaluated through the analysis of different validation methods and runtime. The evaluation of the proposed method is compared with some state-of-the-art methods such as COllaborative-Single Link (CO-SL) (Fred and Jain Citation2005), COllaborative-Average Link (CO-AL) (Fred and Jain Citation2005), Combined Similarity Measure-Single Link (CSM-SL) (Iam-On et al. Citation2011), Combined Similarity Measure-Average Link (CSM-AL) (Iam-On et al. Citation2011), Weighted Triple Quality-Single Link (WTQ-SL) (Iam-On et al. Citation2011), Weighted Triple Quality-Average Link (WTQ-AL) (Iam-On et al. Citation2011), Weighted Connection Triple-Single Link (WCT-SL) (Iam-On et al. Citation2011), Weighted Connection Triple-Average Link (WCT-AL) (Iam-On et al. Citation2011), Meta-Clustering Algorithm (MCLA) (Strehl and Ghosh Citation2002), HyperGraph Partitioning Algorithm (HGPA) (Strehl and Ghosh Citation2002), Cluster-based Similarity Partitioning Algorithm (CSPA) (Strehl and Ghosh Citation2002), Selective Voting (SV) (Zhou and Tang Citation2006), Selective Weighted Voting (SWV) (Zhou and Tang Citation2006), Iterative Voting Consensus (IVC) (Nguyen and Caruana Citation2007), Expectation–Maximization (EM) (Topchy, Jain, and Punch Citation2005), Normalized Spectral Clustering (NSC) (Ng, Jordan, and Weiss Citation2001), Density Based Spatial Clustering of Applications with Noise (DBCAN) (Ester et al. Citation1996), and Clustering by Fast Search and Find of Density Peaks (CFSFDP) (Rodriguez and Laio Citation2014).
5.1. Experiment Settings
A number of settings for these compared methods are listed below to ensure that the comparisons are in uniform environment. The number of clusters per basic cluster is equal to the actual number of classes in each of the desired datasets. k-means is also used as a productive of basic clustering. There are two methods for basic clustering: (1) Multiple implementations of the k-means each with a random amount of cluster centers. Let
refer to the number of samples. A set of the group
is set based on the dataset scale. If
then
if
then
and if
then
(2) Implement the proposed method. The method requires an input parameter
which is adapted to the size of the
group, as required. Here, the size of the group
is essentially consistent with the first plan.
We implemented all these methods with MATLAB 2019a simulator for experiments. The simulations are based on a synthetic fog environment on the Dell Latitude Laptop with Intel® AtomTM processor N550 (Core i7 at 3.3 GHz) and 16 GB of RAM. Meanwhile, the proposed method has some parameters as input whose values are adjusted using Taguchi approach (Yang et al. Citation2021).
5.2. Evaluation Criteria
Given the availability of real labels from the original dataset, we use two common measures based on unsupervised learning to estimate the similarity between the results and the correct division of the dataset of different methods. Given a dataset and two partitions of these samples, namely
(clustering result) and
(real partition), the values associated with
and
can be provided in a contingency table (), so that
indicants the number of same nodes in the clusters
and
Table 1. The default table to compare two partitions.
Normalized Mutual Information (NMI) and Adjust Rand Index (ARI) are evaluation metrics in experiments. The details of these criteria are described below.
5.2.1. NMI
Let and
be the results of two basic clustering methods as two partitions with
and
clusters, respectively. Accordingly, the
defines the diversity value for these partitions (Li, Qian, and Wang Citation2021), as shown in EquationEq. (15)
(15)
(15)
(15)
(15)
where
is the number of samples,
is the same number of samples in
and
is the number of samples in
and
is the number of samples in
5.2.2. ARI
This measure is often used in cluster validation and can indicate agreement between two partitions (Niu et al. Citation2020). The ARI is calculated based on the Rand Index, as defined in EquationEq. (16)(16)
(16)
(16)
(16)
where
is the number of samples,
is the same number of samples in
and
is the number of samples in
and
is the number of samples in
5.3. Datasets
Experimental evaluations were performed on nine datasets. More information describing the datasets used in the experiments can be found in . The cluster distribution of this synthetic 2D dataset is shown in . The real datasets are derived from the UCI machine learning repository (Golrou et al. Citation2018; Movahhed Neya, Saberi, and Rezaie Citation2022).
Figure 6. Distribution of four synthetic datasets: (a) imbalance, (b) aggregation, (c) banana, and (d) ring.
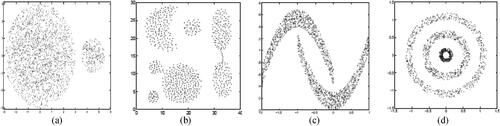
Table 2. Description of the datasets used.
5.4. Compared Methods
The proposed hybrid clustering method is evaluated in comparison with a wide range of clustering methods. Most of the clustering methods used for comparison are state-of-the-art and hybrid clustering methods. These methods include CO-average as a dual similarity approach that performs clustering through shared similarity matrix (Fred and Jain Citation2005). Similarity matrices based on CSM, WTQ, and WCT also belong to dual similarity approaches and are considered for comparison (Iam-On et al. Citation2011). Here, CO, CSM, WTQ, and WCT are analyzed through Single-Link (SL) and Average-Link (AL) hierarchical clustering methods to calculate the final results.
Also, HGPA, MCLA, and CSPA are hybrid clustering methods presented by Strehl and Ghosh (Citation2002). These methods are also considered for comparison and evaluation of the proposed method. In addition, we use SV and SWV as analysis-based weighted clustering methods for comparison work (Zhou and Tang Citation2006). Here, two feature-based clustering methods including IVC and EM are also used for comparison. IVC is presented by Nguyen and Caruana (Citation2007) and EM by Topchy, Jain, and Punch (Citation2005).
We also evaluated the proposed method in comparison with some Strong clustering approaches. Here, DBCAN, NSC, and CFSFDP were used for comparison. NSC is presented by Ng, Jordan, and Weiss (Citation2001), DBCAN by Ester et al. (Citation1996), and CFSFDP by Rodriguez and Laio (Citation2014).
5.5. Results and Discussions
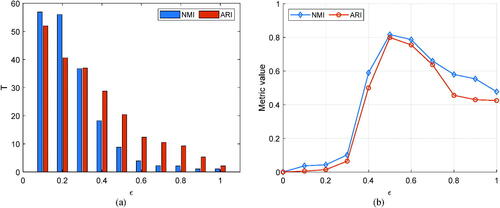
This section analyzes the results of the proposed method in comparison with existing clustering methods. First, the parameter is analyzed as an effective input parameter for the proposed method. In general, setting the parameter
is an important challenge in the proposed method. We discussed that the selection of this parameter depends on the number of basic clustering considered by the users. Then, we examined the effect of the parameter
on the performance of proposed method with performing relevant tests. For example, this problem has been analyzed on Wine and Iris datasets. As shown in part (a) in and , the number of basic clusters generated by the MKM scheme decreases with increasing
However, as shown in part (b) in these figures, the quality of the clustering results does not increase, hence the value of
should be slightly increased. On the other hand, the results clearly show that the number of basic clustering methods considered is not suitable. In other words, the number of methods considered to produce high-quality final clusters is high or low. Therefore, we must select an appropriate value of
to control the number of basic clustering on each dataset.
Figure 7. Analysis of the parameter of the proposed method on the Wine dataset. (a) number of basic clusters generated and (b) quality of clustering results.
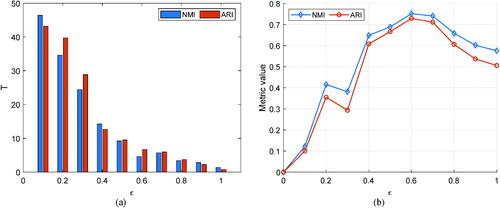
Figure 8. Analysis of the parameter of the proposed method on the Iris dataset. (a) number of basic clusters generated and (b) quality of clustering results.
In the following, the proposed method is evaluated in comparison with other hybrid clustering methods. Based on the NMI and ARI credit criteria, the performance of different clustering methods has been compared on synthetic and real datasets. shows the results of the comparisons for the synthetic dataset based on NMI, and the results of this measure for the real dataset are reported in . These comparisons for ARI are presented in and , respectively. Here, the last two columns indicate the average and Standard Deviation (SD) of each method for this dataset based on MKM. As illustrated, the superiority of the proposed method in creating high-quality and high-accuracy clusters on synthetic data sets is clear. This issue is confirmed by observing the results of the subject clustering methods. The proposed method has succeeded in creating higher quality clusters due to the use of valid local clustering theory as well as the use of meta-clusters. Therefore, the proposed method identifies the final clusters more effectively and increases the efficiency.
Table 3. Results of evaluations on synthetic datasets based on NMI metric.
Table 4. Results of evaluations on real datasets based on NMI metric.
Table 5. Results of evaluations on synthetic datasets based on ARI metric.
Table 6. Results of evaluations on real datasets based on ARI metric.
Basically, the performance of the proposed method is better than other methods in the real dataset. However, improving the accuracy of the proposed method in the real dataset is less than that of the synthetic dataset. One of the most important reasons for this is that the dimensions of real data sets are much larger than synthetic datasets. In addition, according to the results, it can be stated that most of the compared clustering methods have performed better than the MKM scheme considering the random scheme. Because any basic cluster generated by the MKM scheme only includes the local modification of clusters in a dataset. However, these existing methods do not recognize or consider local modification. Therefore, they cannot get the results of a good group in the MKM scheme. The proposed method has better performance in MKM scheme than other methods. Note that the proposed method implements only in the MKM scheme, because the MKM scheme is part of it. We observe that the proposed method in the MKM scheme works better in terms of NMI and ARI based on other methods in the randomized scheme.
In the following, the proposed method is evaluated in comparison with other strong clustering methods. The results of comparing the proposed method with three strong clustering methods (i.e., NSC, DBCAN, and CFSFDP) based on the synthetic and real datasets are reported in and , respectively. Here, the last two rows refer to the mean and SD in each clustering method. As shown in these experiments, the clustering quality provided by the proposed method is better or promising compared to other methods. As the simulation results show, the proposed method can simulate strong simulation results and realize “a few clusters equal to a strong cluster.”
Table 7. Results of evaluations on synthetic datasets.
Table 8. Results of evaluations on real datasets.
In another experiment, the computational complexity of clustering methods is evaluated through runtime analysis. The efficiency of the proposed method on the KDD-CUP99 dataset was tested. We set and
The runtime of the method with a number of samples (i.e.,
) is shown in . It is clearly evident that the number of
basic clustering increases with increasing number of samples. Given the time complexity of the proposed method, the runtime with
is second order. Given the runtime of the proposed method, the runtime with
is second order. However, since that
and
slowly increase in comparison with
growth, the cost of increasing
growth time is acceptable. As depicted, the cost of runtime of the method proposed is proportional to the number of linear samples. Therefore, the proposed method must be able to quickly obtain the final clustering in a large-scale dataset. As illustrated, the proposed method is very efficient.
Table 9. Performance of the proposed method based on runtime (s) on the KDD-CUP99 dataset.
6. Conclusion
Among the clustering methods, hybrid clustering is one of the popular methods with high stability and robustness, which provides the ability to discover hidden patterns with high accuracy. Hybrid clustering can adapt itself to the input dataset by using the knowledge of different methods and increase the quality of the final solution. The different quality of partitions from basic clustering methods is one of the arguments of hybrid clustering, which can achieve better results by combining them. Although k-means is a poor clustering method, it has a low computational cost, which makes it unsuitable for clustering results. Therefore, this study used the k-means clustering method as the basic cluster. Here, we presented a different definition of valid local clusters by considering the data around the cluster centers in k-means. To increase the diversity in the primary clusters, we used a duplicate strategy on nonappearance data in valid local clusters. Also, we used the inter-cluster and intra-cluster similarity measure to estimate the similarity between valid local clusters. This process has resulted in the production of a weighted graph in which the weight of the edges expresses the degree of similarity between the clusters. An aggregation function based on meta-clustering was used to create the final clusters, in which the primary clusters were re-clustered to obtain the final clusters. In general, the idea of the proposed method is to understand the concept of several weak clusters equal to a strong cluster by k-means. The results obtained from the proposed hybrid clustering method are more consistent with the real data structure. This method has reported better results compared to state-of-the-art methods on different datasets. Based on the results, the proposed method is effective for dealing with large-scale datasets. According to the concept of granular computing, how to extract the relationship between basic clustering methods and primary partitions is worth studying in future work. Also, the proposed method can appear more effective considering feature extraction/selection approaches. On the other hand, it is recommended to use techniques of increasing diversity such as bagging to select suitable basic clustering methods for future works.
Data availability
Data sharing not applicable to this manuscript as no datasets were generated or analyzed during the current study.
Disclosure statement
No potential conflict of interest was reported by the authors.
Additional information
Funding
References
- Abapour, N., A. Shafiesabet, and R. Mahboub. 2021. A novel security based routing method using ant colony optimization algorithms and RPL protocol in the IoT networks. International Journal of Electrical and Computer Sciences 3 (1):1–9.
- Azimi, J., and X. Fern. 2009. Adaptive cluster ensemble selection. In Twenty-First International Joint Conference on Artificial Intelligence, Vol. 9, 992–7, California, USA, July 11–17.
- Bai, L., J. Liang, and F. Cao. 2020. A multiple k-means clustering ensemble algorithm to find nonlinearly separable clusters. Information Fusion 61:36–47. doi:10.1016/j.inffus.2020.03.009.
- Berahmand, K., E. Nasiri, R. Pir Mohammadiani, and Y. Li. 2021. Spectral clustering on protein-protein interaction networks via constructing affinity matrix using attributed graph embedding. Computers in Biology and Medicine 138:104933.
- Bouyer, A, and A. Hatamlou. 2018. An efficient hybrid clustering method based on improved cuckoo optimization and modified particle swarm optimization algorithms. Applied Soft Computing 67:172–82. doi:10.1016/j.asoc.2018.03.011.
- Ester, M., H. P. Kriegel, J. Sander, and X. Xu. 1996. A density-based algorithm for discovering clusters in large spatial databases with noise. In KDD-96, 226–31, Portland, Oregon, USA, August 2–4.
- Forouzandeh, S., K. Berahmand, E. Nasiri, and M. Rostami. 2021. A hotel recommender system for tourists using the Artificial Bee Colony Algorithm and Fuzzy TOPSIS Model: A case study of tripadvisor. International Journal of Information Technology & Decision Making 20 (1):399–429. doi:10.1142/S0219622020500522.
- Fred, A. L., and A. K. Jain. 2005. Combining multiple clusterings using evidence accumulation. IEEE Transactions on Pattern Analysis and Machine Intelligence 27 (6):835–50.
- Ghobaei-Arani, M. 2021. A workload clustering based resource provisioning mechanism using Biogeography based optimization technique in the cloud based systems. Soft Computing 25 (5):3813–30. doi:10.1007/s00500-020-05409-2.
- Ghobaei-Arani, M., and A. Shahidinejad. 2021. An efficient resource provisioning approach for analyzing cloud workloads: a metaheuristic-based clustering approach. The Journal of Supercomputing 77 (1):711–50. doi:10.1007/s11227-020-03296-w.
- Golalipour, K., E. Akbari, S. S. Hamidi, M. Lee, and R. Enayatifar. 2021. From clustering to clustering ensemble selection: A review. Engineering Applications of Artificial Intelligence 104:104388. doi:10.1016/j.engappai.2021.104388.
- Golrou, A., A. Sheikhani, A. M. Nasrabadi, and M. R. Saebipour. 2018. Enhancement of sleep quality and stability using acoustic stimulation during slow wave sleep. International Clinical Neuroscience Journal 5 (4):126–34. doi:10.15171/icnj.2018.25.
- Hamidi, S. S., E. Akbari, and H. Motameni. 2019. Consensus clustering algorithm based on the automatic partitioning similarity graph. Data & Knowledge Engineering 124:101754. doi:10.1016/j.datak.2019.101754.
- Hansen, P., and N. Mladenović. 2001. J-means: A new local search heuristic for minimum sum of squares clustering. Pattern Recognition 34 (2):405–13. doi:10.1016/S0031-3203(99)00216-2.
- Huang, D., C. D. Wang, and J. H. Lai. 2017. LWMC: A locally weighted meta-clustering algorithm for ensemble clustering. In International Conference on Neural Information Processing, 167–76. Cham: Springer.
- Huang, D., C. D. Wang, J. S. Wu, J. H. Lai, and C. K. Kwoh. 2020. Ultra-scalable spectral clustering and ensemble clustering. IEEE Transactions on Knowledge and Data Engineering 32 (6):1212–26. doi:10.1109/TKDE.2019.2903410.
- Iam-On, N., T. Boongoen, S. Garrett, and C. Price. 2011. A link-based approach to the cluster ensemble problem. IEEE Transactions on Pattern Analysis and Machine Intelligence 33 (12):2396–409. doi:10.1109/TPAMI.2011.84.
- Jadidi, A., and M. R. Dizadji. 2021. Node clustering in binary asymmetric stochastic block model with noisy label attributes via SDP. In 2021 International Conference on Smart Applications, Communications and Networking (SmartNets), 1–6. New York: IEEE. doi:10.1109/SmartNets50376.2021.9555421.
- Jain, A. K. 2010. Data clustering: 50 years beyond k-means. Pattern Recognition Letters 31 (8):651–66. doi:10.1016/j.patrec.2009.09.011.
- Jiang, H., S. Yi, J. Li, F. Yang, and X. Hu. 2010. Ant clustering algorithm with K-harmonic means clustering. Expert Systems with Applications 37 (12):8679–84. doi:10.1016/j.eswa.2010.06.061.
- Khedairia, S., and M. T. Khadir. 2022. A multiple clustering combination approach based on iterative voting process. Journal of King Saud University – Computer and Information Sciences 34 (1):1370–80. doi:10.1016/j.jksuci.2019.09.013.
- Li, F., Y. Qian, and J. Wang. 2021. GoT: A growing tree model for clustering ensemble. In Proceedings of the AAAI Conference on Artificial Intelligence, Vol. 35, 8349–56, California, USA, February 2–9.
- Li, T., A. Rezaeipanah, and E. M. T. El Din. 2022. An ensemble agglomerative hierarchical clustering algorithm based on clusters clustering technique and the novel similarity measurement. Journal of King Saud University – Computer and Information Sciences 34 (6):3828–42. doi:10.1016/j.jksuci.2022.04.010.
- Ma, T., Z. Zhang, L. Guo, X. Wang, Y. Qian, and N. Al-Nabhan. 2021. Semi-supervised Selective Clustering Ensemble based on constraint information. Neurocomputing 462:412–25. doi:10.1016/j.neucom.2021.07.056.
- Mojarad, M., F. Sarhangnia, A. Rezaeipanah, H. Parvin, and S. Nejatian. 2021. Modeling hereditary disease behavior using an innovative similarity criterion and ensemble clustering. Current Bioinformatics 16 (5):749–64. doi:10.2174/1574893616999210128175715.
- Movahhed Neya, N., S. Saberi, and B. Rezaie. 2022. Design of an adaptive controller to capture maximum power from a variable speed wind turbine system without any prior knowledge of system parameters. Transactions of the Institute of Measurement and Control 44 (3):609–19. doi:10.1177/01423312211039041.
- Nasiri, E., K. Berahmand, Z. Samei, and Y. Li. 2022. Impact of centrality measures on the common neighbors in link prediction for multiplex networks. Big Data 10 (2):138–50.
- Ng, A., M. Jordan, and Y. Weiss. 2001. On spectral clustering: Analysis and an algorithm. Advances in Neural Information Processing Systems 14:849–56.
- Nguyen, N., and R. Caruana. 2007. Consensus clusterings. In Seventh IEEE International Conference on Data Mining (ICDM 2007), 607–12. New York: IEEE. doi:10.1109/ICDM.2007.73.
- Niu, H., N. Khozouie, H. Parvin, H. Alinejad-Rokny, A. Beheshti, and M. R. Mahmoudi. 2020. An ensemble of locally reliable cluster solutions. Applied Sciences 10 (5):1891. doi:10.3390/app10051891.
- Rezaeipanah, A., P. Amiri, H. Nazari, M. Mojarad, and H. Parvin. 2021. An energy-aware hybrid approach for wireless sensor networks using re-clustering-based multi-hop routing. Wireless Personal Communications 120 (4):3293–314. doi:10.1007/s11277-021-08614-w.
- Rezaeipanah, A., H. Nazari, and G. Ahmadi. 2019. A hybrid approach for prolonging lifetime of wireless sensor networks using genetic algorithm and online clustering. Journal of Computing Science and Engineering 13 (4):163–74. doi:10.5626/JCSE.2019.13.4.163.
- Rodriguez, A., and A. Laio. 2014. Clustering by fast search and find of density peaks. Science (New York, N.Y.) 344 (6191):1492–6. doi:10.1126/science.1242072.
- Shahidinejad, A., M. Ghobaei-Arani, and L. Esmaeili. 2020. An elastic controller using Colored Petri Nets in cloud computing environment. Cluster Computing 23 (2):1045–71. doi:10.1007/s10586-019-02972-8.
- Strehl, A., and J. Ghosh. 2002. Cluster ensembles – A knowledge reuse framework for combining multiple partitions. Journal of Machine Learning Research 3:583–617.
- Sun, S., S. Wang, G. Zhang, and J. Zheng. 2018. A decomposition-clustering-ensemble learning approach for solar radiation forecasting. Solar Energy 163:189–99. doi:10.1016/j.solener.2018.02.006.
- Tan, H., Y. Tian, L. Wang, and G. Lin. 2020. Name disambiguation using meta clusters and clustering ensemble. Journal of Intelligent & Fuzzy Systems 38 (2):1559–68. doi:10.3233/JIFS-179519.
- Topchy, A., A. K. Jain, and W. Punch. 2005. Clustering ensembles: Models of consensus and weak partitions. IEEE Transactions on Pattern Analysis and Machine Intelligence 27 (12):1866–81. doi:10.1109/TPAMI.2005.237.
- Trik, M., A. M. N. G. Molk, F. Ghasemi, and P. Pouryeganeh. 2022. A hybrid selection strategy based on traffic analysis for improving performance in networks on chip. Journal of Sensors 2022:1–19. doi:10.1155/2022/3112170.
- Trik, M., S. Pour Mozaffari, and A. M. Bidgoli. 2021. Providing an adaptive routing along with a hybrid selection strategy to increase efficiency in NoC-based neuromorphic systems. Computational Intelligence and Neuroscience 2021:8338903. doi:10.1155/2021/8338903.
- Walid, W., M. Awais, A. Ahmed, G. Masera, and M. Martina. 2021. Real-time implementation of fast discriminative scale space tracking algorithm. Journal of Real-Time Image Processing 18 (6):2347–60. doi:10.1007/s11554-021-01119-6.
- Wei, S., Z. Li, and C. Zhang. 2018. Combined constraint-based with metric-based in semi-supervised clustering ensemble. International Journal of Machine Learning and Cybernetics 9 (7):1085–100. doi:10.1007/s13042-016-0628-6.
- Wei, Y., S. Sun, J. Ma, S. Wang, and K. K. Lai. 2019. A decomposition clustering ensemble learning approach for forecasting foreign exchange rates. Journal of Management Science and Engineering 4 (1):45–54.
- Yang, W., Y. Zhang, H. Wang, P. Deng, and T. Li. 2021. Hybrid genetic model for clustering ensemble. Knowledge-Based Systems 231:107457. doi:10.1016/j.knosys.2021.107457.
- Zhang, B., M. Hsu, and U. Dayal. 2000. K-harmonic means-a spatial clustering algorithm with boosting. In International Workshop on Temporal, Spatial, and Spatio-Temporal Data Mining, 31–45. Berlin, Heidelberg: Springer.
- Zhao, Q., Y. Zhu, D. Wan, Y. Yu, and Y. Lu. 2019. Similarity analysis of small-and medium-sized watersheds based on clustering ensemble model. Water 12 (1):69. doi:10.3390/w12010069.
- Zheng, Y., Z. Long, C. Wei, and H. Wang. 2021. Particle swarm optimization for clustering ensemble. In 2021 16th International Conference on Intelligent Systems and Knowledge Engineering (ISKE), 385–91. New York: IEEE. doi:10.1109/ISKE54062.2021.9755338.
- Zhou, Z. H., and W. Tang. 2006. Clusterer ensemble. Knowledge-Based Systems 19 (1):77–83. doi:10.1016/j.knosys.2005.11.003.
- Zhu, X., B. Fei, D. Liu, and W. Bao. 2021. Adaptive clustering ensemble method based on uncertain entropy decision-making. In 2021 IEEE 20th International Conference on Trust, Security and Privacy in Computing and Communications (TrustCom), 61–7. New York: IEEE. doi:10.1109/TrustCom53373.2021.00026.