
ABSTRACT
Until recently, households in the most chronic kidney disease-affected rural areas of Sri Lanka used untreated groundwater for drinking and cooking, but, by 2018, that share was only 35%. About 50% of households consume water treated by reverse osmosis; others rely on piped water, water delivery by tanker and rainwater harvesting. Based on a new and representative survey of 1500 households, households’ propensities to treat drinking water and adopt improved water sources are shown to be associated with their perceptions of water safety and trust in the institutions that provide alternatives to untreated well water.
Introduction
A key component of the policy response to a public health epidemic in Sri Lanka has been the promotion of alternative drinking water sources to households in rural communities that were historically reliant on groundwater. About half of the 25 administrative districts in the country, mostly in the drier north and central regions, are experiencing high rates of chronic kidney disease of unknown aetiology (CKDu) (Johnson et al., Citation2019; Wijkström et al., Citation2018). In recent decades, tens of thousands of premature deaths in Sri Lanka have been attributed to the disease (Rango et al., Citation2015). Although the specific causes of CKDu are not yet well understood, several hypotheses implicate the consumption of untreated groundwater in rural areas (Gifford et al., Citation2017; World Health Organization (WHO), Citation2016). In many districts of Sri Lanka, groundwater-reliant households have been encouraged to use other water sources – especially for drinking and cooking – such as groundwater treated by reverse osmosis, rainwater harvesting and surface water or treated groundwater delivered by tanker truck or through distribution pipes to the village (Cooray et al., Citation2019; WHO, Citation2013).
CKDu differs from more common forms of chronic kidney disease (CKD). Specifically, CKDu is often asymptomatic in its early stages, and may manifest in patients in the absence of diabetes, hypertension, immune-mediated glomerulonephritis or structural renal disease (Caplin et al., Citation2019). CKDu has been identified within low-income rural populations in several countries (Gifford et al., Citation2017), yet there is no clear international consensus on case definition, diagnosis or the best approaches to detect it at the population level (Caplin et al., Citation2019; Wijewickrama et al., Citation2019). According to Johnson et al. (Citation2019), CKDu ‘is strongly associated with working and living in a hot environment, but whether the cause is a toxin, an infectious agent, a heat-associated injury, or a combination of factors is not yet known’ (p. 1843).
Preventive measures internationally include the promotion of safe drinking water and other means to reduce environmental exposure to diverse toxins, along with, in some Central American countries, agricultural workplace programmes that encourage adequate hydration and scheduled, shaded rest breaks for workers at risk (Gifford et al., Citation2017). In the past 10 years in Sri Lanka, reverse osmosis treatment of groundwater, especially in rural areas, has received considerable promotion and financial support. Governments and charitable donors in many cases have paid the capital costs of new reverse osmosis infrastructure installations and supported community-based organizations to become the operators of the facilities. Rainwater harvesting and other supply alternatives have received relatively less promotion and support.
The rapid growth in the literature on all aspects of CKDu, both internationally and in Sri Lanka, appears to signal both the complexity of this enigmatic disease and the growing awareness of its tragic significance. Relatively little has been written specifically about the implementation and acceptance of preventive efforts to replace drinking water sources in Sri Lanka. Jayasumana et al. (Citation2016) examine aspects of the operation of reverse osmosis treatment for CKDu prevention, but focus on a sample of only 10 treatment plants in two CKDu-affected districts. Rajakarunanayake and Ariyananda (Citation2018) survey the challenges of sustaining rainwater harvesting systems used by about 950 households with a focus on three districts, only two of which are considered to be CKDu affected.
Other lines of enquiry, not pursued in this paper, include a programme of ongoing epidemiological research as reported by the WHO (Citation2013, Citation2016) and others (Gifford et al., Citation2017). In the absence of detailed and systematic mapping of groundwater hydrology, hydrogeology and seasonal water quality across CKD-affected regions, research programmes that would focus on environmental protection to provide policy advice for better CKDu health outcomes are in a relatively early research stage.
The principal contribution of the present research is to characterize the response of rural communities in Sri Lanka to alternative water sources by choosing a large-scale sample of households – a sample designed to be representative of the most-affected areas – and then to analyse the collected data for behavioural differences. Until now, the available evidence from Sri Lanka about rural communities’ responses to this principal preventive effort has not characterized householders’ motivations and has been either anecdotal or based on small, unrepresentative samples.
This study examines numerous aspects of Sri Lankan rural communities’ responses to the promotion of alternative water sources, including the examination of householders’ perceptions, preferences and beliefs about the desirability of historical water sources and recommended alternatives. Detailed interviews were undertaken in 2018 with about 1500 households in those parts of 10 administrative districts of Sri Lanka publicly identified as being most affected by CKDu. The interviewed households were purposively selected to be statistically representative of two key subpopulations: households that (1) have and (2) have not experienced CKD among one or more of their adult residents who lived there in the decade 2009–18. Two-sided t-tests and probability-weighted multiple regression analyses shed a light on these groundwater-reliant households’ likelihoods of adopting basic water treatment practices and of switching to an alternative source of water. These statistical analyses control for common confounding factors such as differences among households in size, gender and educational attainment.
This research has engaged those rural communities where CKDu is most prevalent to examine the effects at the household level of the public promotion and provision of alternative sources of water for drinking and cooking. Several research questions are addressed in turn.
How do householders perceive the risk of contracting CKD from drinking local groundwater?
How do householders assess the safety of water drawn from alternative sources?
How much trust do householders place in various organizations that could be their water suppliers?
If householders were required to give up their current drinking water source, what would be their most preferred alternative?
How widespread across affected districts has been the adoption of drinking water treated by reverse osmosis, and what are some of the associated monetary and time costs that households incur to access it?
What are the principal barriers to the greater adoption of reverse osmosis as a drinking water supply?
Which explanatory factors are most highly associated with households’ decisions: (a) to treat the water consumed at home before drinking it; (b) to adopt reverse osmosis; or (c) to adopt other alternatives as their primary source of drinking water in the home?
For questions (1) to (3), supplementary questions ask whether there are significant differences in responses among two subgroups of households: those with members who have or have not experienced CKD; and those who were or were not relatively early adopters of reverse osmosis as their primary drinking water source.
In answering these questions, this paper shows that, although almost all households in the most CKD-affected rural areas of Sri Lanka formerly relied upon untreated groundwater for drinking and cooking, by 2018 that share had dropped to about one-third of households. About half of households now consume water treated by reverse osmosis, and others rely on other alternatives such as rainwater harvesting, piped water, surface water and water delivery by tanker vehicle. Households perceive that drinking untreated well water will lead to a risk of kidney disease that grows with time, but they place their trust in reverse osmosis-treated water, especially when provided by government. CKD-affected households and households that were early adopters of reverse osmosis express several views that set them apart from all others. Householders report that consuming reverse osmosis water is costly in terms of collection time and the prices charged by some suppliers, and in some villages it is not available. A majority of all households would prefer to move to piped water if a change were required. Households’ propensity to treat their water and to adopt reverse osmosis and other alternatives is shown to correlate statistically with several of the reported household perceptions and beliefs, as well as with characteristics of the households’ past water use, health status and household demographics.
Numerous countries have historically implemented public health efforts to switch communities from untreated groundwater to safer drinking water sources. Elsewhere in South Asia, for example, there have been significant campaigns to avoid emergent problems associated with arsenic and fluoride toxicity of groundwater (Balasubramanya et al., Citation2014). Although the specifics of each context can differ greatly, the community responses to these policy endeavours share a reliance on residents’ perceptions, preferences and beliefs along with their assessment of the accessibility and desirability of recommended alternatives, all of which can inform policy efforts.
This paper offers a new and statistically representative picture of household perceptions and behaviour with respect to domestic water use and CKD in the most seriously affected districts of Sri Lanka. These results will inform national policy efforts to move households away from consuming untreated groundwater, consistent with the precautionary principle. Internationally, the emergence of CKDu in other countries may allow them to apply these lessons to timely and significant advantage.
The following sections describe the methods and data employed, provide numerical and qualitative results, and are followed by discussion and conclusion.
Methods and data
Data for this study were collected in the third quarter of 2018 using two rounds of household surveys. The first round of surveys included about 8000 households; the second round focused on a subsample of 1497 of these households. Based on an estimated average household size in these regions of 3.7 persons, these surveys characterize the situation of about 30,000 (first round) and 5000 (second round) household residents in the 10 most CKDu-affected administrative districts of Sri Lanka. Household sample selection was guided further by population data from the 2012 Census; from accessible voters’ lists identifying individual households in eight of the 10 districts; and from population health statistics estimating the prevalence of all forms of chronic kidney disease (CKDu and others) for the period 2012–14.
Among other things, the first round of surveys provided information about each surveyed household’s historical reliance upon groundwater, and identified which households had any adult residents in the past decade who had been diagnosed with any form of chronic kidney disease by a doctor of Western medicine (referred to hereinafter as ‘CKD-affected households’). This information was used to design the sample for the second round of surveys. Thus, all the 1497 households surveyed in the second round of interviews have used groundwater as their primary water source for drinking or cooking purposes for at least five years between 1999 and 2018. Of these 1497 households, 673 are CKD-affected.
In these rural areas of Sri Lanka, the most common method used to access groundwater has been through a household’s privately owned well, although sometimes these wells are owned collectively by households within a village or by the government itself. Other ways that households have accessed groundwater is from springs and from so-called agrowells – these are developed for irrigation use with a larger diameter than household wells and are often left exposed to the environment at the surface. A further distinction is made between household wells where the water was gathered by bucket and those where it was gathered by use of a pump, such as to draw water directly to the residence. In general, the system of intake tubes used with pump systems draws water from lower in the well’s water column, potentially supplying water with different chemical properties and different CKD-related outcomes. In interviews to gather historical data on household water use, each of these groundwater source distinctions was observed year by year for the period 2000–18.
Householders were asked whether they have had their primary water source tested, but no information was collected on the specific nature of the tests or on test results. Given the current state of knowledge about the causes of CKDu, there does not appear to be a scientifically valid test that could indicate whether consuming sampled drinking water presents a specific health risk for CKDu. Information about whether or not a household has previously tested its water might reveal something significant about that household’s beliefs, awareness, level of concern or motivation to change their behaviour.
A recent study by Balasubramanya et al. (Citation2020) employs the same data set to examine other distinct topics such as the association between household residents’ historical behaviours and households’ CKD status. To avoid unnecessary repetition, the full description of the design of the sample and of the resulting properties of the data set will not be repeated here. The following points, however, are likely to be salient for the reader’s interpretation of the analysis and results reported below:
The sample of 1497 households is clustered at the village level (the grama niladhari administrative unit in Sri Lanka) targeting about 37.5 households in each of 40 villages across 10 districts.
With a selected statistical power of 0.8, and allowing for 0.05 probability of a type I error with an intra-cluster correlation of 0.1, the minimum detectable effect for the variables of interest (expressed relative to a variable’s standard deviation) is 14.3%.
In the second round of surveys, the sample was designed to provide a balance between CKD-affected and other households, and so the sampling strategy intentionally over-sampled the CKD households relative to their prevalence in the populations under study (based upon prevalence estimates from the first round of the survey). Since the number of households varies by village, and the number of villages varies by district, so too will the (known) probability of selecting a given household in the sample. To accommodate these differences, probability weights were constructed for each of the 1497 households in the sample, and these weights are used throughout the statistical analysis.
Two statistical methods were employed to analyse these data and to answer the research questions posed: t-tests and regression analysis. A two-sample (unpaired), two-sided t-test enables the testing of the null hypotheses of no differences in the (proportionally weighted) means of specific variables between sub-populations of interest. These sub-populations are: CKD-affected households versus all others; and households that by 2018 had already adopted reverse osmosis as their primary household source versus those that had not.
To answer some of the research questions, multiple regression analysis was employed with a linear probability model.Footnote1 In each case, the dependant variable was categorical (binary). The use of the linear probability model instead of using alternative estimators such as probit and logit has two advantages: it facilitates the interpretation of the estimated parameters; and it addresses heteroscedasticity – a condition in which variability in the dependent variable changes with values of an independent variable. As an illustrative example, here is how one may interpret the regression estimates of households’ propensity to adopt reverse osmosis as their primary domestic water source. An estimated parameter value of, say, 0.30 for those households reliant on springs as their primary source of drinking water – also a categorical variable – suggests that households that were reliant on spring water in 2017 had a 30% higher propensity to adopt reverse osmosis compared with households using the default water source: harvested rainwater (, column 2).
Results
The survey results provide a new and informative picture of trends in households’ primary water sources that sets the stage for consideration of the specific research questions. Recall that 100% of surveyed households had used groundwater as their primary household source for at least five years in the preceding 20 years. The historical use of different water sources by these households between 1999 and 2017 is shown in . By 2017, based on population-weighted estimates, about 35% of households continued to rely on household wells as their primary source for drinking and cooking uses (household well by bucket: 28.1%; household well by pump: 7.2%). The share of households using water treated by reverse osmosis in 2017 was 52.0%, and the share using piped water from municipal distribution systems was 7.1%. All other alternative sources combined accounted for the other 5.6% of households surveyed. reveals some growth in the use of pumps with household wells in the interval 2008–13, after which there was a sharp move to the use of reverse osmosis.
Figure 1. Shares of households’ primary water sources by year
Consider next the answers to each of the seven research questions, in turn.
Households’ perceptions of the risk of drinking local groundwater
To assess householders’ perceptions of the risk of contracting CKD from drinking local groundwater, some hypothetical questions were asked that would keep the anticipated responses independent of each household’s own health history or its prior tenure using specific water sources. Respondents were asked to imagine a new family that arrives in their village and starts to consume drinking water, from either a typical village well or the well used longest in the past by the respondent household. Respondents were asked to estimate the probability, on a scale of 0–10, that an adult member of the new family would develop kidney disease by drinking water from that well during several future time horizons, from one to 20 years.
presents the results for the one-, five-, 10- and 20-year time horizons in three different ways. Column (2) shows the results for all 1497 households. Columns (3) to (5) test the null hypothesis that there is no difference in mean responses to these questions between the 673 CKD-affected households and the other 824 households. Columns (6) to (8) test the null hypothesis that there is no difference in mean responses to these questions between the 660 households who were the early adopters of reverse osmosis and the other 837 households.
Table 1. Respondents’ estimates of the probability of a newly arrived adult experiencing kidney disease in future from drinking untreated local groundwater, where 0 = low or nil and 10 = most likely
On average, all respondents rated the risk as 1/10 after one year, 2/10 after five years, 3.5/10 after 10 years and 5/10 after 20 years when drinking from a typical well. For the respondents’ own (current or former) well, the risks were perceived as higher (> 1/10; 2.4/10; 3.9/10; 5.3/10). The subgroup of CKD-affected households perceived the risks to be higher than households not affected, rejecting the null hypothesis (of no significant difference) in five of the eight cases at either the 5% or 1% level of significance. The subgroup of reverse osmosis households perceived the risks to be higher than did households using other drinking water sources, rejecting the null hypothesis in all eight cases at the 1% level of significance. All four of these subgroups thought that the disease risk increases with time, and all subgroups viewed their family’s own well to be riskier than a typical well in their village over a five- or 10-year time horizon.
Households’ assessment of the safety of alternative sources
Using a 0–10 scale, householders were asked to assess the safety of five types of water sources, with higher digits reflecting greater perceived safety. presents the results overall, as well as reporting the results of hypothesis tests for the same two sub-populations examined in .
Table 2. Householders’ perceptions of the safety of alternative drinking water sources, where 0 = not at all safe and 10 = completely safe
As reported in columns (1) to (3), (5) and (6), reverse osmosis is perceived to be the safest of these alternative sources of drinking water by these households (all of whom were previously reliant on groundwater as their primary source). Next, in decreasing relative order of perceived safety, are: village-piped water; municipal water; water delivered by a tanker vehicle; and rainwater harvesting. In most cases, one cannot reject the null hypothesis that the means are the same across the two pairs of subgroups, except for the perception among those who are CKD-affected and those who adopted reverse osmosis earlier that water delivered by tanker is less safe – significant at the 10% level – than perceived by the other households.
Households’ trust in water supply institutions
With a 0–10 scale, where 0 represents no trust and 10 represents complete trust, householders were asked to rate each of three types of water supply agencies or institutions: government (including public agencies such as the National Water Supply and Drainage Board and the navy), a non-governmental organization (NGO) or a private company. As shown in , householders place the greatest trust in the government to provide them with safe drinking water (8.0 points out of 10), while trust scores for an NGO (6.1/10) and for a private company are lower (4.4/10). The CKD-affected households place somewhat more trust in government and less trust in a private supplier than do households that are not affected, otherwise there are no statistically significant differences in the scores between the four subgroups.
Table 3. Householders’ expressions of trust in alternative providers of safe drinking water, where 0 = no trust and 10 = complete trust
Households’ most preferred alternative source
Householders were asked which single alternative they would choose as their drinking water source if the household were required to give up their current source. The probability-weighted means were generated from 1475 of the 1497 households, since some households did not know or chose ‘other’ when presented with a specific list of options. In order of preference, the responses were: government-supplied piped connection, 63.6%; water obtained from an reverse osmosis system in the village, 15.2%; private household well or agrowell, 10.6%; draw water from river, canal, pond or lake, 2.4%; spring water, 1.6%; household well or agrowell owned by multiple households, 2.6%; all other alternatives combined, 4.0%. This latter category includes specific choices among public or private rainwater harvesting; household wells or agrowells owned by the government; bottled water; and water delivered by a tanker truck – each of which represents the preferences of < 2% of the population.
The observation that more than half of the responses hypothetically chose a government-supplied piped connection suggests that respondents did not feel constrained in their responses by budgetary cost or by the choices that were currently or foreseeably available to them in many of these rural and relatively remote villages. These aggregate responses are not consistent with households basing their responses on the perceived safety of the drinking water alone (). The question did not specify whether a piped connection would extend to each residence or would terminate at one or more public tap stands, for example. Drinking water piped to a household could potentially enable an increase in other valuable uses (e.g., bathing, cleaning, livestock water, limited irrigation) in addition to drinking and cooking, and could add time savings and convenience as valuable supply attributes.
Uptake of reverse osmosis drinking water by households
provides information on how widely reverse osmosis represents the primary source of water for drinking and cooking when compared across the 10 most CKDu-affected districts in Sri Lanka. The listing of districts down the left column reflects their general geographical position from north to south, revealing a relatively lower reliance upon reverse osmosis drinking water in the southern districts.Footnote2 shows that about 49% of all households used reverse osmosis as their primary source of drinking water in 2018, spending an average of 17 min per round trip (inclusive of collection time) to obtain water from the reverse osmosis plant in their village. The overall degree of reliance upon reverse osmosis as a treatment technology is no doubt larger since some of the water delivered by tanker vehicle has been treated by reverse osmosis, while some comes from municipal treatment facilities.
Table 4. Share of households by district whose primary drinking water source in 2018 was reverse osmosis, and time and monetary costs incurred by those households to access reverse osmosis-treated water
For the entire study area sampled, the share of households using reverse osmosis water fell from 52% in 2017 () to 49.1% in 2018 (, column 2, final row) and the fall was statistically significant at the 1% level (t = 7.2). The fall in the reverse osmosis share coincides with a rise in municipal piped water use, from 7.1% in 2017 to 12.5% in 2018. The increase is also statistically significant at the 1% level (t = 8.02). As discussed further below, households in some divisional secretariats do not have ready access to reverse osmosis water. An increase in the provision of piped water in these areas provides households with an alternative to traditional groundwater sources, and does not necessarily signal any substitution away from reverse osmosis. It is not possible with these data to isolate which transitions among water sources are predominantly motivated by changes in available supply versus changes in household demand across available alternatives.
Reverse osmosis plants are managed and operated variously by governments, NGOs, religious temples, schools and private suppliers, but primarily by numerous community-based organizations. Some of these suppliers charge the householders fees for the water (and, in some cases, for ancillary services such as for containers and container cleaning). Some suppliers impose limits on the daily supply (typically about 25 litres per day per household for suppliers with limits), either seasonally or year round. As reported in , 28.4% of households who choose reverse osmosis as their primary supply do so without paying for it. Among those without free access (the other 71.6% of reverse osmosis-reliant households) the average price per litre is LKR1.11/litre of reverse osmosis water. For a 25-litre container, this is equivalent to about US$0.15 per container at recent market exchange rates (LKR180 = US$1) or to US$0.56 per container when converted at purchasing power parity (LKR50 = US$1).
Perceived barriers to the adoption of reverse osmosis
In the interviews, those householders who, by 2018, had not adopted reverse osmosis as their primary drinking water supply were asked to choose one or more of several possible explanations for this decision. These include lack of ready access; the expense; their rejection in principle of paying for water; and their view that their current source was safe enough. ‘Other’ and ‘don’t know’ were permitted answers. presents the results, proportionally weighted to reflect shares of the target population.
Figure 2. Households’ reasons for not choosing reverse osmosis as their primary drinking water source, by district
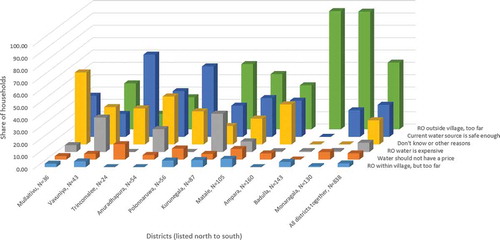
The listing of the names of the 10 districts from left to right in reflects their general geographical position from north to south in Sri Lanka. Thus, concerns about lack of access dominate in the southern districts, where the principal reported constraint is not having access within the village (versus fewer concerns about distance within their own village). Those not using reverse osmosis in the more northern districts were more likely to express views that: their current source is safe enough; ‘other’; and ‘don’t know.’ The expense of reverse osmosis water is cited in only a few districts. Kurunegala is one of the districts where householders expressed concerns about the monetary expense of reverse osmosis water, yet the pricing data in show that this constraint is not universal there. That is, even in Kurunegala district, households sampled within some of the divisional secretariats (administrative subdistricts) received their reverse osmosis water for free.
Understanding household behavioural decisions
To answer the seventh in the series of research questions, the analysis draws upon (probability-weighted) multiple regression analysis. This approach allows examination of factors that are correlated with separate household decisions: to treat the water consumed at home before drinking it; to adopt reverse osmosis; and to adopt alternatives other than untreated groundwater as the primary source of drinking water in the home. This analysis can control for several confounding influences such as household size and composition, educational attainment, and (by proxy) household wealth. The resulting estimates should be interpreted as indicating correlation with the decisions under study and not with causation, since, for example, households were not randomly assigned to the sample subgroups.
presents the estimates for four regression models that have a similar structure and similar explanatory variables. In each case, a binary dependent variable is regressed on a series of continuous, categorical and binary explanatory variables using a linear probability model. The estimated coefficients incorporate probability weighting from the sample design, and the reported robust standard errors are clustered at the village level.
Table 5. Household decisions about primary drinking water sources and water treatment practices: results from linear probability models
in Appendix A below provides a descriptive summary of variables used in the regression analysis. Households are assigned a value of unity for each of the following dependent variables, and 0 otherwise: the household treated water before drinking it in 2017; the drinking water source in 2018 was reverse osmosis water; and the 2018 drinking water source was an improved source other than reverse osmosis.
Explanatory variables included in the model are: a binary indicator for a CKD-affected household; subjective probabilities of getting CKD if drinking water for 20 years from a typical community well and one’s own well; perceived safety (0–10) of water from alternative sources; trust in institutions (0–10) that provide improved water sources; a binary indicator for whether the primary groundwater source used for the longest period in the previous two decades was < 10 m deep; and a binary variable indicating whether the household’s primary source of drinking water was tested at least once since 2000. Household characteristics include a binary indicator for whether the household roof is built of improved roofing materials (clay tiles, bricks or cement); a binary indicator for whether the household had any income from non-farm sources in 2018; the number of resident adults; the number of resident females; and a binary indicator for whether the household had at least one adult resident in 2018 with 12th grade educational attainment or higher. Roofing materials may serve as a proxy for wealth, where the use of clay tile, bricks or cement is significantly more expensive than more common alternatives such as asbestos tile, sheet metal or thatch. The explanatory variables also include binary variables to identify each household’s primary water source in 2017.
The decision to treat the water consumed at home before drinking it
Column (1) in reports these estimates, based on the responses of 1496 of the households surveyed. The dependent variable takes a value of unity if, in 2017, the household boiled their water before drinking it; or poured it through a cloth or filter; or treated the water with water treatment tablets, bleach, alum or iodine. Those (statistically significant) factors that are associated with the adoption of home water treatment practices include: having a shallow well; having tested the groundwater historically; and having any non-farm income. Factors associated with not adopting home water treatment include: placing more trust in NGO water suppliers, and, by 2017, having already switched from groundwater as a primary source to bottled water, reverse osmosis, municipal water service or delivery by tanker vehicle.
The decision to adopt reverse osmosis as the primary drinking water source
In column (2) in , the dependent variable takes a value of unity if, in 2018, the household reported reverse osmosis as the primary drinking water source, and 0 otherwise. To focus on the reverse osmosis adoption decision, this analysis includes only those villages where, by 2018, there were any sampled households reporting reverse osmosis reliance. That is, if water treatment by reverse osmosis were not available in a village in 2018, then all the responses from that village were excluded from this regression model. Thus, the resulting estimates are based on the responses of 1141 households.
Those (statistically significant) factors that are associated with adoption of (available) reverse osmosis treatment include: having a higher subjective probability that drinking water from one’s own well for 20 years would result in kidney disease; having a roof made of superior materials; having more adults in the household; relying in 2017 on drinking water from a household well, a spring, or bottled water, or, by 2017, having already switched to reverse osmosis as the primary source of drinking water. Having had the groundwater tested in the past led to a lower uptake of reverse osmosis, as did having a higher perception of the safety of water delivered by tanker.
The decision to adopt other improved primary sources of drinking water
Especially since not all villages had local access to reverse osmosis treatment in 2018, and in light of encouragement to households to move away from groundwater, columns (3) and (4) of examine the decision to adopt other improved water sources, excluding reverse osmosis. The dependent variable takes a value of unity if, in 2018, the household reported that their primary source of drinking water was any of the following alternative sources: piped water; harvested rainwater; or water delivered by a tanker vehicle; and 0 otherwise. Column (3) reports on a model that analyses these responses across all 1496 households, whereas column (4) only analyses the responses collected in those villages without local access to reverse osmosis in 2018, relying upon the responses of 355 households.
When viewed across all households, column (3) shows a statistically significant positive influence of higher levels of trust in NGO suppliers on the use of water from improved sources. Factors that work against the primary use of these other improved alternatives include having village-level access to reverse osmosis; and in 2017 having as a primary water source any of the alternatives other than municipal piped water or harvested rainwater.
The pattern of responses (, column 4) is markedly different when one focuses only on the 355 households in villages where reverse osmosis was not available in 2018. Those (statistically significant) factors that are associated with the primary use of other improved sources include: being a CKD-affected household; living in a village with a higher prevalence of CKD; having tested the groundwater historically; higher educational attainment; and, by 2017, being reliant upon a household well, reverse osmosis, municipal water service or harvested rainwater. Note that this analysis could include households who were reliant upon reverse osmosis in 2017 and that might later switch to a municipal supply, for example. Factors associated with not adopting other improved sources (when reverse osmosis is not an option) include: having a higher subjective probability that drinking water from one’s own well for 20 years would result in kidney disease; having a roof made of superior materials; and having income from non-farm sources.
Discussion
In Sri Lanka, the largest part of the public efforts to prevent CKDu have focused on encouraging households to cease their consumption of untreated groundwater for drinking and cooking purposes, and to move to reverse osmosis, rainwater harvesting, piped water or water delivery by tanker vehicles. Analysis of the data collected here shows the magnitude of the significant uptake of these alternatives in those regions of the country where CKD and CKDu are most prevalent, and where communities were historically reliant upon untreated groundwater.
It is outside the scope of this study to assess whether or not the publicly supported programmes to provide reverse osmosis treatment and other water supply alternatives have been undertaken in a manner that is effective in changing health outcomes, is cost effective or sustainable. Since alternatives to untreated groundwater have been deployed relatively recently, it is not yet known whether or not household adoption of any of these alternatives reduces the likelihood of residents contracting chronic kidney disease or CKDu relative to an alternative choice. This issue merits study over the longer term. Even where a household adopts reverse osmosis or rainwater as its primary source of drinking water, it is not known how the expected effects on health outcomes might be influenced if residents do not exclude food and drink from all other sources, especially during times when water treated by reverse osmosis is rationed. Scientifically validated studies have not yet established how householders’ continuing bodily contact with untreated surface or groundwater might influence chronic kidney health outcomes, such as when people use multiple water sources for cooking, bathing and irrigating, or when residents routinely get wet outdoors.
Conclusions
Almost all households in the most CKD-affected rural areas of Sri Lanka formerly relied upon untreated groundwater for drinking and cooking, but by 2018 that share had dropped to about one-third of households. About half of households now consume water treated by reverse osmosis, and others rely on other alternatives such as rainwater harvesting, piped water, surface water and water delivery by tanker vehicle. Statistical analysis of data from a survey of about 1500 households supports the first available estimates that are representative of the 10 districts most affected by CKD and CKDu nationally.
Households perceive that drinking untreated well water will lead to a risk of kidney disease that grows with the duration of this water consumption, but they place trust in reverse osmosis-treated water, especially when provided by government. Householders report that consuming reverse osmosis water is costly in terms of their own collection time and the prices charged by some suppliers, and that, in some villages, reverse osmosis is not available. A majority of households would prefer to move to piped water as their primary source if a change were required. Households’ propensity to treat their water and to adopt reverse osmosis and other alternatives is shown to correlate statistically with several of these household perceptions and beliefs, as well as with characteristics of the households’ past water use and health status, and with household demographics.
For decision-makers who seek to assess or reform public policy and public investments directed at CKD and CKDu in Sri Lanka, the results presented here provide a clear, new and statistically representative picture of household behaviour in the most seriously affected districts. This information about householders’ perceptions, preferences and motivations can guide ongoing efforts to move households away from consuming untreated groundwater (as a precautionary strategy), including targeted provision of public information and education, and the prioritization of regulatory interventions and infrastructure investments. In other countries where CKDu is newly emergent, some extrapolation from key elements of Sri Lanka’s recent experience could offer valuable and time-saving guidance.
Acknowledgments
The authors gratefully acknowledge the constructive comments and suggestions from Priyanie Amerasinghe, Rohana Chandrajith, Saroj Jayasinghe, Nishad Jayasundara, Chandani Liyanage, Herath Manthrithilake, Karina Meredith, Subhrendu Pattanayak and David Stifel. Any errors are those of the authors alone.
Disclosure statement
No potential conflict of interest was reported by the authors. The study design, protocol and data collection were approved by the Ethics Review Committee for Social Sciences and Humanities of the University of Colombo [reference number ERCSSH/18/06].
Additional information
Funding
Notes
1. Estimation of the linear probability models was implemented using the svy: regress command in version 15 of Stata, which generates standard errors for these parameter estimates that are robust and clustered at the village level.
2. The switch to reverse osmosis started around 2014 (), when many reverse osmosis units were deployed by the government. A debate emerged about the potential connections between specific agricultural chemicals, soil metals and CKDu. These hypotheses, along with other changes in water hardness and taste reported by Jayasumana et al. (Citation2015), may have contributed to households’ change of drinking water sources.
References
- Balasubramanya, S., Pfaff, A., Bennear, L., Tarozzi, A., Ahmed, K. M., & van Geen, A. (2014). Evolution of households’ responses to the groundwater arsenic crisis in Bangladesh: Information on environmental health risks can have increasing behavioral impact over time. Environment and Development Economics, 19(5), 631–647. https://doi.org/10.1017/S1355770X13000612
- Balasubramanya, S., Stifel, D., Horbulyk, T., & Kafle, K. (2020). Chronic kidney disease and household behaviors in Sri Lanka: Historical choices of drinking water and agrochemical use. Economics and Human Biology, 37, 100862. https://doi.org/10.1016/j.ehb.2020.100862
- Caplin, B., Yang, C.-W., Anand, S., Levin, A., Madero, M., Saran, R., Jayasinghe, S., de Broe, M., Yeates, K., Tonelli, M., Jakobsson, K., Strani, L., Ruggiero, A., Glaser, J., Martin, E., Pearce, N., & Wijewickrama, E. (2019). The International Society of Nephrology’s international consortium of collaborators on chronic kidney disease of unknown etiology: Report of the working group on approaches to population-level detection strategies and recommendations for a minimum dataset. Kidney International, 95(1), 4–10. https://doi.org/10.1016/j.kint.2018.08.019
- Cooray, T., Wei, Y., Zhong, H., Zheng, L., Weragoda, S. K., & Weerasooriya, R. (2019). Assessment of groundwater quality in CKDu affected areas of Sri Lanka: Implications for drinking water treatment. International Journal of Environmental Research and Public Health, 16(10), 1698. https://doi.org/10.3390/ijerph16101698
- Gifford, F. J., Gifford, R. M., Eddleston, M., & Dhaun, N. (2017). Endemic nephropathy around the world. Kidney International Reports, 2(2), 282–292. https://doi.org/10.1016/j.ekir.2016.11.003
- Jayasumana, C., Paranagama, P., Agampodi, S., Wijewardane, C., Gunatilake, S., & Siribaddana, S. (2015). Drinking well water and occupational exposure to herbicides is associated with chronic kidney disease, in Padavi-Sripura, Sri Lanka. Environmental Health, 14(6). https://doi.org/10.1186/1476-069X-14-6
- Jayasumana, C., Ranasinghe, O., Ranasinghe, S., Siriwardhana, I., Gunatilake, S., & Siribaddana, S. (2016). Reverse osmosis plant maintenance and efficacy in chronic kidney disease endemic region in Sri Lanka. Environmental Health and Preventive Medicine, 21(6), 591–596. https://doi.org/10.1007/s12199-016-0580-9
- Johnson, R. J., Wesseling, C., & Newman, L. S. (2019). Chronic kidney disease of unknown cause in agricultural communities. New England Journal of Medicine, 380(19), 1843–1852. https://doi.org/10.1056/NEJMra1813869
- Rajakarunanayake, A., & Ariyananda, T. N. (2018, November 28–29). Rehabilitation of disused rain water harvesting systems [ Paper presentation]. International Conference on Water Security through Rain Water Harvesting, Colombo, Sri Lanka. Retrieved November 15, 2020, from http://www.lankarainwater.org/symposium-proceedings/
- Rango, T., Jeuland, M., Manthrithilake, H., & McCornick, P. (2015). Nephrotoxic contaminants in drinking water and urine, and chronic kidney disease in rural Sri Lanka. Science of the Total Environment, 518–519, 574–585. https://doi.org/10.1016/j.scitotenv.2015.02.097
- Wijewickrama, E. S., Gunawardena, N., Jayasinghe, S., & Herath, C. (2019). CKD of unknown etiology (CKDu) in Sri Lanka: A multilevel clinical case definition for surveillance and epidemiological studies. Kidney International Reports, 4(6), 781–785. https://doi.org/10.1016/j.ekir.2019.03.020
- Wijkström, J., Jayasumana, C., Dassanayake, R., Priyawardane, N., Godakanda, N., Siribaddana, S., Ring, A., Hultenby, K., Soderberg, M., Elinder, C.-G., & Wernerson, A. (2018). Morphological and clinical findings in Sri Lankan patients with chronic kidney disease of unknown cause (CKDu): Similarities and differences with Mesoamerican Nephropathy. PLoS ONE, 13(3), e0193056. https://doi.org/10.1371/journal.pone.0193056
- World Health Organization (WHO). (2013). Chronic Kidney Disease of Unknown Origin (CKDu): National Research Programme for Chronic Kidney Disease of Unknown Origin (CKDu) in Sri Lanka. World Health Organization
- World Health Organization (WHO). (2016). Report of the international expert consultation on chronic kidney disease of unknown etiology (CKDu) in Sri Lanka. World Health Organization, Country office for Sri Lanka. Retrieved November 15, 2020, from https://apps.who.int/iris/handle/10665/255137
Appendix A
Table A1. Descriptive statistics of key variables