
Abstract
This study aimed to quantify the primary salinity, sodicity and alkalinity of South African soils based on soil classification groups and rainfall classes, by using available analysed data. The 73 soil forms used by the Soil Classification Working Group were organised into 11 groups based on the occurrence of specific horizons. Soil analyses of 12 552 profiles for pHwater, 11 712 profiles for electrical conductivity, and 12 174 profiles for exchangeable sodium and cation exchange capacity were used. Median and not average values best represented salt-affected soil data on a national scale, because most data was strongly positively skewed. Primary soil alkalinity and sodicity were more common than primary salinity in terms of the different South African soil groups. None of the soil groups were saline, only the prismacutanic group was sodic, while the calcic, alluvial/aeolian, neocutanic and prismacutanic groups were alkaline when the median value or highest value in a profile was used as indicator. Sufficient data was not available, even for this relatively large dataset of 648 prismacutanic B-horizons, to proclaim a precise exchangeable sodium percentage value as a criterion for prismacutanic or solonetz soils in South Africa. Salinity, sodicity and alkalinity decreased as rainfall increased due to the depletion of cations and anions. The incidence of salt-affected soils in the soil classification groups decreased in the order: calcic ≥ alluvial/aeolian > prismacutanic > vertic > pedocutanic/red structured > neocutanic > hydromorphic ≥ lithosols > plinthic > apedal > podzolic. This information serves as an indicator of the primary sodicity and alkalinity of South African soils and can be utilised to deduce the expected sodicity and alkalinity of soils from soil survey data, to monitor anthropogenic sodicity and alkalinity impacts, and as an input to map the primary sodicity and alkalinity of South African soils.
Introduction
Salt-affected soils are represented differently in different soil classification systems and appear on different taxonomical levels (Szabolcs Citation1997). Although sodium is not used, the presence of free carbonates, calcium carbonate, or calcium-magnesium carbonate is used in the South African soil classification system (Soil Classification Working Group Citation1991) to define diagnostic horizons, materials and families.
Soils are inherently variable, both spatially and temporally, in their physical and chemical characteristics. Usually the variability is much greater vertically than horizontally, resulting from the variability in soil-forming processes. Soil variability, in turn, results in variability in the distribution of water and salts and in the ease with which they are transported within and removed from the soil. Salts move from the topsoil to the subsoil during wet periods and from the subsoil to the topsoil during dry periods (Nell and Lea Citation2004). This vertical fluctuation makes the quantification of salts per horizon complex, unless a large data set is used to lessen the effect of temporal variation.
Salt-affected soils generally occur in regions that receive salts from other areas and where water is the primary carrier (FAO Citation2001). Although the weathering of rocks and minerals is the source of all salts, the salt-affected soils are rarely formed from in situ accumulation of salts. A well-developed profile in low rainfall areas usually carries at some point (usually in the C-horizon) a calcium carbonate accumulation greater than that of its parent material (Brady Citation1990). Soluble salts occur in significant proportions in the soils of arid and semi-arid areas where they accumulate because annual precipitation is insufficient to leach the salts. According to Netterberg (Citation1969), hardpan and boulder calcretes generally only occur in areas receiving less than 550 mm rain per year.
Van der Merwe (Citation1940) concluded that saline soils in South Africa do not occur in extensive areas or a specific climatogenic soil zone, but are found in small to fairly big patches in several soil groups, due to localised factors. He did, however, classify and map ‘Solonetzic Soils‘ as one soil group in his study on the ‘Soil Groups and Subgroups of South Africa’. According to him, this soil group, occurring in the south-central Free State, covers a fairly extensive area and lies between the Prairie Soils in the east, the Kalahari Sand on Limestone in the northwest, and the Karoo or semi-desert soils in the west. The major portion of this soil group occurs in the Free State province, with two comparatively small areas in the Eastern Cape province. One area is confined to the Burgersdorp area and immediate surroundings, while the other has Queenstown as its centre. MacVicar (Citation1972) produced a sketch map giving a tentative indication of the occurrence of salt-affected soils in South Africa, without quantifying the area or the intensity of the problem. According to him, it is not possible to make meaningful statements about the associated salt-affected soils in each map unit at this scale. No subsequent summary of salt-affected soils in South Africa has been done.
The aim of this study was therefore to quantify the primary salinity, sodicity and alkalinity of South African soils using available analysed data, based on soil classification groups and rainfall classes. A second paper (Nell and van Huyssteen Citation2014) discusses the relationship between primary soil salinity, sodicity and alkalinity with geology and groundwater regions.
Methodology
Soil samples (n = 21 252), collected by the Agricultural Research Council (ARC)–Institute for Soil, Climate and Water during various soil surveys for irrigation, environmental planning and from the national land type survey were used in this study. Minimum requirements for inclusion were (1) the profiles should have comprehensive chemical and physical analyses, (2) accurate profile location information should be available and (3) only data for primary (non-anthropogenic) profiles were used. A total of 11 712 profiles for electric conductivity, 12 552 profiles for pHwater and 12 174 profiles for exchangeable sodium percentage (ESP) were used due to differences in analyses.
Coordinates of the profiles were imported into ArcView 9.2 (ESRI, Redlands, CA, USA) to map the positions of the profiles. Profile locations were digitised from 1:50 000 topo cadastral maps (Chief Director of Surveys and Mapping Citation1993) published in the Clark 1880 ellipsoid (Cape datum), converted to the WGS84 ellipsoid and overlaid with other spatial data ().
Soil samples were analysed for pHwater, electrical conductivity (EC) and cation exchange capacity according to the Non-Affiliated Soil Analysis Work Committee (Citation1990). Soil samples in the database were predominantly analysed for CEC and extractable sodium using NH4OAc (1 mol dm–3, pH 7) as extractant. Less than 12% of samples used in this study were analysed by LiCl extraction. These samples were also predominantly from the higher rainfall areas in South Africa and therefore largely non-saline and non-sodic. Any discrepancies in the results between the two methods were therefore expected to be negligible for the purpose of this study and were therefore pooled. Sodium and electrical conductivity were also determined by suction filtration of the water-saturated soil paste. Soil pH was determined using a 1:2.5 soil to water suspension. Alkalinity and acidity was classified according to van der Watt and van Rooyen (Citation1995).
All the values in the profile were used for calculation, because of the dynamic nature of salts in a profile due to climatic factors, especially rainfall. The soil profile was regarded as an array of layer attributes (Williams Citation1976), equivalent to the A (topsoil), B and C (subsoil) master horizons. The soil profile was further considered to be an isotropic body where only the highest value occurring in a profile was used. All A master horizons were considered as topsoil, while B, C and E master horizons were considered as subsoil.
The 73 soil forms of the Soil Classification Working Group (Citation1991) were organised into 11 groups predominantly based on distinctive subsoil horizons or material (). The groups therefore primarily focused on the pedogenic accumulation of carbonates, structure development and wetness. Soil profiles classified according to MacVicar et al. (Citation1977) were reclassified by the authors according to the Soil Classification Working Group (Citation1991).
Table 1: Grouping of soil forms (Soil Classification Working Group Citation1991; Fey Citation2010) based on the presence of specific diagnostic horizons or materials
Data for EC, ESP and pHwater data were ranked from highest to lowest median values to establish which soil groups were most affected by salts. The soil groups with the highest median value were ranked 11th and those with the lowest median value were ranked first. The median and geometric mean was then calculated for each soil group, but because some soil groups had the same median ratings the geometric mean was used to rank the different soil groups (from the most likely to the least likely to be affected by salts). Primary soil alkalinity was taken as pHwater>7.4, sodicity at two values, namely ESP>6% and ESP>15%, and salinity as EC>400 mS m-1 (United States Salinity Laboratory Staff Citation1954).
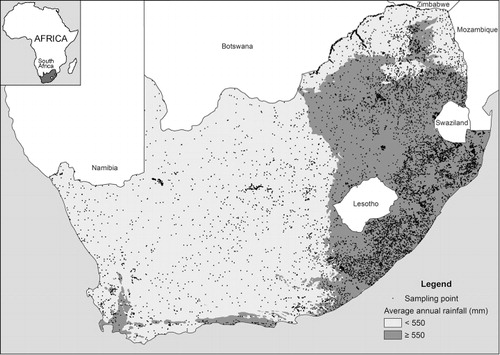
South Africa was divided into a high (>550 mm) and a low (< 550 mm) rainfall area. An average annual rainfall value for each profile was obtained by overlaying the profile points with the modelled 1 km × 1 km average annual rainfall grid of the ARC–Institute for Soil, Climate and Water ().
Medians, averages (geometric mean), lower quartiles and upper quartiles were used to identify relationships between the soil groups (Statgraphics Citation2005). The 95% Bonferroni multiple comparison procedure was used to determine significance differences (p<0.05) of means between the rainfall classes. In this study outliers were considered to be ‘any observation that is not a realization from the target distribution’ rather than ‘any observation that appears surprising or discrepant to the investigator’ (Beckman and Cook Citation1983).
Results and discussion
The large differences between the median and average values for salinity (–) and sodicity (–) indicated the variability and skewness of the data. Division of the soil groups into high and low rainfall classes did not remove the skewness from the salinity and sodicity data. Outliers with values several-fold percent higher than the lowest value were not unusual. The small differences between the average and median pHwater values (–) indicated a normal distribution pattern.
Table 2: Statistics for electrical conductivity (mS m−1) values in the topsoil horizons of the different soil groups
Table 3: Statistics for electrical conductivity (mS m−1) values in the subsoil horizons of the different soil groups
Table 4: Statistics for the highest electrical conductivity (mS m−1) value in a profile of the different soil groups
Table 5: Statistics for exchangeable sodium percentage values in the topsoil horizons of the different soil groups
Table 6: Statistics for exchangeable sodium percentage values in the subsoil horizons of the different soil groups
Table 7: Statistics for the highest exchangeable sodium percentage values in a profile of the different soil groups
Table 8: Statistics for pHwater values in the topsoil horizons of the different soil groups
Table 9: Statistics for pHwater values in the subsoil horizons of the different soil groups
Table 10: Statistics for the highest pHwater value in a profile of the different soil groups
Electrical conductivity
Significant differences were found between rainfall classes for median EC based on both the topsoil and subsoil values, namely calcic, alluvial/aeolian, neocutanic, lithosols, pedocutanic/red structured, hydromorphic, prismacutanic, apedal and plinthic soil (–). This indicated the importance of rainfall class and therefore leaching on salt movement, even within the same soil group. No significant differences were recorded between rainfall classes for the topsoil and subsoil of vertic and podzolic, and for the topsoil of the plinthic group. Possible reasons for this inconsistency were that the leaching potential for vertic soils was much lower than that for other soil groups (because of the high clay content and resulting low infiltration rate). The podzolic soils were mostly found in areas where the annual rainfall was >550 mm. For the plinthic group, the capillary movement of water and salts from the fluctuating water table in the subsoil to the topsoil occurred both under low and high rainfall conditions to the same degree.
There was a decrease in median EC values for all the topsoil horizons in the order: vertic > alluvial/aeolian > calcic > neocutanic > pedocutanic/red structured > prismacutanic > lithosols > hydromorphic > plinthic > apedal > podzolic soil groups (). Eight of the 11 soil groups had significantly different median EC topsoil values between the rainfall classes.
Median EC values decreased for all the subsoil horizons () in the order calcic > alluvial/aeolian > prismacutanic > neocutanic > pedocutanic/red structured > hydromorphic > lithosols > plinthic > apedal > podzolic. When the highest value in a profile was used, EC decreased in the order vertic > calcic > prismacutanic > alluvial/aeolian > neocutanic > pedocutanic/red structured > hydromorphic > lithosols > plinthic > apedal > podzolic. The higher salinity in the neocutanic subsoils than the pedocutanic/red structured subsoils was not expected. This irregularity could be ascribed to the large amount of samples from the high rainfall class (more leaching) for the pedocutanic/red structured soil group compared to the neocutanic soil group. If median values from the low rainfall class was used, the sequence changed to calcic > alluvial/aeolian > prismacutanic > pedocutanic/red structured > neocutanic > lithosols > hydromorphic > apedal > podzolic. This was more in agreement with the findings of Nell (Citation1991) and Nell and Bennie (Citation1991) where an increase in salt content accompanied an increased degree of structural development (neocutanic to pedocutanic to prismacutanic). The apparent anomaly of the relatively high salt content values for the alluvial/aeolian soil group was attributed to the position of the alluvial soil in lower terrain units and the subsequent accumulation of salts and because most of the aeolian soils were found in low rainfall areas. Pedogenic changes were minimal in transported alluvial and aeolian soils, which were reflected in the low degree of salt leaching. The lowest EC for the topsoil, subsoil and highest value in a profile were respectively found in the plinthic, apedal and podzolic soil groups. This was an indication of good salt leaching conditions out of these soils.
The EC of 31 rainfall classes of subsoil horizons differed significantly (p < 0.05). Soil of the alluvial/aeolian group differed significantly from all other soil groups, except for soils in the vertic group. When the highest value in a profile was used, 35 rainfall classes showed significant differences for EC and again the alluvial/aeolian was the only group that was significantly different from all other groups.
Only the alluvial/aeolian and hydromorphic groups tended to be saline for the topsoil and subsoil horizons under the following conditions: when a 400 mS m−1 threshold value was used to separate saline from non-saline soils, < 550 mm rainfall class, and average values were used ( and ). When the highest average value in a profile was used, soils of the neocutanic and calcic groups (<550 mm rainfall class), as well as the alluvial/aeolian and hydromorphic groups tended to be saline ().
Exchangeable sodium percentage
Significant differences for median ESP in the topsoil and subsoil between rainfall classes occurred in the calcic, alluvial/aeolian, neocutanic, pedocutanic/red structured, hydromorphic, plinthic (subsoil), podzolic, prismacutanic, lithosols and apedal soil groups (–). This indicated the importance of rainfall and leaching on the movement of salts in general and on Na specifically, even within the same soil group. There were no significant median differences for the topsoil and subsoil between rainfall classes for vertic and plinthic soil groups or when the highest value in a profile was used, for the prismacutanic soil group. Possible reasons for this inconsistency was that the leaching potential for vertic soils was a great deal lower than for other soil groups, because of the high clay content and the swelling properties (low infiltration rate when wet and high water-holding capacity). According to Bresler (Citation1981), swelling of soil clay particles causes the size of larger soil pores to decrease. Dispersion and movement of clay platelets further block soil pores. The strong structure of vertic and prismacutanic soils are likely to cause the flow of water to be confined to macro-pore flow, which results in low leaching. The reason for the anomaly in the plinthic group was probably because of the capillary movement of water and salts from the fluctuating watertable from the subsoil to the topsoil, which occurred under both low and high rainfall conditions.
There was a decrease in sodicity as measured by the median ESP values for all topsoil horizons, ranging from alluvial/aeolian > prismacutanic > hydromorphic > vertic > neocutanic > pedocutanic/red structured > calcic > lithosols > plinthic > apedal and podzolic (). The order for the subsoil horizons ranged from prismacutanic > calcic > hydromorphic > alluvial/aeolian > neocutanic > lithosols > vertic > pedocutanic/red structured > plinthic > apedal = podzolic (). For the highest value in a profile, sodicity ranged from prismacutanic > podzolic > hydromorphic > calcic > alluvial/aeolian > vertic > neocutanic > plinthic > structured > lithosols ≈ apedal ().
The alluvial/aeolian group differed significantly from all other groups except from the hydromorphic group (). For the highest ESP value in a profile, 22 rainfall classes (two rainfall classes for 11 soil groups) were significantly different (p < 0.05), with the alluvial/aeolian and neocutanic groups both significantly different from four other groups.
Soils of the plinthic, apedal and podzolic soil groups had the lowest median ESP values in the topsoil () and subsoil () for the <550 and >550 mm rainfall classes. When the highest value in a profile was used, the podzolic soil group had the second-highest median ESP value. This anomaly was probably because some podzolic C horizons had a strong hydromorphic tendency and probably mainly occured on binary parent material. The most likely scenario, however, was that the podzolic soils were mostly found near coastal areas where atmospheric deposits of sodium from the ocean occurred and together with the low cation exchange capacity of podzolic soils resulted in relatively high ESP values. Ellis and van Laar (Citation1999) established for their study that soils with podzol B horizons have a higher reserve of sodium than soils without podzol B horizons and that trees planted closer to the sea accumulate more sodium in the leaves than those planted further away.
The prismacutanic soil group had the highest median ESP value (8.4%) for the subsoil horizons (), the highest median ESP value (10.1%) when the highest value in a profile was used (), and the joint highest median value (2.9%) for the topsoil horizons (). The classical concept of a solonetz therefore does not always apply for South African prismacutanic horizons. A reason for this is that certain prismacutanic horizons develop where the ESP values are less than 15% and in other circumstances soils with an ESP value of 15–20%, or even more, do not manifest prismacutanic morphological features. This is probably due other soil properties such as salinity, magnesium, mineralogy and anions also playing a role in clay dispersion (Emerson and Bakker Citation1973; Fey Citation2010).
When a median ESP value of 15% was used to separate sodic from non-sodic for both the topsoil and subsoil horizons, none of the soil groups were sodic ( and ). The topsoil of the hydromorphic and alluvial/aeolian soil groups (<550 mm rainfall class) were sodic (>15%) for average ESP values (). Similarly, the subsoil of the prismacutanic, hydromorphic, alluvial/aeolian, neocutanic and lithosols were sodic (>15%) when average ESP values were used (). For the highest average value in a profile, soils of the prismacutanic, hydromorphic, alluvial/ aeolian and neocutanic groups (<550 mm rainfall class) were sodic (>15%) when average ESP values were used, but not when median ESP values were used.
None of the topsoil group median values were sodic when a value of 6% was used to separate sodic from non-sodic soils. The subsoil horizons of the prismacutanic (both rainfall classes), calcic, hydromorphic, alluvial/aeolian and neocutanic soil groups were sodic (), when average values were used. For the average highest value in a profile (<550 mm rainfall class), soils of the prismacutanic, podzolic hydromorphic, calcic and neocutanic groups were sodic (). Sodicity was recorded for average ESP topsoil values (<550 mm rainfall class) in the hydromorphic, prismacutanic, neocutanic, calcic and alluvial/aeolian soil groups (). Most subsoil groups were sodic (<550 mm rainfall class), except for the podzolic and plinthic groups (). For the average highest value in a profile, most soil groups were sodic, except for podzolic (<550 mm rainfall class), as well as pedocutanic/red structured, lithosols and apedal when the annual rainfall was >550 mm ().
pHwater
The pHwater data was not skewed, with small differences between the median and average values (–), which was not the case for ESP and EC. There was a decrease in median pHwater for all topsoil horizons (), from the calcic > alluvial/aeolian > vertic > neocutanic > pedocutanic/red structured > prismacutanic > lithosols > hydromorphic > plinthic > apedal > podzolic soil group. For the subsoil horizons median from the calcic > alluvial/ aeolian > neocutanic > prismacutanic > pedocutanic/red structured > lithosols > hydromorphic > plinthic > apedal > podzolic soil group (). Highest value in a profile pHwater declined in the order calcic > alluvial/aeolian > vertic > neocutanic > prismacutanic > pedocutanic/red structured > hydromorphic > lithosols > plinthic > apedal > podzolic soil group ().
When the median pHwater in the topsoil was used (<550 mm rainfall class), the calcic soil group was strongly alkaline, alluvial/aeolian, vertic, lithosols and neocutanic soil groups moderately alkaline and soils of the pedocutanic/red structured groups were mildly alkaline (). When the median pHwater in the subsoil was used (<550 mm rainfall class), calcic, alluvial/aeolian, neocutanic and prismacutanic soil groups were moderately alkaline and pedocutanic/red and lithosols mildly alkaline (). When the median pHwater of the highest value in a profile was used (<550 mm rainfall class), calcic, alluvial/aeolian and neocutanic groups were strongly alkaline, vertic, prismacutanic and lithosols groups moderately alkaline, and pedocutanic/red structured and hydromorphic groups mildly alkaline (). Even under low rainfall conditions, the plinthic and podzolic soil groups were usually non-calcareous and when the median values were considered were classified as strongly acid to slightly acid.
Ranking salt-affected soils
To establish which soil classes were most affected by salts, the median EC, ESP and pHwater values were ranked from the highest to the lowest median value. Soil classes with the highest median value for each of the three variables were assigned 11 and the lowest median value was assigned one. The median and average were then calculated for each soil class (). The calcic soil group was the most salt-affected. There was, however, not much difference between the ranking for the calcic group and the alluvial/ aeolian group, probably due to the limited pedogenesis expected in these soils resulting in minimal leaching of salts. At the other extreme were the prismacutanic soils that were in a mature stage of pedogenesis, which were strongly affected by sodicity and alkalinity in the B-horizon. The apedal and podzolic soil groups, which as a rule had a sandy texture and where leaching of salts naturally occurred, also had the lowest ranking in terms of salt-affectedness.
Table 11: Soil groups affected by salts (average ranking for electrical conductivity, exchangeable sodium percentage and pHwater) in decreasing order
Conclusions
Simple statements about salinity, sodicity and alkalinity in soils must be seen against the background of the ever-present variation observed between and within soil groups, which must be taken into account in all analyses. Median and not average values best represented soil data, because most data were strongly positively skewed with large differences between median and average values.
There was a strong relationship between rainfall, salt occurrence and salt movement. The >550 mm rainfall class had a reduced salinity, sodicity and alkalinity due to increased leaching of cations and anions. Significant differences in median EC, ESP and pHwater occurred in the topsoil and subsoil between rainfall classes within the calcic, alluvial/aeolian, neocutanic, pedocutanic/red structured, hydromorphic, plinthic (in the subsoil), prismacutanic, lithosols and apedal soil groups.
Primary alkalinity (pHwater>7.4) and sodicity (ESP>6%) were more common than primary salinity (EC>400 mS m−1) in South Africa. None of the soil groups were saline, only the prismacutanic group was sodic, and the calcic, alluvial/ aeolian, neocutanic and prismacutanic groups were alkaline when the median value or highest value in a profile was used as indicator.
An ESP of 15% failed to differentiate the soil groups. The classical concept of a solonetz therefore did not apply to the prismacutanic group. A reason for this was that certain prismacutanic horizons developed where the ESP values were less than 15%, and in other circumstances soils with an ESP value of 15–20%, or even more, did not manifest prismacutanic morphological features. Sufficient data was not available, even for this relatively large data set of 648 prismacutanic horizons, to proclaim a precise ESP value as a criterion for prismacutanic or solonetz soils in South Africa.
The calcic and alluvial/aeolian soil groups were most affected by salts when the EC, ESP and pHwater were considered.
The information presented here should serve as an indicator for the background or natural sodicity and alkalinity of South African soils. As such it can be utilised to infer the expected sodicity and alkalinity of soils from soil survey data, to monitor the anthropogenic impact on sodicity and alkalinity, and as an input to map the primary sodicity and alkalinity of South African soils.
Acknowledgements
The endeavours of the ARC–Institute for Soil, Climate and Water staff in collecting and analysing the data as well as the assistance of Me Liesl van der Westhuizen in the preparation of this manuscript are gratefully acknowledged.
References
- Beckman RJ, Cook RD. 1983. Outliers. Technometrics 25: 119–149.
- Brady NC. 1990. The nature and properties of soils (10th edn). New York: Macmillan Publishing Company.
- Bresler E. 1981. Transport of salts in soils and subsoils. AgriculturalWater Management 4: 35–62.
- Chief Director of Surveys and Mapping. 1993. South Africa 1:50 000 sheets. Mowbray: Chief Director of Surveys and Mapping.
- Ellis F, van Laar A. 1999. Nutrient levels of three Eucalyptus species/provenances, measured over four seasons in a trial along the sandy, dry, Cape West Coast of South Africa. Southern African Forestry Journal 184: 33–40.
- Emerson WW, Bakker AC. 1973. The comparative effects of exchangeable calcium, magnesium, and sodium on some physical properties of red-brown earth subsoils. 1. The spontaneous dispersion of aggregates in water. Australian Journal of Soil Research 11: 151–157.
- Fey M. 2010. Soils of South Africa. Cambridge: Cambridge University Press.
- FAO (Food and Agriculture Organization of the United Nations). 2001. Origin, classification and distribution of salt-affected soils. Rome: FAO. Available at http://www.faop.org/docrep/x587e/x587e03.htm [accessed 6 February 2001].
- Macvicar CN. 1972. Legend for the sketch map giving a tentative appreciation of the occurrence of salt-affected soils in South Africa. SIRI Report no. 768/139/72. Pretoria: Department of Agricultural Technical Services.
- MacVicar CN, Loxton RF, Lambrechts JJN, Le Roux J, de Villiers JM. 1977. Soil classification – a binomial system for South Africa. Pretoria: Department of Agricultural Technical Services.
- Nell JP. 1991. Besproeibaarheid van gestruktuurde gronde. University of the Free State, South Africa.
- Nell JP, Bennie ATP 1991. Structure as an index of the irrigability of soils. In: Green GC (ed.), Proceedings of the Southern African Irrigation Symposium. WRC Report no. TT 71/95. Pretoria: Water Research Commission. pp 92–97.
- Nell JP, Lea I. 2004. The effect of the Blesbokspruit wetland system and gold mine effluent water use on irrigated agriculture. Paper presented at the SANCID Congress, 17−19 November 2004, Fish River Sun, South Africa.
- Nell JP, van Huyssteen CW. 2014. Geology and groundwater regions to quantify primary salinity, sodicity and alkalinity in South African soils. South African Journal of Plant and Soil. DOI: 10.1080/02571862.2014.921940.
- Netterberg F. 1969. The geology and engineering properties of South African calcretes. PhD thesis, University of the Witwaters rand, South Africa.
- Non-Affiliated Soil Analysis Working Committee. 1990. Methods of soil analysis. Pretoria: Soil Science Society of South Africa.
- Soil Classification Working Group. 1991. Soil classification – a taxonomic system for South Africa. Pretoria: ARC–Institute for Soil, Climate and Water.
- Statgraphics. 2005. Statgraphics® Centurion XV User Manual. Warrenton: Statpoint Technologies.
- Szabolcs I. 1997. Salt buildup as a factor of soil degradation. In: Lal R, Blum WEH, Valentin C, Stewart BA (eds), Methods for assessment of soil degradation. Boca Raton: CRC Press. pp 253–264.
- United States Salinity Laboratory Staff. 1954. Diagnosis and improvement of saline and alkali soils. Agriculture Handbook no. 60. Washington, DC: US Government Printing Office.
- van der Merwe CR. 1940. Soil groups and subgroups of South Africa. Science Bulletin no. 231, Chemistry Series no. 165. Pretoria: Department of Agricultural Technical Services.
- van der Watt HvH, van Rooyen TH. 1995. A glossary of soil science (2nd edn). Pretoria: Soil Science Society of South Africa.
- Williams WT. 1976. Pattern analysis in agricultural science. Amsterdam: Elsevier Scientific Publishing Company.