
Abstract
Spatial variations of microclimatic conditions in enclosed north–south (N–S) oriented single-arched greenhouse polycarbonate structures, with a wet-wall providing evaporative cooling at the S end, were investigated and displayed online in near real-time. Temperature-controlled fans at the N end extracted air. Air temperature, wind speed and water vapour pressure were measured at many positions to investigate spatially changing conditions. Large N–S spatial variations in air temperature and relative humidity occurred away from the wet-wall and east–west (E–W) positions. Typically, on hot days, at positions furthest from the wet-wall, morning E–W air temperature differences exceeded 14 °C and −6 °C for afternoon. N–S spatial air temperature differences were usually smaller in magnitude. Furthest from the wet-wall, E–W relative humidity differences exceeded 20% in the morning and less than −10% in the afternoon. Heated-needle anemometer wind speed showed reasonable correspondence with three-dimensional sonic anemometer measurements. Needle anemometer wind speeds were greatest nearest the wet-wall, decreasing significantly towards the mid-position. With fans on intermittently, wind speed was lowest near the wet-wall, increasing at the mid-position. There were significant spatial air temperature differences, displayed in near real-time using a web-based system, and in other microclimatic parameters investigated resulting in a very complex and changing microclimate.
Introduction
Microclimate affects plant growth and development. Increasingly, more high-value crops are grown under protection where they could not otherwise be grown. For this purpose, polycarbonate greenhouses are low maintenance and provide microclimate alteration, crop protection with low cost, high solar radiative transmission, anti-aging by preventing ultraviolet degradation, ease of cleaning and frost protection (Savage Citation1980). Furthermore, greenhouses provide protection by reducing crop damage because of high rainfall, hail or strong winds, and together with night-time condensation on the inside structure they provide a thermal and spectroradiative microclimate conducive to an increased crop development rate. Space within, besides horizontal ground area used, can be used for elevated plants, thereby significantly increasing the potential yield for the structure per unit ground area.
Over the last two decades, many methods have been used to modify greenhouse microenvironments (Castilla Citation2013). These include natural ventilation, increasing/ decreasing air temperature compared to outside, heaters, fans or air-channelling methods to extract hot air or increase ventilation to provide carbon dioxide, shading or painting to decrease solar irradiance, artificial lighting of various types to extend the photoperiod or to provide a particular spectroradiative microclimate, and thermal screens to alter shortwave/infrared exchange between inside and outside the greenhouse. In addition, wet-walls and fans are used for evaporative cooling with cooled air drawn through the wet-wall. Ventilation, with evaporative cooling, is a recognised method of reducing high air temperature.
In reviewing greenhouse air temperature distributions, and using geophysical methods for their analysis, Bojacá et al. (Citation2009) maintain that spatial heterogeneity is inherent to the biological and physical aspects of agricultural systems and, as a result, patchiness in the microclimate is common. They also stated that temperature variations inside greenhouses may affect processes such as plant growth and the distribution of pests. Using large climate-controlled greenhouses equipped with computercontrolled conveyor belts carrying up to 600 plants per room, Brien et al. (Citation2013) concluded that accounting for the variation in microclimate in a greenhouse is improved using statistical design and analysis rather than rearranging the position of plants during the experiment. However, in many cases, due to financial constraints, greenhouses are not climate-controlled or are only partly so, resulting in microclimate spatial heterogeneity. Bartzanas and Kittas (Citation2005) discuss the main disadvantage of fan and wet-wall systems, attributing microclimate spatial heterogeneity to increasing air temperatures and decreasing relative humidity along the length of the structure and in the airflow direction.
Applied to greenhouses, near real-time access to measurements and data in critical systems could allow timely and convenient decision-making, based on research results, by independent users or groups of users in communication with each other (Savage Citation2014, Savage et al. Citation2014). Potentially, visualisation of near real-time greenhouse microclimate measurements online or via cell phone, and the sharing of automatically processed data and information are very useful features of such communication systems. Such systems could also allow automatic early-warning of predefined spatial measurement comparisons or of hazardous greenhouse microclimatic conditions.
From a research perspective, particularly for simulating the outside environment or for simulating a defined microclimate, applying different plant/soil/disease treatments assuming a common microclimate and investigating plant responses or repeat experimentation, greenhouse micro-environments employing fans and wet-walls are fraught with complications. They cannot represent natural soil and atmospheric environments due to air movement restrictions or alteration and spectroradiative microclimate alteration. Furthermore, spatial/temporal changes in microclimate are often not obvious and should not be underestimated. They may make impossible, or confound, biometrically sound experiments. Microclimate variations often exist in glass/greenhouses and interventions are required to manage the variations to reduce their impact on treatment effects.
Spatial microclimatic variations inside a number of greenhouse polycarbonate structures, in a subtropical climate, with a wet-wall and fans for ventilation were investigated. The focus was on the spatially varying microclimate inside polycarbonate greenhouses. Reports of this nature are rare. Savage and Smith (Citation1980) investigated the spatial variation of pot temperature in an east–west (E–W) oriented plastic-covered greenhouse and alluded to the spatially varying microclimate. Kittas et al. (Citation2001) reported on air temperature and humidity in an evaporatively cooled greenhouse but not on high frequency spatial/temporal measurements. The influence of fans on environmental conditions in greenhouses was investigated by Fernandez and Bailey (Citation1994), who found that fan ventilation reduced spatial variations in the microclimate. The lack of experimental data in such environments in addition to the complex and changing microclimate results in a poor understanding of the air motion when considering numerical simulation (Boulard et al. Citation1999).
From experience in working in such environments, spatial variations in air temperature, wind speed and water vapour pressure were evident when microclimate control measures such as fans and wet-walls were activated. Since plants respond to this variation, the aim was to investigate the extent of spatial variations of the micrometeorological conditions in greenhouse polycarbonate structures. A secondary aim was to use an online data and information system, as an aid for research, illustrating measurement comparisons or measurement methods in near real-time, that also allows open data access to greenhouse users.
Materials and methods
Microclimate measurements, over many years, were obtained for specific experiments in Pietermaritzburg, South Africa (29.628° S 30.403° E, 671.3 m altitude near the Rabie Saunders Building, University of KwaZulu-Natal Pietermaritzburg campus) in different polycarbonate environments (). Measurements from selected experiments are reported here. Long-term average annual rainfall total for Pietermaritzburg is 839 mm with relatively mild rainless winters, an average of 13 frost days per annum, mean daily maximum air temperatures for October–March of 25.1, 25.7, 26.7, 27.1, 27.3 and 26.4 °C, respectively, and mean daily minimum air temperatures for April–September of 13.3, 9.4, 5.8, 6.0, 8.6 and 11.0 °C, respectively.
Table 1 Details of the equipment used
Some experiments necessitated independent air temperature and relative humidity (RH) sensors (, covering the period 1996 to 2013) for various locations within the greenhouse. In others, a central datalogging system was used with measurements recorded, particularly air temperature and wind speed, at many different locations within the structure.
Polycarbonate tunnel
The physical dimensions of commercially available single arch-frame greenhouse polycarbonate structures used were 8 m × 25 m, oriented north–south (N–S) on the long edge. The porous wet-wall, at the S end, consisted of a vertical concrete-impregnated cardboard and extended the entire width of the greenhouse. Holes in the wet-wall allowed outside air to pass through, becoming saturated when two large fans were switched on. Due to competing user demands, different units were used for the various experiments (). Since it is not possible to present measurements for every experiment, with measurements conducted over more than 15 years, details from selected and various experiments are presented. Data periods depicting typical data representative of the spatial variation were chosen. Air temperature inside was controlled by an electromagnetic controller and timer and the two large fans. A tubefan in the roof section was used to circulate air up to 22.5 °C. Between 20 and 24 °C, a small fan was automatically switched on to introduce outside air and carbon dioxide. At 29 °C, one of the large fans at the N end was programmed to come on and the small fan was switched off. After a 15 s time lag in summer and 300 s in winter, the second large fan turned on. At 29.5 °C, a pump was activated to wet the wet-wall. At 31.5 °C, a thermal screen, acting as a shade in this case, was programmed to cover the outside of the structure. This movement was set at a 2.5 °C differential, and applied to the other limits, so that the thermal screen would be retracted if air temperature decreased below 29 °C.
In a more recent experiment in greenhouse U, the spatial (and temporal) microclimate conditions and data were made available to users including managers and students, via a web-based research, teaching and learning system (http://agromet.ukzn.ac.za:5355/?command=RTMC&screen=Greenhouse%20tunnel%20U, for example) (Savage Citation2014, Savage et al. Citation2014). Near real-time visualisation of the spatial variation in the microclimatic conditions was possible via the internet or cell phone. The open system also allowed downloads of the most current and previous daily, hourly or subhourly microclimatic data for one or more greenhouse environments.
Plant details
In some experiments, Clonal ‘Solo’ papaya plants occupied the northern half of greenhouse unit 4 (), with other shorter plants at the S (wet-wall) end. In other experiments, Eucalyptus stock plants grown for vegetative propagation purposes, occupied most of the greenhouse (Gilbert et al. Citation2013). In greenhouse unit U, maize was grown for breeding purposes and in some years many different types of plants were exposed to pulsed wetting for disease experimentation, based on the measured air temperature, using overhead misters.
Air temperature
In some experiments, Hobo data recorders for standalone air temperature measurements or thermocouples attached to a central datalogger were used (, greenhouse 4). All temperature sensors, including the thermocouples placed in Gill radiation shields, were calibrated against a mercury thermometer in a water bath in a laboratory prior to use. No adjustments to temperature were necessary. Hobo temperature time response was reduced from about 15 to 1 min by removing the internal thermistor from its case. Hobo and thermocouple temperatures compared favourably when placed in a Stevenson screen inside the greenhouse (slope = 0.977, intercept = -0.23 °C, root mean square error (RMSE) = 0.64 °C, n = 812).
The temperature sensors were not aspirated due to equipment lack and power limitations. A separate study, five weeks in duration, in a confined environment quantified air temperature differences between an aspirated radiation shield and two six-plate radiation-shielded units. At air temperatures of 4 °C, the aspirated radiation-shielded unit agreed well with air temperature measured in six-plate Gill radiation shields with their differences decreasing linearly to -0.98 °C at 30 °C. This linear difference allowed a simple correction to be applied. A multiple linear regression model was applied using aspirated radiation-shielded air temperature (independent variable), six-plate air temperature (dependent variable 1), solar irradiance (dependent variable 2) and wind speed (dependent variable 3). The multiple linear regression model, which allowed correction for wind speed and solar irradiance influences, showed only marginal improvement over the simple correction (slope = 1.005, intercept = -0.064 oC, R2 = 0.9993, RMSE = 0.15 °C, maximum difference of 0.81 °C and a minimum difference of 0.58 °C). The simple correction was therefore applied to the six-plate air temperature measurements, which compared favourably with aspirated radiationshielded air temperatures.
Hobo temperature recorders were installed at the N, middle and S (wet-wall) positions. On the N side, a Hobo was positioned at the E, middle and W of the greenhouse. Similarly, three units were positioned at the middle and S ends.
Wind speed
In confined environments, wind speed measurement presents a difficulty due to the often low wind speed experienced. A three-dimensional UVW propeller anemometer and 11 heated-needle anemometers, and a three-dimensional sonic anemometer for comparison purposes, were used in greenhouse U (, maizebreeding experiment). Needle anemometers allowed for many measurements, and at low wind speeds, at different distances away from the wet-wall towards the mid-position.
Needle anemometers consisted of a heater element and a thermocouple (Bland et al. Citation1995). Needles, under datalogger control, were heated 50% of the time and the steady-state temperature measured. The temperature difference (dT) before and after heating or cooling at steady state, from which wind speed was calculated, was measured every 30 s. For wind speeds greater than 2.18 m s−1, corresponding to dT = 4.4 °C, a 5 s heating/ cooling time was used and otherwise a 12.8 s time. The wind speed (U; m s−1) was calculated as:
U = (7/dT - 0.13)2
Field calibrations of needle anemometer wind speed against that from the colocated three-dimensional sonic anemometer showed that needles could measure wind speeds as low as 0.1 m s−1 (slope = 1.0681, intercept = 0.079 m s−1, R2 = 0.896, RMSE = 0.268 m s−1, n = 222).
Water vapour pressure
Relative humidity () was sampled and converted to water vapour pressure using RH and air temperature. Apart from thermocouple air temperatures, humidity measurements were at the same location as the air temperature measurements.
Results
In order to quantify the greenhouse microclimate, the spatial variation in air temperature, wind speed, water vapour pressure and RH is reported on. Instrumentation details are discussed in . No spatial variation in solar irradiance (Guertal and Elkins Citation1996) were detected that was not consistent with variations in solar irradiance outside.
Air temperature
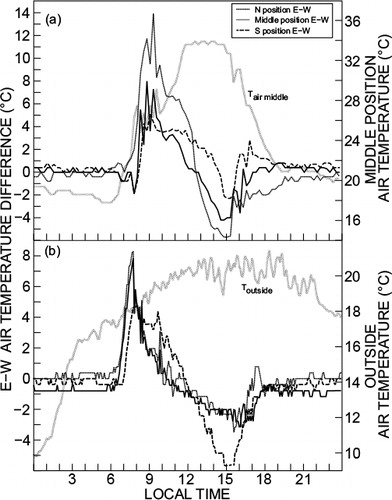
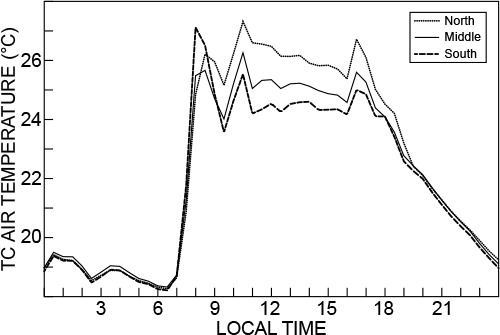
Hobos were used to measure air temperature at various positions inside greenhouse 4 (north-east [NE], N middle, north-west [NW], south-east [SE], S middle and southwest [SW] positions, and positions middle-east [ME] and middle-west [MW]). The diurnal variation in air temperature on cloudless hot days was similar in shape for the different measurement positions inside the greenhouse. On such hot days there were, however, considerable spatial differences in air temperature. At the N position, the air temperature differences between the east and west positions (denoted E–W) typically exceeded 14 °C in the morning and were less than 6 °C in the afternoon (). In the morning, with the sun on the east side of the structure before noon, higher air temperatures occurred on the east side with cooler conditions on the west and vice versa for the afternoon with the sun on the west side. The E–W air temperature differences for middle and S positions were less than those at the N position, again due to solar position movement. This is illustrated in for which the E–W air temperature differences peaked at 14, 6 and 4 °C for the N, middle and S positions, respectively, compared to no more than 2 °C for the N to middle and middle to S positions in . On cooler days (), typical E–W air temperature differences were slightly reduced but still excessive for N and middle positions (nearly 9 °C) in the morning with S-position E–W differences close to 6 °C in the afternoon.
Large spatial differences in daytime air temperatures and other micrometeorological measurements would affect many plant physiological responses, transpiration and thermal time phenological responses such as flowering and maturity in particular. Clearly, however, plants at different positions were not exposed to the same microclimatic conditions, confounding biometrical trials in such environments in the absence of regular repositioning of plants.
Wind speed
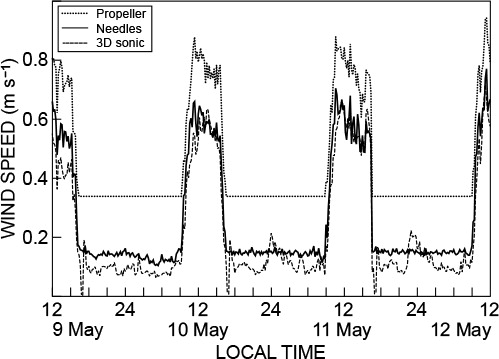
Most ventilation studies in greenhouses have used tracer or modelling techniques based on few measurements (Boulard et al. Citation2000). Automatic weather station wind speed sensors cannot be used in greenhouses to study ventilation or collect data for estimating evaporation rates. For example, Takakura et al. (Citation2009) used a sensor with a threshold of 0.5 m s−1 – this sensor would be unsuited to the current study. For greenhouse studies, relatively inexpensive heated-needle anemometers or very expensive sonic anemometers could be used. Comparisons between needle anemometer and three-dimensional sonic anemometer measurements are reasonable (). However, the propeller anemometer consistently overestimated by about 25% and has a relatively high threshold ().
Diurnal wind speed with distance from the wet-wall, with fans on, showed the greatest wind speed at the wet-wall. This decreased to about half, 12 m away, at the greenhouse U mid-position (, upper set). When fans were on intermittently, greatest wind speeds were nearest the mid-position, decreasing towards the wet-wall. These spatially different wind speeds would cause differing plant responses at different tunnel positions (Grace Citation1977). Furthermore, the model of Fuchs et al. (Citation2006), for example, for estimating transpiration in roses in ventilated greenhouses presents difficulties in accounting for spatially variable wind speed based on single-position measurements.
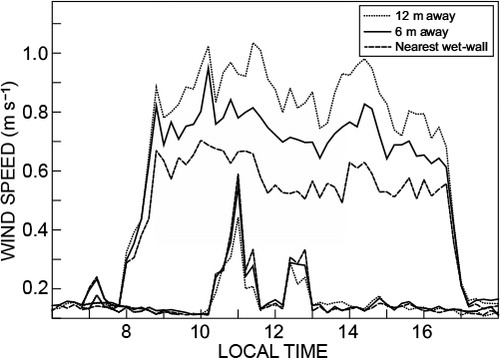
Once fans are on and remain on, measured wind speed remains relatively constant, in excess of 1 m s−1 near the wet-wall, but decreasing to less than 0.51 m s−1 at the greenhouse mid-position. Models for estimating water use of greenhouse plants require wind speed as an input and would therefore need to account for the spatial variation in wind speed (Boulard et al. Citation2000; Fuchs et al. Citation2006).
Using five days of 12 min needle anemometer data, wind speed U (m s−1) at distance z (m) away from the wet-wall was modelled based on wind speed near the wet-wall Uo (m s−1):
U = 0.7407Uo + 0.00895z
This relationship underestimated measured wind speed at 6 m (slope = 0.879, intercept = 0.000 m s−1, R2 = 0.963, n = 13) and overestimated it at the greenhouse mid-position (slope = 1.139, intercept = 0.037 m s−1, R2 = 0.957, n = 13), allowing a reasonable estimate of wind speed throughout the greenhouse based on a single wind speed Uo at the wet-wall.
Relative humidity and water vapour pressure
The inside and outside RH for a typical spring day are shown (, greenhouse 4). The E–W differences in RH were large. In the morning, as the sun heated the system, mostly the east side of the greenhouse, the air temperature increased significantly. This caused a large decrease in RH – typically from 85% at 06:00 to less than 30% at 11:00 () in the absence of wet-wall cooling. The spatial differences in air temperature, already demonstrated, impact directly on the calculated water vapour pressure differences through the saturation water vapour pressure used together with the RH to calculate water vapour pressure. Because of the air temperature and RH spatial differences, there were considerable spatial differences in daytime water vapour pressure – generally greatest in magnitude for the E–W positions (). Since stomata respond dynamically to humidity (Lange et al. Citation1971), plants at different positions would have different transpirational behaviour. Furthermore, given the significant E–W differences at the middle position (ME–MW) and N–S relative humidity differences (), care is needed to regularly reposition plants. The repositioning may avoid, for example, disease incidence under continually high RH conditions near the wet-wall.
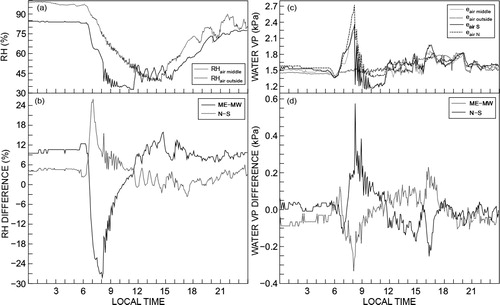
Water vapour pressure outside the greenhouse was relatively constant compared to that inside at the mid-position (). The water vapour pressure at the N and S positions of the greenhouse 4 showed large differences (), that are also depicted in .
Discussion
It is clear that wet-wall evaporation reduced the inside air temperatures, particularly at positions closest to the wet-wall but its impact decreased significantly at the middle and N positions of the greenhouse. However, Monteith (Citation1981) was sceptical of a wet-wall for reducing canopy temperatures since, as he put it, a decrease of the air temperature by evaporative cooling must always be accompanied by an increase in wet bulb, a reduction in the transpiration rate and therefore an increase in the excess of foliage temperature over the temperature of the surrounding area. Monteith (Citation1981) did not have any data to prove this, although there has been a computer analysis of air temperature in a glasshouse presented by Landsberg et al. (Citation1979). The analysis showed a decrease between 8 to 12 °C due to evaporative cooling even for high solar irradiance.
Large spatial differences in air temperature, such as the more than 14 °C E–W differences at the N position (), have been demonstrated. These differences could result in differential plant physiological responses, for example flowering, on the N–S axis. For example, male papaya flowers tend to be produced when it is warmer and bisexual flowers when cooler (P Allan, pers. comm., 1997). In addition, breeding studies conducted may be difficult to analyse or repeat given the spatial microclimatic variations shown.
Given the extent of spatial differences in air temperature, wind speed and humidity within greenhouses such as used in this investigation, the estimation of evaporation using an energy balance approach such as the Penman– Monteith method (Monteith and Unsworth Citation1990) or any air temperature-based method would be in error if based on micrometeorological measurements at one location. A modelling approach for transpiration and environmental conditions (Boulard et al. Citation2000, Fuchs et al. Citation2006), would have to include submodels to account for spatial variation in air temperature and humidity, given that it may be possible to model wind speed based on measurements at one location.
While the typical measurements presented were based on N–S oriented greenhouses, such spatial variations could also occur in E–W units. Diurnal solar-beam position movement and the cooling influence of a wet-wall and fans provides for a very complex and dynamically changing system that also requires the short-term temporal variations in the microclimate to be accounted for.
The web-based near real-time data and information system implemented provided greenhouse users, including the greenhouse manager and students, the capability of monitoring spatially varying conditions online. It was therefore possible to apply adjustments to equipment, and/or to reposition plants used for experimental purposes, to compare conditions in different neighbouring greenhouse structures and to download recent or previous micrometeorological data at various temporal scales.
Conclusions
Wet-walls and fans, often used in enclosed greenhouses in subtropical climates to extract hot air, provide a source for carbon dioxide and provide evaporative cooling. Microclimate measures in the enclosed greenhouses used showed significant spatial variations in air temperature and humidity in the E–W direction and between the N, S and middle positions. Spatial variation in air temperature, humidity and wind speed occurred in the N–S direction. These variations may make difficult experiment repetition and make difficult the estimation of transpiration based on micrometeorological measurements at a single position. Models for accounting for and controlling the microclimate in enclosed greenhouses with wet-walls and fans should include descriptions for spatial variations in air temperature, humidity and wind speed to reduce their potential impact on the results of biometric experiments. A web-based system allowed near real-time decisions, based on the display of the spatially varying microclimate, to be made with respect to adjustments to equipment, control settings and/or pot location, data downloads and simultaneous comparisons of the microclimate of different greenhouses.
Acknowledgements
Support by the South African National Research Foundation and the University of KwaZulu-Natal is gratefully acknowledged. The UKZN Teaching and Learning Office is acknowledged for funding the infrastructural equipment costs of the online web-based research, teaching and learning agro-environmental data and information system. The valuable assistance of Professor Pete Allan, administrative and technical support of Jothi Manickum, support from Phytotron users for use of facilities, assistance from many undergraduate and postgraduate students over the years, and an equipment donation (CR7X) from Campbell Scientific, Inc. is acknowledged.
References
- Bartzanas T, Kittas C. 2005. Heat and mass transfer in a large evaporative cooled greenhouse equipped with a progressive shading. Acta Horticulturae 691: 625–632.
- Bland WL, Norman JM, Campbell GS, Calissendorff C, Miller EE. 1995. A transiently heated needle anemometer. Agricultural and Forest Meteorology 74: 227–235.
- Bojacá CR, Gil R, Gómez S, Cooman A, Schrevens E. 2009. Analysis of greenhouse air temperature distribution using geostatistical methods. Transactions of the American Society of Agricultural and Biological Engineers 52: 957–968.
- Boulard T, Haxaire R, Lamrani MA, Roy JC, Jaffrin A. 1999. Characterization and modelling of the air fluxes induced by natural ventilation in a greenhouse. Journal of Agricultural and Engineering Research 74: 135–144.
- Boulard T, Wang S, Haxaire R. 2000. Mean and turbulent air flows and microclimatic patterns in an empty greenhouse tunnel. Agricultural and Forest Meteorology 100: 169–181.
- Boulard T, Wang S, Haxaire R, Kittas C, Papadakis G, Mermier M. 1997. Air flow, temperature and humidity patterns in a greenhouse tunnel. Acta Horticulturae 507: 51–59.
- Brien CJ, Berger B, Rabie H, Tester M. 2013. Accounting for variation in designing greenhouse experiments with special reference to greenhouses containing plants on conveyor systems. Plant Methods 9: 5.
- Castilla N. 2013. Greenhouse technology and management (2nd edn). Wallingford: CAB International.
- Fernandez JE, Bailey BJ. 1994. The influence of fans on environmental conditions in greenhouses. Journal of Agricultural Engineering Research 58: 201–210.
- Fuchs M, Dayan E, Presnov E. 2006. Evaporative cooling of a ventilated greenhouse rose crop. Agricultural and Forest Meteorology 138: 203–215.
- Gilbert DL, Bertling I, Savage MJ. 2013. Radiation transmission through coloured shade netting and plastics and its effect on Eucalyptus grandis × E. nitens hybrid mini-hedge shoot internode length, stem diameter and leaf area. Acta Horticulturae 1007: 773–780.
- Grace J. 1977. Plant response to wind, London: Academic Press.
- Guertal EA, Elkins CB. 1996. Spatial variability of photosynthetically active radiation in a greenhouse. Journal of the American Society for Horticultural Science 121: 321–325.
- Kittas C, Bartzanas T, Jaffrin A. 2001. Greenhouse evaporative cooling: measurement and data analysis. Transactions of the American Society of Agricultural Engineering 44: 683–689.
- Landsberg JJ, White B, Thorpe MR. 1979. Computer analysis of the efficiency of evaporative cooling for glasshouses in a high energy environments. Journal of Agricultural and Engineering Research 24: 29–39.
- Lange OL, Lösche R, Schulze ED, Kappen L. 1971. Responses of stomata to changes in humidity. Planta 100: 76–86.
- Monteith JL. 1981. Evaporation and surface temperature. Quarterly Journal of the Royal Meteorological Society 107: 1–27.
- Monteith JL, Unsworth MH. 1990. Principles of environmental physics (2nd edn). London: Edward Arnold.
- Savage MJ. 1980. Plastic tunnels: a study of air temperature. Agrochemophysica 12: 5–13.
- Savage MJ 2014. Web-based teaching, learning and research using real-time data from field-based agrometeorological measurement systems. MScAgric thesis, University of KwaZuluNatal, South Africa.
- Savage MJ, Abraha MG, Moyo NC, Babikir ESN. 2014. Web-based teaching, learning and research using accessible real-time data obtained from field-based agrometeorological measurement systems. South African Journal of Plant and Soil 31: 13–23.
- Savage MJ, Smith IE. 1980. Pot temperature as a factor in plastic tunnel crop production. Agrochemophysica 12: 53–57.
- Takakura T, Kubota C, Sase S, Hayashi M, Ishii M, Takayama K, Nishina H, Kurata K, Giacomelli GA. 2009. Measurement of evapotranspiration rate in a single-span greenhouse using the energy-balance equation. Biosystems Engineering 102: 298–304.