
Abstract
Crop models are useful tools for simulating impacts of climate and agricultural practices on crops. Models have to demonstrate the ability to simulate actual crop growth response in particular environments before application. Data limitations in southern Africa frequently hinder adequate assessment of crop models before application. The DSSAT model was used to test the usefulness of crop models under data-limited dryland conditions of southern Africa by validation using data from experimental trial reports and district-wide crop yield estimates. Two crops each were selected in three locations to represent varying cropping and physical conditions in southern Africa, i.e. maize and sorghum (Mohale's Hoek, Lesotho and Big Bend, Swaziland) and maize and groundnut (Lilongwe, Malawi). DSSAT performs well in simulating crop yields obtained from experimental trials. District-wide simulated mean crop yields were acceptable (relative difference ranged from −12.2% to +2.36%). However, the model's capture of seasonal yield variation for some locations and crops was uncertain due to climate extremes. It was concluded that satisfactory crop model testing before application is possible and that DSSAT crop models are useful even under data-limited conditions.
Introduction
Crop growth simulation models are valuable tools for assessing the impacts of climate and agronomic management on crop production. A lot of research has been done using crop models to assess impacts of climate on crops in southern Africa (Zinyengere et al. Citation2013). However, most studies obtain confidence to apply crop models from generalised validation procedures, where the model is considered suitable because it has been applied successfully in similar environments (Phillips et al. Citation1998; Knox et al. Citation2010; Thornton et al. Citation2011; Zinyengere et al. Citation2011) or through point-based validations obtained from experimental trials (Chipanshi et al. Citation2003). Generalised validations do not account for common variation in modelled climatic, soil and management conditions in space (Gaiser et al. Citation2010). While experimental trials provide location-specific validations, experiments are commonly done under well-managed settings uncharacteristic of dryland conditions under which most smallholder farmers in southern Africa operate. In southern Africa, crop production is predominantly practiced under dryland conditions, mostly by smallholder farmers (Twomlow et al. Citation2008). Farmers operate under suboptimal conditions that range from heavily weathered and infertile soils, erratic and unreliable rainfall, poor water management, poor fertiliser use and untimely sowing (Whitbread et al. Citation2010). In most instances, these conditions differ from those under which most crop models have been developed and tested. It is therefore essential that crop models are tested under these particular conditions to capture location specificity and variation in the region.
A persistent challenge to adequately testing crop models for use in impact studies under varied conditions that most dryland farmers operate in southern Africa is data limitations. Data are seldom available in the quantity and quality that is easily adaptable to drive crop models. This is partly why crop models have occasionally been applied with inadequate validation. In cases where resources and time have permitted, experimental trials have been performed validating crop models in different locations in southern Africa (Dutoit et al. Citation1997; Dimes Citation2002; Kamanga Citation2002; Singels et al. Citation2010; Mabhaudhi et al. Citation2013). Some studies have gone a step further by engaging smallholder farmers to model actual on-farm conditions and yields (Thornton et al. Citation1995; Ncube et al. Citation2006). These experiments are invaluable for modelling dryland systems in the region but are uncommon. Researchers do not usually have access to similar resources and data. Still, model performance assessment remains vital despite the data constraints.
The main objective of this study was to test the potential of crop models to simulate crop yields under a range of biophysical conditions found in data-limited drylands of southern Africa. In the process, the study sought to highlight the challenges and opportunities in carrying out crop model set up and assessing usefulness under data-limited conditions common in the region. It was hypothesised that despite data challenges, satisfactory assessments of crop models can be performed in the region before application in impact studies. The Decision Support System for Agrotechnology Transfer (DSSAT) crop model was selected for this study and tested for usefulness as a sample crop model because it is the most widely used for impact studies globally (White et al. Citation2011). It was tested for simulating crop yields under dryland conditions in three locations in southern Africa, i.e. Mohale's Hoek in Lesotho (maize and sorghum), Big Bend in Swaziland (maize and sorghum) and Lilongwe in Malawi (maize and groundnut). Southern Africa has highly diverse climatic and agroecological conditions. Although not fully captured, the study sampled these conditions through the selection of contrasting study sites. Selected sites ranged from a high-altitude location with a cool-temperate climate (Mohale's Hoek), a mid-altitude location with a mild climate (Lilongwe) and a low-altitude location with a hot and dry climate (Big Bend).
Study area
The study was carried out in one location each in three countries of southern Africa. Southern Africa is a predominantly semi-arid region with high rainfall variability. In general, the region is dominated by summer rainfall. In all the focal areas of this study, October to April represents the main rainy season, reaching a peak between December and February when about 80–90% rainfall is received. Agriculture, especially maize production plays a critical role in sustaining rural livelihoods and food security and is directly dependent on climatic variables such as temperature and rainfall (Porter and Semenov Citation2005). Crop yields vary with rainfall variability such that low rainfall usually results in low productivity (Twomlow et al. Citation2008). Agricultural productivity in dryland systems of southern Africa is also threatened by population pressure, declining soil fertility, poor technological inputs, weed invasion, decreasing farm size, disease, lack of or poor access to markets, etc. (Cooper et al. Citation2008). Three districts in southern Africa, i.e. Mohale's Hoek in Lesotho, Lilongwe in Malawi, and Big Bend in Swaziland, were used as case studies. Details of the physical characteristics of these districts are presented in .
Table 1: Physical characteristics of the study sites – mean annual temperatures and rainfall. In parenthesis are averages over the growing season (October–April)
Big Bend (26.85° S, 31.92° E; 138 m altitude) is located in the south-east of the Kingdom of Swaziland, a country with an area of 17 370 km2 and lying 100–1 800 m above sea level (asl) in south-eastern Africa. Swaziland is divided into four agroecological zones: the high veld, middle veld, low veld and Lubombo, experiencing average annual rainfall of 950, 700, 475 and 600 mm, respectively (Government of Swaziland Citation2000). Big Bend is located in the low veld, the driest part of the country, receiving highly variable rainfall averaging about 600 mm annually. Mean annual temperature is around 22 °C and summer temperatures regularly attain 35 °C resulting in high evapotranspiration. Maize is the most common crop in Swaziland. Ninety percent of the maize is grown by smallholder farmers under dryland conditions and yields are about 1.5–2 t ha−1 (Manyatsi et al. Citation2013). Other crops, such as sorghum, groundnuts, beans and cowpea, are grown on a small scale.
Mohale's Hoek (30.15° S, 27.47° E; 1 620 m altitude) is located in Lesotho, a small country of 30 000 km2, landlocked by South Africa with a harsh environment owing to highly variable terrain and climate. The altitude ranges from 1 400 to 3 500 m asl. Mean annual rainfall ranges from 450 mm in the lowlands to 1 100 mm in the highlands. The high altitude means that Lesotho experiences some of the lowest temperatures in southern Africa, with a significant proportion of the country experiencing mean annual temperatures below 10 °C (Gwimbi et al. Citation2013). Only about 15% of the country is arable. Maize is by far the dominant crop grown in Lesotho, accounting for 77% of the country's cereal production mainly through dryland smallholder subsistence farming and averaging yields of 0.72 t ha−1 (Mbata Citation2008). Other principal crops are sorghum and wheat, yielding respectively 0.74 and 0.68 t ha−1 on average (Mbata Citation2008). Eighty percent of the productive farming land is in the the lowlands, accounting for 17% of the total land area (Ministry of Natural Resources Citation2007), which is where Mohale's Hoek is located. Temperatures in the lowlands reach 32 °C in the summer and as low as −7 °C in the winter. Annual temperatures in Mohale's Hoek average 15.6 °C. Rainfall received during the agricultural season averages 500–700 mm (Masiatile Citation2011).
Lilongwe (13.78° S, 33.77° E; 1 229 m altitude) is located in central Malawi, a landlocked country located in the eastern part of southern Africa. Mean annual rainfall in Malawi ranges from 500 mm in the dry and hot rift valley areas where temperatures can reach 35 °C, to 2 500 mm over highlands where temperatures are moderate. Seventy percent of the country receives average rainfall of 750–1 000 mm annually. Ninety-five percent of Malawi's cultivable land is under dryland crop production (Saka et al. Citation2013). Lilongwe district is located in the mid-altitude region (1 000–1 500 m asl), a zone that experiences high annual average rainfall of 800–1 200 mm and moderate temperatures (Saka et al. Citation2013). The area in which the district is located produces about 40% of cereal grain in Malawi (Environmental Affairs Department Citation2005). Most crop production is practiced by smallholder rural farmers. Maize is the staple crop and produces on average 1.5–3 t ha−1 in yield under dryland conditions. Other major food crops include groundnuts and beans (Saka et al. Citation2013).
Materials and methods
The DSSAT model
The DSSAT family of crop models was used in this study as a sample crop model to illustrate needs, challenges and opportunities in simulating dryland farming systems under data limitations in southern Africa. Among a limited number of biophysical crop models, DSSAT was selected for its global use and proven performances in impact studies (White et al. Citation2011), as well as its regional repeated uses for climate impact studies in southern Africa (Chipanshi et al. Citation2003; Walker and Schulze Citation2006; Knox et al. Citation2010; Thornton et al. Citation2011). Furthermore, it takes into account a wide range of management practises, e.g. tillage, fertilisation, residue and organic matter application, and rotation, that are found in dryland systems of southern Africa and are known to be strong determinants of productivity (Cooper et al. Citation2008).
DSSAT is a simulation model for crops that describes daily phenological development and growth in response to environmental factors (soil, weather and management). The basis of DSSAT is a cropping system model designed in modules in which components are separated along scientific disciplines. These include climate, crop and soil modules. It requires daily weather values of maximum and minimum temperatures, precipitation and solar radiation. Soil information includes details of soil characteristics: drainage, runoff, evaporation and soil water-holding capacity, and rooting preference coefficients for multiple soil layers and initial soil water content (Jones et al. Citation2003). Crop characteristics are determined through crop- and cultivar-specific genetic coefficients. The DSSAT family of models has separate plant modules that simulate growth and yield for individual species, e.g. CERES (e.g. maize, sorghum, wheat and rice), SubStor (potato), CANEGRO (sugar cane) and CROPGRO (e.g. soybean, peanut and dry bean). DSSAT also has a management module that determines when field operations are performed by calling submodules. These operations can be specified by users and include planting, harvesting, applying inorganic fertiliser, tillage, irrigating and applying crop residue and organic material (Jones et al. Citation2003).
Input data
An assessment of a crop model's performance involves comparison of model outputs with real data and a determination of suitability for an intended purpose. This documents its accuracy for specific predictions in specified environments, with a consideration of possible errors in input variables or data. Minimum data for the purpose includes a complete record of the data required to run the model and field information on the aspects for which the model is being tested. In this study, this included a complete climate record, soil characteristics for the locations under study, a complete description of the crops being tested and management operations. While this information is usually available at experimental station level, experiments are rarely performed for crop model set up and therefore data on climate, soils, crops and management are often not continuous in time and may be qualitative when the crop model requires quantitative values. As such, data are not always easily adaptable to crop modelling. These challenges increase at scales beyond the experimental field. In this study, data were obtained through reports of on-site experiments, published literature (e.g. crop types, varieties and yields, agronomic management and soils), government records and international databases (soils) and national meteorological departments (climate). Where data were incomplete or scattered, expert judgement based on available information was often required to build appropriate data sets.
Climate
Although rainfall data are recorded frequently in the region, temperatures are often missing and solar radiation records hardly exist. In both cases, data are often riddled with gaps and inaccuracies, needing further processing. Furthermore, climate stations are sparse. For this study, meteorological stations located in each study district that had a consistent set of historical climate data were used to collect daily precipitation, and maximum and minimum temperature data. Daily solar radiation was estimated according to the minimum and maximum temperatures, Julian day, latitude, altitude and an empirical parameter by Allen et al. (Citation1998). Details of stations used for climate information are shown in . Climatic data were accessed and processed at the Climate System Analysis Group, University of Cape Town, through standing relationships with national meteorological services departments in Lesotho, Malawi and Swaziland.
Soil
In each location, a minimum description of the upper 30 cm of the soil profile with relevant physical and chemical parameters existed from various sources, e.g. government publications and local, regional and international soil databases. These soil data sources were used to find complete soil profiles within the DSSAT WISE database (Gijsman et al. Citation2007) that had similar physical and chemical characteristics. Two soil profiles were developed in each study district based on identified dominant soil types. A summary description of the two soils is shown in . Details of the soil characteristics, e.g. lower drained limit, upper drained limit and saturation, essential parameters required for running the model and based on generic parameters identified in the WISE database are shown in . Other soil parameters, including the soil albedo, a soil water drainage rate constant and runoff curve number, were also based on soil texture estimates in the WISE database.
Table 2: Soil class, seasons, and references to documents and reports used for DSSAT calibration and validation for the study sites. Validation was performed at the station and for the district
Table 3: Physical and chemical characteristics of selected soils and simulated estimate agronomic practices of smallholder farmers. BD = bulk density, OC = organic carbon, CL = clay content, SI = silt content, DLL = drainage lower limit, DUL = drainage upper limit, SAT = saturation
Crop varieties and management
Data on crops and management practices were obtained from reported experimental trials. These data included planting dates, planting densities, fertiliser application amounts and timing. Selected crop varieties were those reported in experimental trials as shown in . Detailed phenological and genotypic details of each crop variety were obtained from seed-house pamphlets. Apart from experimental trials, information on crop management practices of dryland farmers in study districts were obtained from grey literature and local expert agronomists. These are summarised in .
Calibration and validation
DSSAT (version 4.5) was calibrated to simulate maize at all study sites, sorghum in Mohale's Hoek and Big Bend, and groundnut in Lilongwe and then validated with data sets derived from reported experiments (). These experiments described a variety of assessments of the effect of different agroecological factors, such as nitrogen, season, weather, sowing dates and variety, on growth and yield of studied crops. Parameterisation of DSSAT was based on typical values obtained from literature, default values from the model user manual and local expert advice. Tingem et al. (Citation2009) suggested crop model set up can be performed using ‘loose’ parameterisation, with the understanding that if a crop model's performance can be satisfactory with limited parameterisation, then performance could be even better if more data were available. In each location, a minimum description of the upper 30 cm of the soil profile with relevant physical and chemical parameters existed from various sources, e.g. soil survey data, government publications and local, regional and international soil databases. Crop cultivar-specific parameters were achieved through tuning phenology and growth coefficients of each crop variety respectively through repeated iteration by minimising the differences between observed and simulated crop yields until a close match was obtained. Only one season was used for calibration at each research site due to a lack of observed trial data with sufficient detail for such a purpose. However, one season could be considered sufficient under such limitations. Effort was made to select a season with well-distributed rains and high nitrogen applications to simulate near-non-stress conditions. Initial soil water was estimated by running the model three months prior to planting. Crop varieties calibrated were identified from reported trials. The coefficients were adjusted from varieties already found in the DSSAT database to suit identified local cultivars that were not available in the database. Information on days to flowering and maturity was available for most of the cultivars and guided the selection of cultivars in the database. The established cultivar parameters are shown in and were applied for model validation. Overall, the parameterisation effort was restricted reflecting the data limitations typical of the region.
Table 4: Cultivar coefficient values after calibration. GDD = growing degree days, PTU = photo thermal units
For model validation, an independent data set from separate seasons listed in was used. A two-fold validation was performed, first based on reported station experimental trials. These were limited to two or three seasons based on availability of records (). Given that the reported experimental trials were carried out at agricultural research stations, usually well managed, which is uncommon in smallholder dryland systems, an assessment of the model for conditions more representative of the dryland systems was necessary. Therefore, a second validation was performed using district-wide crop yields, which were considered to represent yields obtainable under suboptimal conditions common in smallholder drylands. Management inputs reflected common smallholder farming practices in each district (). All other input data (climate, soils and agronomic practices) were used to represent conditions over the district. The validation was performed over several seasons to assess model performance in capturing seasonal mean crop yields and temporal yield variation in response to climate.
A caveat in using district-wide yields as a proxy for yields attainable by smallholder farmers in drylands is that farmers operate under varying conditions even in the same district. Therefore, reported district-wide yields average these vast conditions (e.g. climate, soils, crop varieties, time of sowing, planting densities and fertiliser application). It would be difficult to estimate the different conditions and practices of farmers over an entire district. Modelling over a large production area cannot take into account the level of detail found at the field or farm scale. A reasonable approach is needed to capture heterogeneity over the production environment. In this study, a range of conditions were simulated to sample soils and common dryland agronomic practices. Two soils, three planting dates (consisting of a one-month window ranging from early to late planting), three fertiliser amounts (split between basal at planting and top dressing 4–6 weeks after planting) and two planting densities were simulated per district and crop as summarised in . In total, 36 treatments were simulated per season and crop (12 for groundnuts). The average yield from all treatments represented simulated crop yields per season.
Yield bias correction
Generally, the simulated yields would be expected to be considerably different from averaged district yields. This results from bias and errors due to differences in the actual and estimated environmental (e.g. soils and climate) and management conditions (e.g. planting dates and fertiliser application). Site-specific constraints not specifically accounted for by the crop model (e.g. pests, diseases and weeds), and errors due to methods used by responsible agencies to arrive at the reported district yield value also contribute. The model-simulated yields would therefore need to be corrected for such bias and errors for each crop and district. The simulated yields at district level were corrected against the observed district yields for a more representative assessment of model performance. Ideally, a large series of district yield data and a detailed description of the variation in physical and management conditions over space and time would help to compute bias satisfactorily. In this study, bias was computed from the linear relationship between observed and simulated district yields over multiple seasons (). The slope with a zero intercept was used as the yield bias correction factor to adjust simulated mean yields for each location and crop. Given that the yield bias correction factor is an empirical adjustment based on the recorded yields, it would change under different cropping practices, scale and environmental conditions. The bias-adjusted district mean yields were used to assess crop model performance in simulating mean crop yields and yield variation using the relative percentage difference (RD%), the coefficient of variation (CV; Loague and Green Citation1991), root mean square error (RMSE) and index of agreement (d; Willmott et al. Citation1985).
Results and discussion
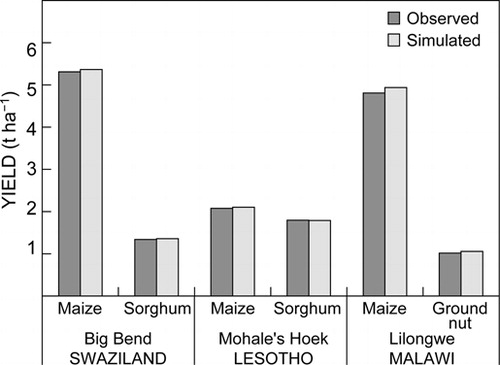
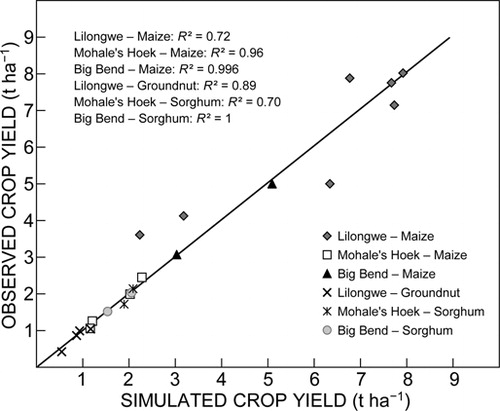
A common crop variety in each district ( and ) was calibrated by adjusting the phenological and growth coefficients of a selected variety from the DSSAT database respectively through repeated iterations until the difference between observed and simulated yields was minimised, as shown in . Established coefficients are shown in and were used in subsequent validations. The results presented in show the performance of DSSAT in simulating crop yields recorded from experimental trials held at a research station (no bias correction). The figure shows that DSSAT was able to simulate observed maize yields well for Lilongwe (R2 = 0.72), Mohale's Hoek (R2 = 0.96) and Big Bend (R2 = 0.996). DSSAT performance in simulating groundnut yields in Lilongwe (R2 = 0.89) and sorghum yields in Big Bend (R2 = 1) and Mohale's Hoek (R2= 0.70) was also satisfactory. However, the relationship between simulated and observed Mohale's Hoek sorghum yields was poor due to only two trial results including a 10% mean yield over estimation for the 1990/91 season.
A second validation where the crop model was tested for performance in simulating district yields as a proxy for yields attainable by smallholder farmers under dryland conditions was carried out. shows the initial simulations before yield bias correction and the bias correction factors determined thereafter. It shows that simulated mean crop yields were generally higher for maize and sorghum than the recorded district yields for each study site. Simulated yields ranged from 1.5 to 3.5 times more than the observed yields. Mohale's Hoek had the largest difference between simulated and observed yields, whereas Big Bend showed the least difference. Sorghum at Mohale's Hoek had the largest range of simulated yields. Simulated groundnut yields for Lilongwe were similar to observed yields. The model outputs were bias-corrected with district yields in order to translate the effect of factors not modelled (see section on yield bias correction).
Table 5: Observed and simulated district mean yields (kg ha−1) before bias correction (b). Ranges are shown in parentheses
shows results of DSSAT performance in simulating district-wide mean crop yields and yield variation over several farming seasons after bias correction. Model performance varied across study sites and crops. DSSAT estimated well the observed mean crop yields, estimating mean yields within −12.2% and +2.78% of observed yields across all locations. The model captured accurately the mean yield variation of maize (CV of 0.2) but not of groundnut in Lilongwe. The low RMSE shows the model was able to capture season-to-season yield changes well in Lilongwe. However, as shown by the weak index of agreement (0.38–0.41), the amplitude of change was not well captured. For Mohale's Hoek, mean sorghum yield variation for all seasons together was well captured, whereas less than one-quarter of the maize yield variation was accounted for. Conservative indices of agreement (0.5 and 0.63) for Mohale's Hoek and high RMSE (43%) indicated that the capture of season-to-season yield variation under extreme conditions was uncertain. Stronger indices of agreement for Big Bend (0.60 and 0.78) indicated a good capture of seasonal yield changes. Yield change amplitudes were well represented for maize (RMSE: 24%) and less so for sorghum (64%). The capture of yield variation in Big Bend varied with crop.
Table 6: Comparison of observed, simulated mean crop yields after bias adjustment for a number of seasons per study district. CV = coefficient of variation, RD = relative percentage difference, RMSE = root mean square error, d = index of agreement
This study sought to test the usefulness of a crop model under limited spatial and temporal data, as is common in drylands of southern Africa. Point validations were based on one or two sites in a district with only two or three years of trials. At the same time, validation at district scale was done over six to 14 cropping seasons with limited information on the spatial variation of climate, soils and management practices. Despite the data limitations, a satisfactory test of crop model usefulness for capturing crop yields in study locations was carried out. DSSAT was able to produce good estimates of mean crop yields as reported through location-specific experimental trials as well as district-wide yield estimates in all study locations. Relative percentage difference (RD%) between observed and simulated mean yields was within an acceptable range (). This gives an indication of the model's usefulness for studies that seek to apply the model for impact studies that focus on long-term responses of crops to climate.
DSSAT also demonstrated an ability to simulate season-to-season yield variation, albeit with varying degrees of accuracy, between locations and crops. Seasonal yield variation was captured particularly well for maize in Big Bend and Lilongwe and sorghum in Mohale's Hoek. Capture of yield deviation from average was less accurate for sorghum in Big Bend, maize in Mohale's Hoek and groundnut in Lilongwe. For Big Bend and Mohale's Hoek, this was caused by the model not fully capturing high and low yields caused by extreme weather during some seasons as demonstrated by the high RMSEs (RMSE is sensitive to large individual difference between observed and simulated yields, which therefore amplifies the effect of extremes). The RMSEs for Lilongwe were small, indicating that the simulations were less affected by extreme yields. Big Bend and Mohale's Hoek experience more extreme climates and are much more prone to extreme yield changes than Lilongwe, which commonly experiences a moderate climate. These results suggested that, while the model can perform well in capturing mean yields and long-term average impacts under a wide range of conditions with data limitations, it may not reproduce well yields obtained under extreme climatic conditions for some crops and locations. It is understandable that DSSAT does not capture well the amplitude of yield changes under extreme climate conditions in this particular case because required inputs were not sufficiently available and the model was set up using average yields. Using different approaches, Easterling et al. (Citation1996) tested the EPIC model and Carbone et al. (Citation2003) tested the CROPGRO model in DSSAT and similarly observed that over larger areas where a lot of estimations have to be made, models are less reliable under extreme weather, especially rainfall. More indepth investigation is required under shorter times, preferably with more detailed data, to fully assess model usefulness under extreme climates. The ability of crop models to represent yield changes under extreme climates is particularly of interest for dryland systems of southern Africa where farmers regularly operate under suboptimal conditions and are very prone to the vagaries of climate. More reliable estimations of season-to-season variation in low-input dryland systems are therefore necessary. Reliability can be improved through improvements in data. Detailed soil input parameters related to processes that constrain crop growth under very dry conditions or boost yields under wet conditions, e.g. water retention characteristics, organic matter and nitrogen turnover, will be required. Gaiser et al. (Citation2010), while validating the EPIC model in the drylands of western Africa, also found this to be true. A more detailed representation of smallholder agronomic practices, especially fertiliser application and sowing times, which are known to considerably affect crop yields in extreme climate conditions, will also help to improve model performance.
The over-estimation of yields shown in can partly be attributed to events unaccounted for by the model (e.g. hail), differences in actual and simulated environments (e.g. soils, climate, crop varieties and management practices) and errors in recorded district data. Other studies have also shown similar over-estimation from crop models, e.g. CROPGRO (Jagtap and Jones Citation2002) and EPIC (Brown and Rosenberg Citation1999), when estimating crop yields over a large area such as a district. This also points towards the need to gather more data regarding the variation of climate, soils, crop varieties and agronomic practices. Under smallholder dryland conditions in southern Africa, nutrient and water limitations are primary drivers of systems performance (Whitbread et al. Citation2010). Carrying out experimental trials and surveys to collect data relating to nutrient and water limitations together with variation of physical conditions and agronomic practices of smallholder drylands systems over time and space in the region would be invaluable for capturing these peculiar conditions and for better model initialisation and parameterisation to account for them. This can be supported through collaborations between the modelling community, local farmers and extension, and better data preservation and sharing.
The approach used in this study to represent dryland smallholder conditions where biophysical data limitations are common, i.e. bias-corrected district-averaged yields, is not without its caveats. However, it proved useful in assessing crop model performance and highlighting areas of further interest in setting up crop models, notably improvement of models for seasonal yield change estimation, particularly under extremes. Overall, barring limitations (e.g. extreme climate and effects of weeds, pests and diseases), DSSAT can be considered robust in diverse environments in southern Africa for simulating impacts of climate and agronomic practices on dryland crops in the region. The study showed that the model performed best for yields that were close to average where spatial and temporal data are in short supply.
Conclusion
The DSSAT crop model was used as a modelling sample for testing crop model usefulness for simulating crop yields in conditions common in southern Africa: dryland farming systems with data limitations. Acknowledging DSSAT model limitations under varied physical and management conditions in the region, the crop modelling capacity for suboptimal dryland conditions in southern Africa in response to climate and agronomic management was acceptable. Results suggested that under data limitations, crop models are more useful for investigating average crop yield responses over long periods, but may require deeper investigation regarding usefulness for simulating yield responses over shorter periods, especially in areas prone to extreme climates. This understanding is critical in smallholder dryland systems given their climate dependency. Further investigations into improving parameterisation to capture yields under extreme climates will be helpful for model applications. For better capture of site-specific crop responses and yield variation, more effort should be directed towards improved characterisation of soil variation, soil input parameterisation (e.g. initial soil water and nitrogen, and organic content) and the determination of relevant agronomic practices of farmers (fertilisation and planting). This study demonstrated that despite data limitations in southern Africa, where data requirements for model validation are not easily met, crop models can be satisfactorily tested and are still useful for impact studies, especially long-term impacts.
Acknowledgements
The authors acknowledge funding from the International Development Research Centre (IDRC) and the African Climate Change Fellowship Program (ACCFP). Many thanks to Dr Wezi Mhango and Mphangera Kamanga (Malawi), Prof. Absalom M Manyatsi and Gcina Katwane (Swaziland), Dr Bright Honu, Dr Paramiah and Mohau Seola (Lesotho) for assisting with data collection and sorting. Many thanks to the national meteorological departments in Malawi, Lesotho and Swaziland for providing climate data within the framework of the SECCAP project.
References
- ARD (Agricultural Research Division). 1991. Annual research report 1989/90. Mbabane: Ministry of Agriculture and Co-operatives, Swaziland.
- ARD. 1992. Annual research report 1990/91. Mbabane: Ministry of Agriculture and Co-operatives, Swaziland.
- ARTI (Agricultural Research Technical Information). 1986. Handbook: Cropping guidelines for Lesotho. Research division/Faming systems Research project. Maseru: Ministry of Agriculture and Marketing, Lesotho.
- ARTI. 1996. Handbook: A guide on sorghum production in Lesotho. Maseru: Agricultural Research Division, Agronomy section, Ministry of Agriculture, Lesotho.
- Allen RG, Pereira LS, Raes D, Smith M. 1998. Crop evapotranspiration: guidelines for computing crop water requirements. FAO Irrigation and drainage paper 56. Rome: Food and Agriculture Organization of the United Nations.
- Benson TD, Kumwenda JDT. 1998. Annual report for the 1996/97 season. Lilongwe: Maize commodity team, Ministry of Agricuture and Irrigation, Chitedze Agricutural Research Station.
- Brown RA, Rosenberg NA. 1999. Climate change impacts on the potential productivity of corn and winter wheat in their primary United States growing regions. Climatic Change41: 73–107.
- Carbone GJ, Mearn LO, Mavromatis T, Sadler EJ, Stooksbury D. 2003. Evaluating CROPGRO-Soybean performance for use in climate impact studies. Agronomy Journal95: 537–544.
- Carroll M, Bascomb CL. 1967. Notes on soils of Lesotho. Technical Bulletin no. 1. Tolworth: Ministry of Overseas Development, Land Resources Division, Directorate of Overseas Surveys.
- Chigowo MT, Saka AR. 2001. The effects of reduced tillage on soil chemical and physical characteristics on maize grain yields in Malawi. In: Phiri IMG, Saka A, Chilembwe EHC (eds), Agricultural technologies for sustainable development in Malawi. DARTS Annual Scientific Proceedings no. 1. Lilongwe: Department of Agricultural Research and Technical Services. pp 68–80.
- Chipanshi AC, Chanda R, Totolo O. 2003. Vulnerability assessment of the maize and sorghum crops to climate change in Botswana. Climatic Change61: 339–360.
- CRS (Chitedze Research Station). 2008. Chitedze Agricultural Research Station Guide. Lilongwe: Chitedze Agricultural Research Station.
- Cooper PJM, Dimes J, Rao KPC, Shapiro B, Shiferaw B, Twomlow S. 2008. Coping better with current climatic variability in the rain-fed farming systems of sub-Saharan Africa: an essential first step in adapting to future climate change. Agriculture, Ecosystems and Environment126: 24–35.
- Dimes J (ed.). 2002. Linking logics: farmer and researcher interactions on farm management and simulation modeling in smallholder farming systems. Bulawayo: International Crops Research Institute for the Semi-Arid Tropics, Matopos Research Station.
- Dutoit AS, Booysen J, Human JJ. 1997. Use of linear regression and correlation matrix in the evaluation of CERES3 (Maize). South African Journal of Plant and Soil14: 177–182.
- Easterling WE, Chen X, Hays C, Brandle JR, Zhang H. 1996. Improving the validation of model-simulated crop yield response to climate change: an application to the EPIC model. Climate Research6: 263–273.
- Ebenebe AA. 1998. Studies on stalk borers of maize and sorghum in Lesotho. PhD thesis, University of the Free State, South Africa.
- Environmental Affairs Department. 2005. National Adaptation Programmes of Action (NAPA). Zomba: Malawi Government Press.
- Gaiser T, de Barros I, Sereke F, Lange F. 2010. Validation and reliability of the EPIC model to simulate maize production in small-holder farming systems in tropical sub-humid West Africa and semi-arid Brazil. Agriculture, Ecosystems and Environment135: 318–327.
- Gijsman A, Thornton PK, Hoogenboom G, 2007. Using the WISE database to parameterize soil inputs for crop simulation models. Computers and Electronics in Agriculture56: 85–100.
- Government of Swaziland. 2000. First National Communication to the UNFCCC. Mbabane: Ministry of Works, Swaziland.
- Gwimbi P, Thomas TS, Hachigonta S, Sibanda LM. 2013. Lesotho. In: Hachigonta S, Nelson GC, Thomas TS, Sibanda LM (eds), Southern African agriculture and climate change: a comprehensive analysis. Washington, DC: International Food Policy Research Institute. pp 71–109.
- Hildebrand GL, Bock KR. 1990. Effect of timing of single applications of fungicide on groundnut yield. In: Hildebrand GL, Schmidt G, Singh L, Subrahmanyam P, Wightman JA, Abraham JJ (eds), Proceedings of the Fourth Regional Groundnut Workshop for Southern Africa, Arusha, Tanzania, 19–23 March 1990. Patancheru: International Crops Research Institute for the Semi-Arid Tropics. pp 3–7.
- Jagtap SS, Jones JW. 2002. Adaptation and evaluation of the CROPGRO-soybean model to predict regional yield and production. Agriculture, Ecosystems and Environment93: 73–85.
- Jones JW, Hoogenboom G, Porter CH, Boote KJ, Batchelor WD, Hunt LA, Wilkens PW, Singh U, Gijsman AJ, Ritchie JT. 2003. The DSSAT cropping system model. European Journal of Agronomy18: 235–265.
- Kamanga BCG. 2002. Farmer experimentation to assess the potential of legumes in maize-based cropping systems in Malawi. Risk Management Project Working Paper 02-02. Mexico, DF: CIMMYT.
- Knox JW, Rodríguez Díaz JA, Nixon DJ, Mkhwanazi M. 2010. A preliminary assessment of climate change impacts on sugarcane in Swaziland. Agricultural Systems103: 63–72.
- Loague K, Green RE. 1991. Statistical and graphical methods for evaluating solute transport models: overview and application. Journal of Contaminant Hydrology7: 51–73.
- Mabhaudhi T, Modi AT, Beletse YG. 2013. Parameterization and testing of AquaCrop for a South African bambara groundnut landrace. Agronomy Journal106: 243–251.
- Manyatsi AM, Thomas TS, Masarirambi MT, Hachigonta S, Sibanda LM. 2013. Swaziland. In: Hachigonta S, Nelson GC, Thomas TS, Sibanda LM (eds), Southern African agriculture and climate change: a comprehensive analysis. Washington, DC: International Food Policy Research Institute. pp 213–253.
- Masiatile MSM. 2011. Productivity of small-scale maize farmers in Lesotho. MSc thesis, University of the Free State, South Africa.
- Massey G, Pomela E, Malataliana T, Alosti P. 1992a. Five years of practical maize demonstration work in the loweld of Lesotho and foothills. Maseru: Agricultural research division, Ministry of Agriculture, Co-operatives and Marketing.
- Massey G, Pomela E, Moima S, Nkobole S, Moremoholo L, Ntlou N. 1991. Agronomic research report, 1988/89. Maseru: Agricultural research division, Ministry of Agriculture, Co-operatives and Marketing.
- Massey G, Pomela E, Ntlou N, Moremoholo L. 1992b. Manure and fertiliser applications to three crops in Lesotho 1987-1991. Maseru: Agricultural research division, Ministry of Agriculture, Co-operatives and Marketing.
- Mbata JN. 2008. Land use practices in Lesotho: implications for sustainability in agricultural production. Journal of Sustainable Agriculture18(2–3): 5–24.
- Ministry of Natural Resources. 2007. Lesotho's National Adaptation Programme of Action (NAPA) On Climate Change. Maseru: Ministry of Natural Resources.
- Mkhabela MS, Mkhabela MS, Sihkulu JP. 2001. Response of maize cultivars to different levels of nitrogen application in Swaziland during the 1994 cropping season. UNISWA Journal of Agriculture10: 12–21.
- Munthali JT, Chirembo AM. 1999. 1997/98 season report. Lilongwe: Agronomy Division, Ministry of Agricuture and Irrigation.
- Murdoch G. 1970. Soils and land capability in Swaziland. Mbabane: Ministry of Agriculture, Swaziland.
- Mwale CD, Kabambe VH, Sakala WD, Giller KE, Kauwa AA, Ligowe I, Kamalongo D. 2011. Model validation through long-term promising sustainable maize/pigeon pea residue management in Malawi. In: Bationo A, Waswa B, Okeyo JM, Maina F, Kihara J (eds), Innovations as key to the green revolution in Africa, vol. 1: Exploring the facts. Dordrecht: Springer. pp 325–333.
- Ncube B, Dimes JP, Twomlow S, Mupangwa W, Giller KE. 2006. Raising the productivity of smallholder farms under semi-arid conditions by use of small doses of manure and nitrogen: a case of participatory research. Nutrient Cycling in Agroecosystems77: 53–67.
- Phillips JG, Cane MA, Rosenzweig C. 1998. ENSO, seasonal rainfall patterns and simulated maize yield variability in Zimbabwe. Agricultural and Forest Meteorology90: 39–50.
- Porter JR, Semenov MA. 2005. Crop responses to climatic variation. Philosophical Transactions of the Royal Society B: Biological Sciences360: 2021–2035.
- Saka JDK, Sibale P, Thomas TS, Hachigonta S, Sibanda LM. 2013. Malawi. In: Hachigonta S, Nelson GC, Thomas TS, Sibanda LM (eds), Southern African agriculture and climate change: a comprehensive analysis. Washington, DC: International Food Policy Research Institute. pp 111–146.
- Singels A, Annandale JG, de Jager JM, Schulze RE, Inman-Banber NG, Durand W, van Rensburg LD, van Heerden PS, Crosby CT, Green GC, Steyn JM. 2010. Modelling crop growth and crop water relations in South Africa: past achievements and lessons for the future. South African Journal of Plant and Soil27: 49–65.
- Thornton PK, Jones PG, Ericksen PJ, Challinor AJ. 2011. Agriculture and food systems in sub-Saharan Africa in a 4 °C+ world. Philosophical Transactions of the Royal Society B: Biological Sciences369: 117–136.
- Thornton PK, Saka AR, Singh U, Kumwenda JTD, Brink JE, Dent JB. 1995. Application of a maize crop simulation model in the central region of Malawi. Experimental Agriculture31: 213–226.
- Tingem T, Rivington M, Bellocchi G, Colls J. 2009. Crop yield model validation for Cameroon. Theoretical and Applied Climatology96: 275–280.
- Twomlow S, Mugabe FT, Mwale M, Delve R, Nanja D, Carberry P, Howden M. 2008. Building adaptive capacity to cope with increasing vulnerability due to climatic change in Africa – a new approach. Physics and Chemistry of the Earth33: 780–787.
- Walker NJ, Schulze RE. 2006. An assessment of sustainable maize production under different management and climate scenarios for smallholder agro-ecosystems in KwaZulu-Natal, South Africa. Physics and Chemistry of the Earth31: 995–1002.
- Whitbread AM, Robertson MJ, Carberry PS, Dimes JP. 2010. How farming systems simulation can aid the development of more sustainable smallholder farming systems in southern Africa. European Journal of Agronomy32: 51–58.
- White JW, Hoogenboom G, Kimball B, Walla GW. 2011. Methodologies for simulating impacts of climate change on crop production. Field Crops Research124: 357–368.
- Willmott CJ, Ackleson SG, Davis RE, Feddema JJ, Klink KM, Legates DR, O'Donnell J, Rowe CM. 1985. Statistics for the evaluation of model performance. Journal of Geophysical Research: Oceans90: 8995–9005.
- Zinyengere N, Crespo O, Hachigonta S. 2013. Crop response to climate change in southern Africa: a comprehensive review. Global and Planetary Change111: 118–126.
- Zinyengere N, Mhizha T, Mashonjowa E, Chipindu B, Geerts S, Raes D. 2011. Using seasonal climate forecasts to improve maize production decision support in Zimbabwe. Agricultural and Forest Meteorology151: 1792–1799.