
Abstract
Student evaluations of teaching (SET) are an influential – and often sole – tool in higher education to determine course and teacher effectiveness. It is therefore problematic that SET results are disturbed by low response rates and response quality. An important factor discussed in prior research to increase SET effectiveness and students’ motivation to participate is transparency about how their feedback is being applied in practice. The current study is the first to empirically test effects of transparency in a quasi-experimental field setting. After students filled in the SET, the intervention group was given a summary of the students’ comments and how the teacher will use these to improve the course. We examined student participation on subsequent course evaluations. In contrast to our expectations, there was no significant improvement in response rates nor response quality between the intervention and control group. Furthermore, perceptions of meaningfulness did not significantly differ between the control and intervention group. This study indicates that more empirical research is needed to define the conditions under which transparency influences student participation. Further implications and recommendations for future research are discussed.
Student evaluations of teaching (SET) have been used for decades in teaching programs worldwide to assess educational quality (Scheepers Citation2019). Typically, SET are administered at the end of a course, questioning students about their course experiences like, for example, teacher effectiveness, course quality and content. Hence, SET provide an essential source of information for teachers by identifying course strengths and weaknesses (Chen and Hoshower Citation2003; Hoel and Dahl Citation2019). Well over 80% of teachers at European universities report using SET as diagnostic feedback (Scheepers Citation2019). The results of SET serve more than an educational purpose, however, as outcomes are often used in performance evaluation and thereby influence decisions on promotion or tenure (Heffernan Citation2022). Moreover, SET are used for institutional accountability, for example to demonstrate adequate teacher quality (Spooren, Brockx, and Mortelmans Citation2013).
Despite the wide-spread use of SET and their implications and importance for educational and institutional improvements, there are serious issues with students’ response rates when filling in SET and the response quality (Macfadyen et al. Citation2016; Heffernan Citation2022). At many universities, filling in SET is voluntary, leading to low response rates (Spooren, Brockx, and Mortelmans Citation2013; Goos and Salomons Citation2017). When it comes to the quality of student comments, feedback can be unconstructive or insincere (Ernst Citation2014), or even abusive (Tucker Citation2014), giving teachers little clue about the course or teaching, thereby impairing their functioning. Because SET are an influential – and often sole – tool to determine teacher and course effectiveness (Chen and Hoshower Citation2003; Kite, Subedi, and Bryant-Lees Citation2015; Hoel and Dahl Citation2019), it is important to examine how to increase SET effectiveness.
An important factor discussed in prior research to increase SET effectiveness and students’ motivation to participate is transparency: showing students how feedback is being applied in practice (e.g. Chen and Hoshower Citation2003; Hoel and Dahl Citation2019). However, empirical studies testing whether transparency increases student participation in SET are lacking. We therefore conducted a quasi-experimental field study to test the effects of transparency concerning how student feedback is being applied in practice on students’ motivation to fill in SETs and to provide high-quality feedback.
SET and student motivation
SET – also called course evaluation or teacher evaluation—are used by many educational institutes worldwide to examine teaching effectiveness (Hoel and Dahl Citation2019). Given the importance of SET, a great body of research is devoted to their outcomes and ideas to improve their validity and reliability. When focusing on response rate and quality, which are crucial influences on effectiveness, an important discussion revolves around the barriers and motivators students face when participating in SET (Berk Citation2011; McAuley et al. Citation2017). Barriers include procedural issues, such as having to evaluate multiple instructors and classes simultaneously (Berk Citation2011; McAuley et al. Citation2017), issues related to the evaluation itself, such as survey length (Huang and Lin Citation2014), and issues related to experience, such as having minimal contact with faculty and lacking the skills to give constructive feedback (Berk Citation2011; McAuley et al. Citation2017).
Besides barriers, there are motivators to fill in SET, which for example include rewards, well-designed SET questionnaires, and having a strong opinion about the teaching or course (Hoel and Dahl Citation2019). An important motivator that is reported by students who both often and irregularly fill in SET is the feeling their feedback is meaningful (Hoel and Dahl Citation2019) and valued by teachers (Weng, Weng, and Tsai Citation2014; Paquette, Corbett, and Casses Citation2015). In other words, students who do participate in SET seem to have faith in the process.
Given that universities strongly rely on SET to determine teaching effectiveness, it is daunting that it is exactly this faith in SET that many students seem to miss, leading to poor response rates. Students often show little confidence in the university to take their feedback seriously and make changes accordingly (Asassfeh et al. Citation2014). Instead of feeling as active participants in education, many students are ‘passive consumers’ (Freeman and Dobbins Citation2013). This is also illustrated by a study of Hoel and Dahl (Citation2019), in which 689 students were asked to rate several statements about SET to measure students’ motivations to participate. Results showed that the dominant factor influencing participation in SET was their faith in the evaluation process. Many students indicated little faith, as they had the feeling that the evaluations were not taken seriously, and they saw little change in the courses after filling in SET (Hoel and Dahl Citation2019). Such circumstances give rise to a downward vicious circle, with students not providing (high-quality) feedback as they believe their input is not being valued and applied, and teachers being provided with little clue as to of what can be improved, making them reluctant or unable to use the feedback. To break this dreadful interplay, transparency is considered key (Hoel and Dahl Citation2019).
Transparency
Generally, the purpose of transparency in SET is to inform students of its process and their role in determining course effectivity. As students’ motivation to give (high-quality) feedback on SET is boosted when they feel their feedback is being used, transparency about how it is being used can help to increase the meaningfulness and faith of students in the evaluation process (Chen and Hoshower Citation2003; Macfadyen et al. Citation2016; Linse Citation2017; Hoel and Dahl Citation2019). To be more specific, students indicated their motivation to participate in SET would increase when they were informed of the main SET outcomes and corresponding changes (Hoel and Dahl Citation2019). Furthermore, Chen and Hoshower (Citation2003) showed that the expectations students have of whether their evaluations are used to improve teaching have a significant impact on their motivation to provide feedback.
Showing SET summaries and explaining how the comments will be used by teachers is a praised method in studies discussing the benefits of transparency for SET (Leckey and Neill Citation2001; Chen and Hoshower Citation2003; Hoel and Dahl Citation2019). In these summaries, the most crucial or common points of feedback can be mentioned, and teachers explain how they will use this feedback to optimize the course. Importantly, students’ opinions vary and discretion for teachers to decide on the educational value of certain comments of students should remain (Hoel and Dahl Citation2019). The goal of a summary is therefore not to use every comment, but instead to create more transparency by showing students their comments are being read and taken seriously. This includes that, when the comments will not be applied in practice, an explanation for this is given as well. This way, even though students’ comments are not always fully applied, students can still increase their faith in evaluations and at the same time their feeling of being taken seriously.
Although much is written about the expected effects of transparency, and theories provide promising hypotheses regarding such transparency (Chen and Hoshower Citation2003; Deci and Ryan Citation2012), the evidence pointing to the benefits of transparency for response rates and quality on SET is based on measures of students’ and/or teachers’ perceptions regarding the benefits of transparency (Leckey and Neill Citation2001; Chen and Hoshower Citation2003; Freeman and Dobbins Citation2013; Hoel and Dahl Citation2019). While students are asked whether they would be more motivated to participate in SET, it is not measured whether they do participate in SET more. Hence, in the current study, we examine the effects of transparency on actual student participation in SET.
Current study and hypotheses
SETs are a diagnostic tool globally used to assess teaching quality, but low response rates and low-quality feedback hamper the decisions and changes that are made based on SET results, both on an educational and institutional level. The current study examines whether transparency concerning the use of SET results in practice affects student participation in SET. Our hypotheses are:
Being transparent about how comments are being applied in practice will increase students’ faith in SET, which is reflected by students’ belief that their feedback is applied.
Increased transparency is associated with higher student motivation to fill in SET (Macfadyen et al. Citation2016; Linse Citation2017; Hoel and Dahl Citation2019), which will be reflected by:
higher response rates, and
higher response quality on the SET.
We combine self-report data of how students perceive SET and its meaningfulness (Chen and Hoshower Citation2003; Kite, Subedi, and Bryant-Lees Citation2015; Hoel and Dahl Citation2019) with empirical observations of how students subsequently act in a quasi-experimental field-study. Looking at response rates and quality enables us to obtain a balanced view of how transparency influences both student behaviour on, and perceptions of, SET.
Method
Participants and design
Participants in this study included 391 third year Bachelor psychology students at an urban Dutch university from cohort 2019–2020 (26% identified as male, 74% as female; Mage = 23.2; SDage = 3.46). The programme uses problem-based learning (PBL); a pedagogical model based on collaborative learning using authentic problems (Loyens, Kirschner, and Paas Citation2011). Ethical approval for this study was obtained from the departmental Ethical Review Committee. All data and responses of the students were handled anonymously.
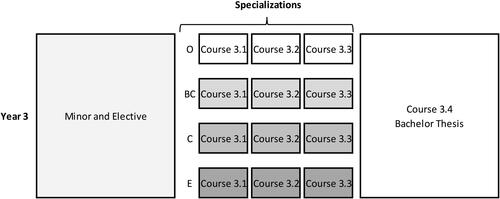
depicts the set-up of the psychology programme. In the first two years, all students followed the same courses. From year 3 onwards, the set-up changes; students first chose their minor and elective course, which can be different for all students. From course 3.1 onwards, students specialize in a field of psychology: organizational psychology (O), brain and cognition (BC), clinical psychology (C) or educational psychology (E). Within a specialization, all students follow the same courses, but courses between specializations differ. The final course, 3.4, is the thesis course, including modules on writing. This is again attended by all students in year 3. The intervention took place in year 3, from course 3.1 onwards to course 3.4.
Figure 1. The program for third year psychology students at the university of our study.
Filling in the SET was mandatory for the students. By filling in the SET, they subscribed to the examination. However, it is important to mention that students’ responses were anonymous. Teachers could not see which students provided which comments. While the closed multiple-choice questions in the SET were mandatory, filling in the open questions was voluntary.
Two specializations were randomly selected as control group (C and E), and two specialisations as intervention group (O and BC). shows the number of students per condition and specialization.
Table 1. Student numbers and age per group.
Procedure
In the last week of the course, students received an email invitation to fill in the SET. The SET results were organized by the faculty’s web-team and were posted on students’ educational online system (Canvas LMS) for the course coordinator and teachers to see. In the intervention groups O and BC, after the evaluation was published, the first author of this study discussed the feedback with the course coordinator. They wrote a summary containing the main points of the SET feedback, and what would be changed in the course. This summary was posted on Canvas LMS (all education was online due to COVID-19). Students were thanked for the responses and notified the summary was posted. For the intervention groups, the summary was made and posted after the completion of 3.1 and 3.2. Each specialization had their own Canvas LMS environment, so students saw only the summary that was relevant to them. In the control groups C and E no feedback summary was posted in their Canvas LMS environment.
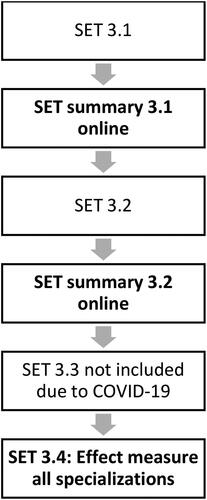
Our intervention was originally planned to run from course 3.1 until course 3.4. However, due to COVID-19, course 3.3 and the corresponding SET could not take place as usual. Filling in the SET in this course was voluntary and the SET was much shorter, mainly aimed at assessing changes due to COVID-19. Hence, we decided to exclude this SET from our study, which resulted in two intervention moments: after course 3.One and after course 3.2. In course 3.4, all education was given online (also pre-COVID-19), which meant the course evaluations could continue as usual (see ). We examined the effects of the intervention in this final course by measuring students’ perceptions of the SET meaningfulness.
Figure 2. Intervention moment in groups O and BC.
As filling in SET was mandatory but open questions were voluntary, we looked at students’ response rates on the open question (i.e. did students put extra effort in voicing their opinion). Response rates were recorded for each SET, after completion of each course.
Measurements
Summary construction
The elements of the summaries to increase transparency with what happens with SET responses were derived from prior research (Chen and Hoshower Citation2003; Bennett and Nair Citation2010; Hoel and Dahl Citation2019). The summaries had to present four topics: (1) inform and show students that their feedback is valued; (2) that their feedback is taken seriously; (3) what the main points of the SET were; and (4) how the coordinator will use the feedback to improve the course. When constructing the summaries, we therefore started with a statement thanking the students for their feedback and noting that we highly value their contribution (elements 1 and 2). Then, the main points of feedback were mentioned (elements 2 and 3), and it was explained what the coordinator will do with the feedback to improve the course (element 4).
Importantly, as also recognized by Hoel and Dahl (Citation2019), students’ opinions vary, and qualified teachers should remain in charge deciding on the educational value of certain comments. Hence, the goal of a summary is not to simply implement every comment, but instead to create more transparency and show students their comments are read and taken seriously. Therefore, we made sure to explain why certain comments were or were not used.
SET meaningfulness perception: Feedback use and motivation to participate
We measured students’ opinions about the feedback they gave and whether they felt faculty used their feedback. To do so, we used parts of the questionnaire constructed by Hoel and Dahl (Citation2019). Three questions were included to measure whether students believed instructors take their feedback seriously (i.e. faith in SET). The validated items included were: (1) ‘I believe that course evaluations are used by those who receive them’; (2) ‘Instructors take course evaluations seriously’; (3) ‘Instructors are open to improving their teaching’. Besides measuring students’ faith in SET, we asked whether their motivation to fill in SET would change if they knew what changes were made accordingly. To do so, we used two validated questions (Hoel and Dahl Citation2019): (4)’’My motivation to participate would be greater if I knew what changes had been made to the course since the last course evaluation’; and (5) ‘My motivation to participate would be greater if I had a summary of the results from the previous course evaluation’.
Measuring response rate and response quality
The SET used was specifically developed to evaluate PBL, and questions were a subset of those described in Schmidt et al. (Citation1995). Items included e.g. ‘Taken together, I’ve worked in an agreeable way’; ‘I consider the subject of this course interesting’; and ‘The course was well organized’, and were scored on a 5-point Likert scale, from fully disagree (1) to fully agree (5). In addition, the SET had two open questions, asking students to explain their answers: (1) ‘What feedback would you like to share with your tutor?’; and (2) ‘Do you have any thoughts or remarks about the course?’
For course 3.4 where we analyse the effects of the summaries, the SET had three open questions: (1) ‘What points of improvement would you give your supervisor?’; (2) ‘What did you appreciate about your supervisor?’; and (3) ‘Do you have any thoughts or remarks about the course? Only the open questions are used to measure response rates and quality.
Analyses
SET content analysis
In addition to looking at the response rates to the open SET questions, we examined the content of the student evaluations. Based on prior research investigating the content of SET comments, we designed a scoring system to provide an in-depth content-analysis of the data (Glover and Brown Citation2006; Tucker Citation2014; Hoon et al. Citation2015; Wallace, Kelcey, and Ruzek Citation2016). For example, specific feedback (e.g. “the study material was hard to read because of the many philosophical papers. I really missed some reading guidelines”) is more helpful than general feedback (e.g. “I did not like this course”). Students’ answers were divided by usefulness, appropriateness and target.
Usefulness
Comments were first divided by usefulness (Tucker Citation2014; Hoon et al. Citation2015; Wallace, Kelcey, and Ruzek Citation2016). To do so, five categories were used: (1) no answer; (2) uninformative answer; (3) general answer; (4) combination of a general and specific answer; and (5) specific answer. Examples and explanations of each category used are depicted in .
Table 2. Examples and explanations of the feedback categories used in this study.
(In)appropriateness
Comments were categorized based on their level of appropriateness and professionalism (Tucker Citation2014). Abusive comments included, for example, offensive language (swear words) and/or racist, sexist or personally abusive terms. Comments that were considered unprofessional contained language or terms that would be inappropriate in a professional setting, but do not contain any abusive statements. The categories were created and tested for 10 courses of two faculties (social sciences and business) at our university. Examples and explanations of each category used are depicted in .
Table 3. Examples and explanations of the (in)appropriate feedback categories used in this study.
The SET responses of the students were scored by the fifth author with this scoring grid. A second rater independently scored a random selection (13.4%) of the entire data set. A sufficient interrater reliability was found, with an intraclass correlation for single measures of .96 (95% CI [.94, .97]). All disagreements were solved via discussion. Consequently, the scoring of the fifth author was used as measure of SET response quality.
Statistical analyses
To examine our first research question, transparency about what happened with the SET will increase students’ faith in SET (i.e. their belief it is being acted upon), we first examined the faith students have in SET and compared this between the intervention and control group. To do so, we grouped the questions regarding faith in SET and calculated an overall faith score. To analyse student self-reported motivation to fill in SET, the two questions measuring student motivation were grouped and one overall motivation score was calculated. Then we compared the groups using analysis of covariance (ANCOVA).
To examine our second research question, transparency concerning how feedback is being applied in practice will increase (a) students’ response rates and (b) response quality, we examined student response rates on the open questions and the response quality as scored by feedback category and appropriateness. Differences in response quality and response appropriateness between the control and intervention group were tested using chi-square analyses.
Results
Preliminary analyses
SET quality and response rates on baseline measurement
Before testing the hypotheses and analysing the data from the final course where all students from each specialization participated, we first examined whether the control and intervention group were equal in terms of their participation and faith in SET at the start of our study. presents the response rates on the SET in course 3.1. As can be seen, the response rates on the closed multiple-choice questions were 100% as filling in the SET was mandatory (on course 3.3, response rates sharply dropped due to the voluntary nature of that SET to 17.6% and 20.9% for the control and intervention group respectively; hence, we excluded this course from our analyses). However, the response rates on the open questions were much lower. Well over half of the students did not fill in the open questions on the SET. Of the comments given, many were specific comments that indicated what was needed to improve in the course.
Table 4. Percentage and type of answers filled in at both the MC and open SET questions on baseline.
We tested whether there were any statistical differences between the control and intervention group in terms of response rate and quality by using chi-square analyses. All findings were non-significant (all p’s > .05), indicating that the students in the control and intervention group can be considered equal in terms of how they fill in the SET. When looking at the appropriateness of students’ answers, almost all students provided appropriate answers. None of the students reported any abusive comments.
Students’ faith in SET
Finally, we examined students’ faith in SET in course 3.1, and whether they felt that adding transparency would help become more motivated to fill in the SET. Results showed that at the start of this study, faith in SET between the control (M = 3.414, SD = 0.89) and intervention group (M = 3.63, SD = 0.95) did not significantly differ F(1, 189) = 2.80, p = .096. Overall, students scored slightly above average in their faith in SET (M = 3.50 on a 5-point Likert scale). Both students in the control group (M = 4.38, SD = 0.71) and the intervention group (M = 4.18, SD = 0.83) scored high (M = 4.30 on a 5-point Likert scale) on the self-reported motivation that adding a summary about what happens to students’ feedback after filling in SET would motivate them to fill it in. The difference between the control and intervention group was non-significant, F(1, 189) = 3.05, p = .082.
Conclusion
The preliminary analyses showed that students in the intervention and control group were equal at the start of this study in their belief that adding summaries would add to their motivation to fill in the SET, and the way they filled in the SET, in terms of response rates and quality. We conclude that our randomization was successful.
H1: Effects of Transparency on SET Meaningfulness
Our first hypothesis was that transparency concerning what happened with the SET results will increase: (a) students’ faith in SET, and (b) the perception that the feedback will be applied (Hoel and Dahl Citation2019). To examine this, we compared the faith in SET between the intervention and control group on course 3.4, after students in the intervention group have received two extended summaries of what happened to their feedback. Students in both the control and intervention group scored slightly above average in their faith in SET (M = 3.68 on a 5-point scale). However, results showed non-significant differences in faith in SET between the control (M = 3.66, SD = 0.82) and intervention group (M = 3.71, SD = 1.04), F(1, 146) = 0.13, p = .718. Interestingly, even though we did not find any differences in faith in SET after providing students with a summary showing what will happen with the SET results, students in both the control group (M = 4.37, SD = 0.70) and the intervention group (M = 4.25, SD = 1.05) indicated that adding such a summary would motivate them to fill in SET. The belief that summaries help to motivate them to fill in SET did not significantly differ between the control and intervention group, F(1, 145) = 0.64, p = .426
Thus, results show that while students say that a summary of what will happen with their SET outcomes would motivate them more to participate in SET, it did not affect the faith students have in SET. We therefore cannot support our first hypothesis.
H2: Effects of Transparency on Response Rate and Response Quality
To examine our second hypothesis, whether adding transparency would: (a) increase students’ participation in SET, and (b) response quality (e.g. Macfadyen et al. Citation2016; Linse Citation2017), we compared the response rate on the SET between the intervention and control groups and the way students provided feedback. Results showed non-significant differences in response rate on the SET and the way students filled it in in the control and intervention groups, X2 (4, N = 861) = 0.81, p = .937. As can also be seen in , students’ responses on the open questions between the control and intervention group were largely the same.
Table 5. Percentage and type of answers filled in at both the MC and open SET questions.
When looking at the appropriateness of the answers, results showed that, of the students who filled in the SET, almost all provided appropriate answers. There were only two students who gave an unprofessional or abusive answer, both from the control group. Hence, a chi-square analysis showed no significant differences in answer appropriateness between the control and intervention group X2 (3, N = 861) = 1.74, p = .629.
Thus, results show that our second hypothesis is not supported.
Discussion
While SET are globally used as a diagnostic tool to assess teaching and course quality, low response rates and low-quality feedback hamper the decisions and changes that can be made based on SET, both at the educational and institutional level. Using a quasi-experimental design, we tested whether transparency about what happens with SET outcomes affects students’ actual participation in SET, as expected by the work of, for example, Hoel and Dahl (Citation2019). We examined whether transparency about how SET results are being applied in practice could increase students’ faith in SET (Hypothesis 1), and whether increased transparency is associated with student participation in SET, as reflected by (a) higher response rates and (b) response quality (Hypothesis 2). To examine our hypotheses, we combined self-report data of how students perceived the SET and its meaningfulness (Chen and Hoshower Citation2003; Kite, Subedi, and Bryant-Lees Citation2015; Hoel and Dahl Citation2019), with empirical observations of how students subsequently act on SETs.
Our results showed no support for our first hypothesis. Students in the intervention group did not differ from the control group in their faith in SET, and thus their perception that comments were used to improve the courses or the teaching. The second hypothesis was also not supported, as the control and intervention group did not differ in how many questions they answered, nor in how informative their answers were.
A possible explanation for these findings could be that our intervention was not strong enough. Although we increased transparency by using summaries, which is in accordance with previous research (Leckey and Neill Citation2001; Chen and Hoshower Citation2003; Hoel and Dahl Citation2019), students may base their faith in SET for a certain course on all experiences they have had with SET instead of from a limited number of courses. Hence, it is possible that summaries need to be presented throughout the curriculum and perhaps in a different form before we can see an effect on student engagement on SET. Future research is needed to confirm this and to determine how many and what kind of summaries would suffice.
Another explanation for our findings could be that students perceive the importance of SET as being low, which could be further reinforced by their having to give feedback at the end of the course only. A summary showing what will be changed next year based on the SET suggestions and feedback may not have motivated our students enough, as they will not benefit from these changes unless they must resit the course. A stronger incentive may be needed to participate in SET, showing that students themselves can benefit from their feedback as well. For example, it may be more beneficial to enable students to give feedback during a course. If a teacher then shows the students what changes will be made in the current course, and makes the changes accordingly, the incentive to provide feedback grows. This does raise several organizational issues for teachers, however, especially during shorter courses and when points of feedback concern large or core parts of the course. When teachers do not have time or resources to make any (large) changes, students’ faith in SET might suffer. Moreover, students could perceive it as additional workload, which potentially counters expected benefits. Future research is needed to examine whether such evaluations could indeed impact the motivation of students, and how this could be organized in a feasible way.
An additional important reason why the transparency in the SET process we offered in this study did not work may be that students are not always sure how to fill in a SET. For example, in the study of Hoel and Dahl (Citation2019), students indicated that they were not always sure how to give feedback or whether they had something valuable to say, preventing them from filling in the SET. Besides showing the importance of participating in SETs, it could therefore be helpful to train students on how to give feedback as well.
Limitations and future directions
The current study is the first quasi-experimental study to combine self-report and empirical observations regarding students’ actual response rate and quality in SET. The results improve insight into the role of transparency in increasing student participation in SET and have high practical value for institutions and future studies alike. At the same time, this study has some limitations. First, we could not be sure that all students read the messages they received. While we distributed the summaries in the LMS (where students were very active) and via personal email, we cannot be sure whether all students took the time to read them. A solution could be to discuss the summary in class, but attention to the message is not guaranteed there either and not all students may attend. For future research, it is recommended to track – if the system allows – how many students read the message.
In the current study, we focused on transparency, which is mentioned as an important potential enhancer of student engagement in SET (Leckey and Neill Citation2001; Chen and Hoshower Citation2003; Hoel and Dahl Citation2019). At the same time, many other factors influencing the success of SET could not be included. For example, influencing factors such as the length of the SET (Huang and Lin Citation2014), the way the surveys are distributed, and class size (Guder and Malliaris Citation2010) were kept constant. Also, other factors such as equity bias in SET could not be controlled because the SET was taken anonymously. Students had many different tutors of diverse genders and backgrounds, and we could not track whether students for example rated women, minorities and older teachers lower (Wilson, Beyer, and Monteiro Citation2014). It is possible, however, that such biases overruled the effects of the transparency intervention. If allowed in the SET infrastructure, future research should measure the occurrence of such biases, and examine whether interventions that impact SET response rate and response quality are also effective at reducing equity bias.
Other factors that are in need for further study include students’ perceived importance of SET as well as the perceived workload. It is imaginable that SET is perceived by students as just another part of a course that simply needs to be completed without thinking too much of it. Although we as teachers can think that students want to contribute to their education, this may not always be the case, especially when the SET is filled in after a course. Including in-course evaluations could increase perceived importance and show students that their input is valuable, thereby potentially increasing response rate and quality. However, the results may also be neutral (e.g. if students simply do not find it that important to contribute to their education) or negative (e.g. due to perceived increase in workload). Insights on issues like this would help determine if and which further SET-related interventions are useful, and under which conditions this is the case.
An important issue that arose during this study is that providing the summaries was time-consuming and stressful for the teachers, and fear of back-lash from students occurred (e.g. when they decided to not change something in the course). There is an interesting balance between being transparent about SET and having discretion as a teacher on which comments to act upon. In our study, we assured teachers they would have discretion in the implementation, and we did not force action (note that all teachers were educationally qualified at the assistant or associate professor level). However, students may feel disappointed when their suggestions were not (all) being used, reflecting in no increase in faith in the evaluation. In the current study, teachers explained to the students why they did not implement certain points and offered alternatives. For example, in one course, some students said the number of course readings should be decreased. The teacher explained that the bachelor programme prepares students for a subsequent master, which included substantially more readings. Instead of decreasing the readings, a guide was implemented to help students plan the readings throughout the course and stay on track. Future research is needed to determine how to construct the summaries in a way that teachers keep their discretion as to which comment to use, while simultaneously increasing students’ faith in SET. A more general message for students shifting the focus from summaries of specific results to information about the broader SET process could be implemented.
Conclusion
Although SET has several validity issues and is not necessarily related to how well students perform and what they have learnt, at many universities they are often the sole factor determining teacher effectiveness. Empirical research on the premises of SET can provide better direction how to improve response rates and quality to overcome some of the validity issues of SET. Based on the findings of our study, we believe that increasing transparency concerning SET results can play a role, but the boundary conditions need to be better defined via empirical research. While students indicated that summaries showing what happens to their SET responses would motivate them to fill in the SET, showing students such summaries with their SET responses and corresponding course changes did not affect actual response rate, response quality, nor students’ faith in SET in the current study. We hope our results spark discussion and encourage researchers to further examine the SET premises empirically.
Ethical approval
Ethical approval for this study was obtained from the departmental Ethical Review Committee.
Disclosure statement
The authors declare that they have no conflict of interest.
Funding
Funding for this research was obtained by the Community for Learning and Innovation of Erasmus University Rotterdam.
Data availability statement
All data will be available upon request.
References
- Asassfeh, S., H. Al-Ebous, F. Khwaileh, and Z. Al-Zoubi. 2014. “Student Faculty Evaluation (SFE) at Jordanian Universities: A Student Perspective.” Educational Studies 40 (2): 121–143. doi:10.1080/03055698.2013.833084.
- Bennett, L, and C. S. Nair. 2010. “A Recipe for Effective Participation Rates for Web-Based Surveys.” Assessment & Evaluation in Higher Education 35 (4): 357–365. doi:10.1080/02602930802687752.
- Berk, R. A. 2011. “Top 20 Strategies to Increase the Online Response Rates of Student Rating Scales.” International Journal of Technology in Teaching and Learning 8 (2): 98–107.
- Chen, Y, and L. B. Hoshower. 2003. “Student Evaluation of Teaching Effectiveness: An Assessment of Student Perception and Motivation.” Assessment & Evaluation in Higher Education 28 (1): 71–88. doi:10.1080/02602930301683.
- Deci, E. L, and R. M. Ryan. 2012. “Self-Determination Theory.” In Handbook of Theories of Social Psychology, Vol. 1, 416–436. Thousand Oaks, CA: Sage Publications Ltd. doi:10.4135/9781446249215.n21.
- Ernst, D. 2014. “Expectancy Theory Outcomes and Student Evaluations of Teaching.” Educational Research and Evaluation 20 (7–8): 536–556. doi:10.1080/13803611.2014.997138.
- Freeman, R, and K. Dobbins. 2013. “Are we Serious about Enhancing Courses? Using the Principles of Assessment for Learning to Enhance Course Evaluation.” Assessment & Evaluation in Higher Education 38 (2): 142–151. doi:10.1080/02602938.2011.611589.
- Glover, C, and E. Brown. 2006. “Written Feedback for Students: Too Much, Too Detailed or Too Incomprehensible to Be Effective?” Bioscience Education 7 (1): 1–16. doi:10.3108/beej.2006.07000004.
- Goos, M, and A. Salomons. 2017. “Measuring Teaching Quality in Higher Education: Assessing Selection Bias in Course Evaluations.” Research in Higher Education 58 (4): 341–364. doi:10.1007/s11162-016-9429-8.
- Guder, F, and M. Malliaris. 2010. “Online and Paper Course Evaluations.” American Journal of Business Education 3 (2): 131–138.
- Heffernan, T. 2022. “Sexism, Racism, Prejudice, and Bias: A Literature Review and Synthesis of Research Surrounding Student Evaluations of Courses and Teaching.” Assessment & Evaluation in Higher Education 47 (1): 144–111. doi:10.1080/02602938.2021.1888075.
- Hoel, A, and T. I. Dahl. 2019. “Why Bother? Student Motivation to Participate in Student Evaluations of Teaching.” Assessment & Evaluation in Higher Education 44 (3): 361–378. doi:10.1080/02602938.2018.1511969.
- Hoon, A., E. Oliver, K. Szpakowska, and P. Newton. 2015. “Use of the ‘Stop, Start, Continue’ Method is Associated with the Production of Constructive Qualitative Feedback by Students in Higher Education.” Assessment & Evaluation in Higher Education 40 (5): 755–767. doi:10.1080/02602938.2014.956282.
- Huang, Y, and S. Lin. 2014. “Assessment of Charisma as a Factor in Effective Teaching.” Educational Technology & Society 17 (2): 284–295.
- Kite, M. E., P. C. Subedi, and K. B. Bryant-Lees. 2015. “Students’ Perceptions of the Teaching Evaluation Process.” Teaching of Psychology 42 (4): 307–314. doi:10.1177/0098628315603062.
- Leckey, J, and N. Neill. 2001. “Quantifying Quality: The Importance of Student Feedback.” Quality in Higher Education 7 (1): 19–32. doi:10.1080/13538320120045058.
- Linse, A. R. 2017. “Interpreting and Using Student Ratings Data: Guidance for Faculty Serving as Administrators and on Evaluation Committees.” Studies in Educational Evaluation 54: 94–106. doi:10.1016/j.stueduc.2016.12.004.
- Loyens, S. M. M. P. A. Kirschner, and F. Paas. 2011. “Problem-Based Learning.” In APA Educational Psychology Handbook: Vol. 3. Application to Learning and Teaching, edited by K. R. Harris, S. Graham & T. Urdan, 403–425. Washington D.C.: American Psychological Association.
- Macfadyen, L. P., S. Dawson, S. Prest, and D. Gašević. 2016. “Whose Feedback? A Multilevel Analysis of Student Completion of End-of-Term Teaching Evaluations.” Assessment & Evaluation in Higher Education 41 (6): 821–839. doi:10.1080/02602938.2015.1044421.
- McAuley, J. W., J. L. Backo, K. F. Sobota, A. H. Metzger, and T. Ulbrich. 2017. “Identifying Motivators and Barriers to Student Completion of Instructor Evaluations: A Multi-Faceted, Collaborative Approach from Four Colleges of Pharmacy.” Currents in Pharmacy Teaching & Learning 9 (1): 20–27. doi:10.1016/j.cptl.2016.08.029.
- Paquette, K. R., F. J. Corbett, and M. Casses. 2015. “Student Evaluation Response Rates of Teacher Performance in Higher Education Online Classes.” The Quarterly Review of Distance Education 16 (4): 71–82.
- Scheepers, A. W. A. 2019. SET Project: Student Evaluations of Teaching, Measuring and Enhancing Course Quality and Teaching Quality. Rotterdam: Rotterdam School of Management, EUR & European QUAlity Link EQUAL. https://equal.network/projects.
- Schmidt, H. G., D. Dolmans, W. H. Gijselaers, and J. E. Des. Marchais. 1995. “Theory-Guided Design of a Rating Scale for Course Evaluation in Problem-Based Curricula.” Teaching and Learning in Medicine 7 (2): 82–91. doi:10.1080/10401339509539719.
- Spooren, P., B. Brockx, and D. Mortelmans. 2013. “On the Validity of Student Evaluation of Teaching: The State of the Art.” In Review of Educational Research 83 (4): 598–642. (. doi:10.3102/0034654313496870.
- Tucker, B. 2014. “Student Evaluation Surveys: Anonymous Comments That Offend or Are Unprofessional.” Higher Education 68 (3): 347–358. doi:10.1007/s10734-014-9716-2.
- Wallace, T. L. B., B. Kelcey, and E. Ruzek. 2016. “What Can Student Perception Surveys Tell Us about Teaching? Empirically Testing the Underlying Structure of the Tripod Student Perception Survey.” American Educational Research Journal 53 (6): 1834–1868. doi:10.3102/0002831216671864.
- Weng, C., A. Weng, and K. Tsai. 2014. “Online Teaching Evaluation for Higher Quality Education: Strategies to Increase University Students’ Participation.” Turkish Online Journal of Educational Technology-TOJET 13 (4): 105–114.
- Wilson, J. H., D. Beyer, and H. Monteiro. 2014. “Professor Age Affects Student Ratings: Halo Effect for Younger Teachers.” College Teaching 62 (1): 20–24. doi:10.1080/87567555.2013.825574.