
Abstract
Based on a Chinese saying: “Even a clever housewife cannot cook a meal without rice”, a simple categorization of the methods for Predictions in Ungauged Basins (PUB) is proposed, including: Borrowing, obtaining hydrological information by transplanting measurements from a similar basin, or extrapolating/interpolating the data from neighbouring catchments; Substituting, finding substitutes either from the ungauged basin or from donating area(s); and Generating, obtaining data via field or laboratory observations. The Substituting category is classified further into: S1, substitution only from within the ungauged basin using fully process-based models without calibration; S2-1, from similar gauged basins using established index/distribution; S2-2, from various gauged basins using regression and/or process-based relationships between the climate/catchment features and hydrological signatures (CCH), and S3, from the information beyond the CCH relationship. Based on a review, the Darwinian S2-2 and Newtonian S1 were found to be the two most popular methods, both for China and worldwide PUB.
Editor Z.W. Kundzewicz
Résumé
En nous inspirant du proverbe chinois qui dit que « même une habile cuisinière ne peut préparer un repas sans riz », nous proposons une catégorisation simple des méthodes pour la prévision dans les bassins non jaugés (PUB) à savoir : Emprunt, obtention de l’information hydrologique à partir de mesures sur des bassins similaires ou par extrapolation / interpolation de données de bassins versants voisins; Substitution, en trouvant des données de substitution dans le bassin non jaugé lui même ou dans une ou plusieurs régions donneuses; Génération enfin, en obtenant des données à partir d’observations de terrain ou de laboratoire. La catégorie Substitution peut elle même être divisée en : S1, substitutions ne provenant que du bassin non jaugé en utilisant toutes les ressources de modèles de processus sans calage ; S2-1, substitutions à partir de bassins jaugés similaires selon un indice ou une distribution établis; S2-2, substitutions à partir de différents bassins jaugés en utilisant une régression et/ou une relation basée sur les processus entre le climat ou les caractéristiques des bassins et les signatures hydrologiques (CCH), et S3, substitutions de l’information au-delà de relations CCH classiques. Sur la base de nos évaluations, la méthode newtonienne S1 et la méthode darwinienne S2-2 ont été jugées les meilleures, que ce soit pour la Chine ou pour le reste du monde.
INTRODUCTION
The Decade for Predictions in Ungauged Basins (PUB) was launched by the International Association of Hydrological Sciences (IAHS) at the Assembly of the International Union of Geodesy and Geophysics (IUGG) in 2003, Sapporo, Japan after its formulation in Brasilia in 2002 (Sivapalan et al. Citation2003), and ended in 2013.
For a basin, which is essentially a very complex system (Blöschl and Merz Citation2010, Kumar Citation2011), prediction has already posed challenges. For ungauged basins, the challenges of prediction are even greater, forcing people to seek every possible solution to overcome them. So, when referring to different methods of PUB, there are many that immediately spring to mind, such as (in alphabetical order): classification, disaggregation, extrapolation, field experimentation, geostatistic method, grouping, indexing, interpolation, isoline mapping, data-filling for missing data, physical process modelling, the Rational method, regionalization, regression, remote sensing, scaling, transferring, transplanting, using proxy data, to name a few. There have been many publications summarizing PUB achievements and methodology over the years and around the world, among which, the most recent overviews are: Blöschl et al. (Citation2013), Hrachowitz et al. (Citation2013) and Pomeroy et al. (Citation2013). There are also publications showing the national or regional advances or methodologies of PUB work; for example, in China: Liu et al. (Citation2005), Yang et al. (Citation2008) and Xu et al. (Citation2009). However, so far, a simple and clear methodology has not been generated, which has been a barrier for communications within PUB and beyond.
In this paper, a simple categorization of PUB methodology is made based on an analogy between the methodology appropriate for solving the problems of prediction in ungauged basins and a Chinese allegory “Even a clever housewife cannot cook a meal without rice” (巧妇难为无米之炊) (Liu et al. Citation2010). If there is no rice, an able housewife will do something alternative to feed the family. Those who would predict in ungauged basins face the “without rice” situation and PUB researchers must also find alternatives. By using the same approach as a housewife determining how to overcome the difficulties of cooking without rice, we summarize the PUB methodology with a simple categorization: Borrowing, Substituting and Generating, abbreviated as BSG. Comparison is made between this BSG categorization and the methods generalized by Blöschl et al. (Citation2013). Then the main methods in PUB are analysed, using BSG, based on the information drawn from Blöschl et al. (Citation2013) and by reviewing the PUB work in China. Finally, we provide a perspective as to how PUB work will progress into Panta Rhei, the new IAHS Decade, using the BSG categorization.
THE NEW AND SIMPLE CATEGORIZATION OF PUB METHODOLOGY
Borrowing
Let us imagine a scene: Returning home from an exciting tourist trip, all the family are tired and hungry. They ate out frequently during the trip. Everybody is looking forward to eating delicious rice cooked by Mom. However, the family are frustrated when they find that there is no rice at all at home. So what will the clever housewife do in order to feed her family? By assuming that the family’s first choice of food is rice or a rice-related food, the first solution this clever housewife may think of is to borrow rice from neighbours exploiting her friendship with them, or from shops by using her money, as shown by the arrow marked (B) in .
Fig. 1 The relationships among the possible solutions that a clever housewife may find when she wants to feed her hungry family but has no rice, including Borrowing (B) from neighbours or shops, using substitutes from within the home (S1), using substitutes from outside the home (S2), using substitutes (S3) such as new food products, and Generating (G) by planting rice seed immediately. The forcing factors in the figure are those driving or helping the housewife to find substitutes, such as the location of the places where she can find food, time to get there, the family’s favorite food, road conditions, etc.
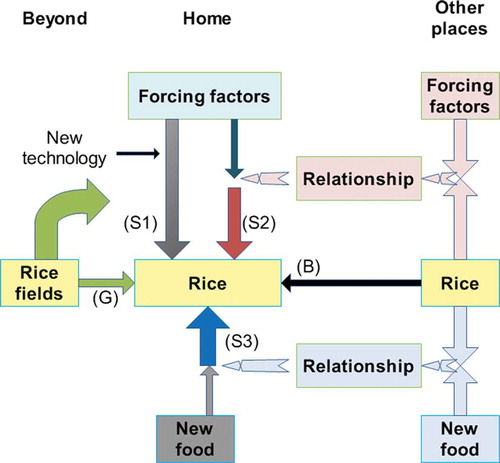
Within PUB, borrowing hydrological elements (HE) from gauged basins, as shown with the arrow marked (B) in , is also the first approach. It is a simple and sometimes very effective approach in PUB. Micovic and Quick (Citation1999) showed that modelling errors obtained using calibrated parameters remained the same when using parameters that were averaged over 12 catchments or individual parameters for each catchment. This, from another perspective, supports the Borrowing from one place. If there is no guarantee for the housewife to borrow sufficient rice from one place, she may borrow it from several places. Similarly, Borrowing for PUB also pays attention to all the possible basins, among which at least one or two may meet the requirement in some respects.
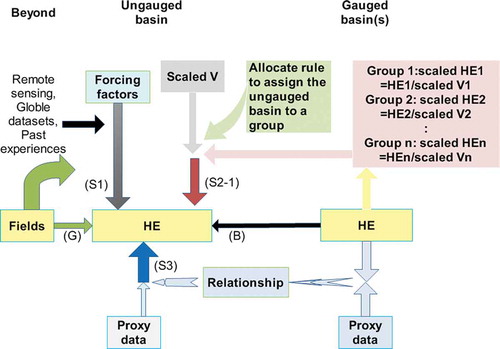
Fig. 2 With reference to PUB, the relationship among Borrowing (B), using substitutes from within the ungauged basin (S1), using substitutes from gauged basins by grouping them into n groups with similar scaled hydrological elements (HE), scaled by the scale variable V (S2-1), using proxy data as substitutes (S3) and Generating (G).
The places the housewife goes to borrow the rice are obviously not everywhere. The most possible places are her friends’ homes or the places which have rice to sell. Similarly, Borrowing for PUB also needs to satisfy some conditions. Similarity is the number one condition for Borrowing. By assuming that the closer the basins, the tighter is the relationship between their data (spatial proximity), it is possible to obtain information for the study basin by transplanting, interpolation or extrapolation, based on the data borrowed from the nearby basins. However, two spatially-close basins are not necessarily similar. Temporal proximity also needs to be considered. According to the concept of spatial-temporal proximity (Li et al. Citation2006) or hydrological similarity (Blöschl et al. Citation2013, p. 18), the sub-basins within a larger basin are more similar to each other than the sub-basins that belong to different basins but may be closer to each other in distance. The reason is that the flow between the former is surely larger than the latter.
The very simple and classic Borrowing techniques include transplanting and interpolation/extrapolation from isolines/isopleths/isograms, and are perhaps the first methods ever used in PUB, just like the first choice of the clever housewife. Recently, some new Borrowing techniques have been established, such as Top-kriging (Skøien et al. Citation2006) and PSBI (Physiographic Space-based Interpolation, Chokmani and Ouarda Citation2004), which are geostatistical methods. Based on its performance, Borrowing remains the best method among all the PUB methods, as assessed by Blöschl et al. (Citation2013, p. 371).
However, its requirements, i.e. hydrological similarity based on spatial-temporal proximity, are sometimes very difficult to meet, as it may be impossible to find nearby gauged basins that satisfy the spatial-temporal proximity. The risk associated with this method is that distance is often not a good indicator of hydrological similarity and in sparsely-gauged regions, distances and hydrological variation may be great. If there is some turning point between the basins, the interpolation and/or extrapolation will fail. As a result, this method may result in significant errors when the assumption of the basins’ hydrological similarity is violated to some degree.
Substituting: S1
Sometimes it is not possible to borrow rice from neighbours or shops; perhaps the time of arrival is past midnight when every shop is closed and every neighbour asleep. Instead of Borrowing, the clever housewife will have to try to find substitutes from her home to feed her family, e.g. finding some rice-biscuits, bread or anything which can be eaten, as shown by the arrow marked (S1) in . Correspondingly, finding substitutes is also an important strategy for PUB (arrow marked (S1) in ).
For a housewife, the key to finding substitutes from her home is the full and detailed knowledge of her home. She knows where to find the substitutes at home and can check whether they have expired by reading the use-by date on the wrappers. She even knows if the rice-biscuit in her refrigerator is edible or not because it was made or bought by herself. She knows the expiry date even if there is no wrapper around it.
For people working with PUB, finding a substitute in this way also fully relies on good knowledge of the ungauged basin. They must know each of the physical processes well, and know how water and energy are partitioned, transmitted, stored and released between the atmosphere and land surface. A fully process-based hydrological model is useful, with the help of modern remote sensing, for determining parameters, e.g. LAI from MODIS, and water level from satellite altimetry; use of global datasets to determine topography and soil features, and any available regional look-up tables to determine roughness or the Manning coefficient; field visits and field surveys to read the landscape and find historical flood marks, erosion paths, etc., and field experiments to determine parameters such as infiltration with some scaling techniques; as well as using his/her previous experience and the literature to determine other parameters. They can predict hydrological elements by using their fully process-based models and these auxiliary information datasets. The parameters of this kind of model have clear physical meaning, so no hydrological data are needed for calibrating the model. In the S1 method, the substitutes are the fully process-based models and possible auxiliary information, which are all from within the ungauged basins.
This method is typically Newtonian (Blöschl et al. Citation2013, p. 3). Freeze and Harlan (Citation1969) first proposed the process-based model in their ‘blueprint for a physically-based, digitally-simulated hydrological response model’. The process-based model was so complex that for a long time people were afraid of using it for hydrological prediction, even for gauged basins. Their thinking was based on the simple logic that the more complex the model, the more data necessary for calibrating model parameters, the more uncertainty it may contain, so the less useful the model is for prediction. Indeed several international and national model comparison projects (Li Citation1998, DMIP Reed et al. Citation2004, MOPEX, Schaake et al. Citation2006) show that the more complex models are, the lower is their modelling efficiency. However, a fully process-based model is not just more complex, it is ‘more’ in the sense of dealing clearly with processes, and so more transparent to the hydrological system and not reliant on data to calibrate the parameters. There is not yet a comparative assessment directly between the efficiency of fully process-based models and the efficiency of other models (Blöschl et al. Citation2013, p. 373); this needs to be addressed in the near future.
Substituting: S2
If there is nowhere to borrow from and no food at all at home to use as a substitute, to feed her family, the housewife will have to look for substitutes from the outside (arrows marked (S2) in ). She will have to use the telephone directory to call to get a food delivery, or drive out further to see if she can find a 24/7 shop to buy food, or be forward enough to knock on a nice neighbour’s door. Before making a decision from any of these choices, she will have to make a (quick) investigation to see which place is mostly likely to have rice-related food as a substitute. Based on her investigation, she will then either make a phone call, drive the car, or knock on a door, to obtain the substitute. The key here is to get information from outside as a substitute, which requires the housewife to have sufficient societal knowledge of the ‘food-web’ around the locality.
Fig. 3 The same as , but with the the parts for S2-1 in replaced with the parts for S2-2.
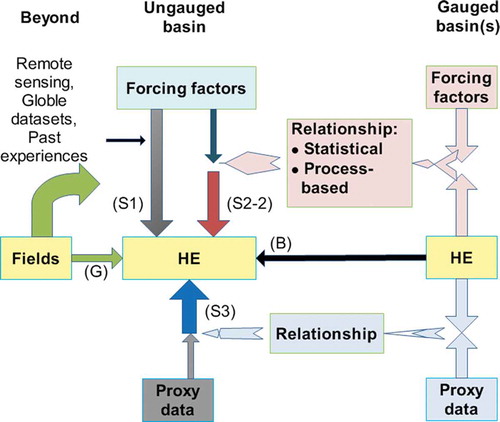
For hydrologists doing PUB, this is also another important method. There are two situations (arrows marked (S2-1) in and (S2-2) in ).
In S2-1, the gauged basins first have to be grouped using cluster analysis or other proximity analysis based on hydrological similarity. Within the groups, the sub-basins should be as similar as possible and the scaled HEs are assumed identical. These scaled HEs can be obtained as a theoretical distribution, or a generalized rule, or a regional synthesis within the homogeneous group. The variable used for scaling should always be available in the ungauged basin. For example, average annual runoff is always used as a scaled variable to scale the flow duration curve. The disaggregation procedure is a simple example of S2-1. For an ungauged basin, by walking up or down, we can always find a smaller or larger gauged basin. According to the principle of hydrological similarity mentioned above, the sub-basins belonging to one basin are always similar. The discharge for the gauged basin is first scaled by its contributing area. Then the streamflow for the ungauged basin can be predicted with this scaled streamflow multiplied by the contributing area of the ungauged basin. The disaggregation technique is based on the assumption that the streamflow contribution from each sub-catchment to the total catchment yield is proportional to the ratio of its area and its average slope. Obviously, as the interflow and groundwater flow depend more on flow paths than on the catchment area, disaggregation cannot effectively minimize model errors if the ratio of surface runoff to total runoff is very low (Schreider et al. 2002). In S2-1, the substitutes include the scaled identical HE from gauged basins and the variable to be scaled in the ungauged basin.
In S2-2, to find substitutes becomes the finding of a general rule between the climate/catchment features and HE based on gauged basins. The general rule can be either a statistical relationship (linear regression, nonlinear regression, power-law, Fourier, or any of such statistical equations), or a process-based model. To make the rule as general as possible, the gauged basins to be used to establish the general rule should be as dissimilar as possible and sufficiently representative, spanning enough scale in both space and time. The general rule also needs to establish a look-up table for the rule’s parameters, so that it can be used in ungauged basins. The substitutes in S2-2 in this situation include the general rule between climate/catchment features and HE from gauged basins, including structure and parameters, and the corresponding climate/catchment features in the ungauged basin.
The co-evolution/Darwinian theory (Thompson Citation1994, Sivapalan et al. Citation2005, Citation2011) lends us confidence to find such a general rule or identical scaled HE. On the one hand, the hydrological system is so complex that prediction is very difficult; on the other hand, such a complex system is always producing some temporal and spatial pattern, so providing opportunities for prediction (Blöschl et al. Citation2013). While the causal relationship is hard to explore, the patterns that are useful for prediction, with climate as the driving force and land features as secondary co-evolving forcing, can be explored through comparison. Belonging to comparative hydrology (Falkenmark and Chapman Citation1989, Woo and Liu Citation1994, Granger and Pomeroy Citation1997, McDonnell and Woods Citation2004, Blöschl and Merz Citation2008, Wagener et al. Citation2010), this approach does not aim at simulating each basin in great detail. Instead, it uses the geographical perspective to find a pattern, the principal component of driving force, and the gradients of the elements, if existing. The result is very useful for prediction in ungauged basins.
The difference between the process-based models used in S2-2 and the process-based models used in S1 is that in S2-2 the process-based model can range from as simple as the Rational model, to lumped conceptual models, index models, as well as fully process-based models. In S2-2 the parameters and or structure of the general rule, if present, all rely heavily on the calibration of data in the gauged basin. Therefore, the process-based model in S2-2 cannot be as complex as the model in S1. Otherwise the calibration efficiency is very low (Fernandez et al. Citation2000, Young Citation2006). This also explains why we independently list S1 as a unique PUB method. PUB welcomes both Newtonian and Darwinian pathways. No matter which is used, the common aim is to perform better prediction in ungauged basins.
Due to the scale problem, the observed point scale parameter used as a priori information to S1 may be not applicable at the basin scale. If regional information is available, it will surely increase the model efficiency of S1 through possible calibration from the gauged basin. However, regression is only successful when the models have a small number of parameters (less than five, Young Citation2006). Therefore, the distinction between S1 and S2-2 is not sharp. There is a gradual transition from one to the other. They can be used conjunctively to support each other.
Substituting: S3
While the clever housewife is busy investigating a good way to feed her family by either Borrowing (B), finding substitutes at home (S1) or finding substitutes outside (S2-1 and S2-2), suddenly somebody knocks at her door. Through the peephole, she sees a salesman holding several boxes. The outside of the boxes read ‘The newest instant food product for feeding your family!’ When asked what it is, the salesman says that it is new food products extracted from ancient times. It is so special that the housewife is in a dilemma as to whether it could be another way to feed her family (arrow marked (S3) in ).
Like the housewife, hydrologists have been stimulated to use many special data in making predictions for ungauged basins (arrows marked (S3) in and ). Blöschl et al. (Citation2013) give several examples of the use of tree rings to reconstruct runoff in the USA, Mongolia, Australia and China. Chen et al. (Citation2013) found that there are relations between ice melting and polar motion, which lends confidence to the use of the long-term series of polar motion to derive the discharge of primitive big rivers in the world (Wang and Liu Citation2013). It takes time for people to get accustomed to use of such data as a substitute for predictions in ungauged basins, even though very good validation results are given for some gauged basins. Validation in this situation is not the most important thing. Providing a causal explanation between the special data and HE is the priority; no matter how, it is worth trying.
Generating
Even if the Borrowing and Substituting methods fail, the clever housewife will never give up. She will go to the field, digging holes and planting seeds, to produce food for her family (arrow marked (G) in ). Analogously, observation of HE, which includes field measurement and laboratory observation, is a good solution to the problem of data scarcity (arrows marked (G) in and ).
As mentioned in the description of S1, the method of Generating also includes reading the landscape by field visits and field survey. These are especially useful for flood prediction for ungauged basins. The Generating method, if not able to perform prediction independently, helps all the other methods to perform better. By using this method, an ungauged basin immediately becomes at least partially-gauged, so decreasing the difficulty of the prediction.
Paired-catchment analysis is especially useful for ‘observing’ the response of a catchment to land-use and climate change, the newly emerging hydrological elements of today, with extensive human activity involved. There are many documented studies using the paired-catchment analysis method, as summarized in Liu et al. (Citation2004), and later reviewed in Vanclay (Citation2009) and Bart and Hope (Citation2010). Paired-catchment analysis actually belongs to the framework of comparative hydrology, a hot topic and a useful tool in the method of Generating.
COMPARISON OF CATEGORIZATION OF PUB METHODOLOGY USING BSG AND THE BLÖSCHL et al. FRAMEWORK
In Blöschl et al. (Citation2013), two fundamental types of method (abbreviated as TFT) are summarized for estimating runoff in ungauged basins, i.e. statistical methods and process-based methods. The first type includes the regression method, index method, geostatistical method and estimation from short runoff records. The second type includes derived distribution methods, methods based on continuous rainfall–runoff models and methods that exploit proxy data. The relationship between TFT and our categories, i.e. Borrowing, Substituting and Generating (BSG) is shown in . It is seen that BSG matches well with TFT.
Table 1 The relationship between TFT proposed in Blöschl et al. (Citation2013) and BSG proposed in this paper.
There are some differences though. Gauged basins with data records in one part of a period are ungauged basins in another part of that period. All of the methods used for PUB can thus be used for filling missing data and so making the data records longer (Liu et al. Citation2009). In this sense, we do not treat the method of estimation from short runoff records as belonging to an independent method of BSG. Furthermore, the method of continuous rainfall–runoff models has been divided into fully process-based and other process-based models, as they follow two different pathways, i.e. Newtonian and Darwinian, to make contributions to PUB.
THE MAIN METHODS USED WORLDWIDE CATEGORIZED WITH THE BSG FRAMEWORK
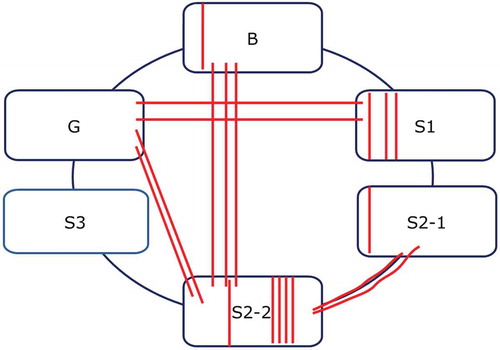
It is not possible to fully summarize the main methods used for PUB worldwide and their linkages, in this article. Under the framework of BSG and based on the review in the benchmark PUB volume (Blöschl et al. Citation2013), we can do this at two levels. First, a summary is given based on the 20 chosen representative case studies in Blöschl et al. (Citation2013), as shown in . It is interesting that over the years, most typical PUB studies have focused on using the Newtonian pathway of S1 and the Darwinian pathway of S2-2. There are obviously more Darwinian works than Newtonian works. One of the important reasons is due to the support by Borrowing (B, geostatistical). Substituting from outside via the Index method (S2-1) is less popular than Substituting from outside via regression (S2-2). Doing field experiments (G) has been used equally to support these two pathways. Substituting (S3) using proxy data has not been widely used.
Fig. 4 Distribution of the methods used in the work of 20 case studies in Blöschl et al. (Citation2013) according to BSG.
Second, we simply count the number of the references that Blöschl et al. (Citation2013) cite for the prediction of five hydrological signatures under BSG. The results are shown in and . In the earliest method used in PUB is Borrowing, which, however, is only applied for predicting annual runoff. It is very unusual to use Borrowing for predicting the flow duration curve or hydrograph. S2-2 perhaps is the oldest method which can be used for predicting almost all the hydrological signatures. The method of S3 is relatively new.
Fig. 5 Years of the earliest publications using each of the BSG methods to predict the hydrological signatures: annual runoff (A), seasonal runoff (S), low flow (L), floods (F), flow duration curve (FDC) and hydrograph (H).
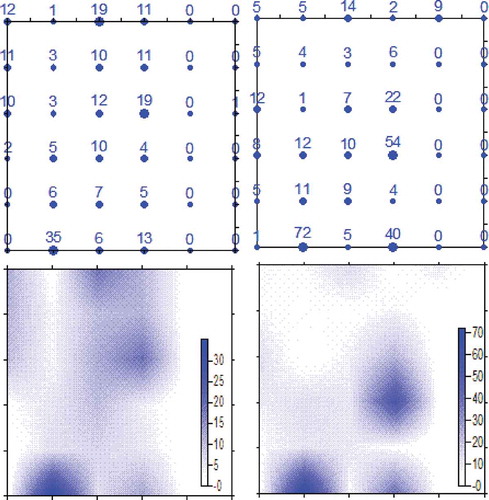
Fig. 6 The distribution of the number of the references cited by Blöschl et al. (Citation2013) according to the different hydrological signatures and BSG framework. From top to bottom along the vertical y-axis the order is annual runoff, seasonal runoff, low flows, floods, flow duration curves and runoff hydrograph. From left to right along the horizontal x-axis the order is B, S1, S2-1, S2-2, S3 and G. The left panel is before the PUB decade and the right panel is during/after the PUB decade. The upper and lower panels present the same results but displayed differently.
The statistics based on more samples () show that, for all of the signatures, the total numbers of references cited are 35, 53, 64, 103, 0, 1 for B, S1, S2-1, S2-2, S3 and G, respectively, before the PUB decade, whereas the total numbers of references cited during and after the PUB decade are 36, 105, 48, 128, 9 and 1, respectively. It is interesting to see that the regression method (S2-2) was the number one method for PUB both before and after the start of the PUB decade, reflecting the dominant role that the Darwinian pathway plays in PUB, as described by Blöschl et al. (Citation2013). During and after the PUB decade, it can be seen that S1 becomes another hot topic. Although formerly in hydrology prediction, especially operational hydrological forecasting, people did not like fully process-based models partly because they contained many more parameters than simple conceptual models, such models have obtained wide acceptance recently with the efficient help of remote sensing and geographical information systems (GIS) for parameter determination.
From it is found that this feature is especially obvious for hydrological signatures other than annual runoff. For annual runoff, the Borrowing (B) and Index method/derived distribution method (S2-1) are the most popular methods for PUB. It is also worth mentionning that proxy data (S3) are also promising for annual runoff prediction.
As the references used for flow duration curve and hydrograph are not independent, the data to compare these two signatures are not explicit. The zero values do not necessarily mean that there is no such research in this field. For example, the method of Generating (G) is usually done in combination with other methods. As Blöschl et al. (Citation2013) did not list it as an independent method, the statistics shown here do not fully reflect the truth.
THE MAIN METHODS USED FOR PUB IN CHINA CATEGORIZED WITH THE BSG FRAMEWORK
Being a country with climate zones ranging from the arid to the humid, a population reaching 1.3 billion, and rapidly increasing economic development, China is facing almost all aspects of hydrological challenges. The hydrological station density in China, especially in western China (), is lower than the standard density recommended by the World Meteorological Organization (WMO). Prediction in ungauged basins is therefore highly relevant to China and was recognized as early as the 1950s. Since then much important hydrological research has been done on the topic. With the initiation of PUB by IAHS, further work on PUB has been conducted in China. However, due to the language limitation, large amounts of PUB results published in Chinese are not known internationally as yet (Hrachowitz et al. Citation2013).
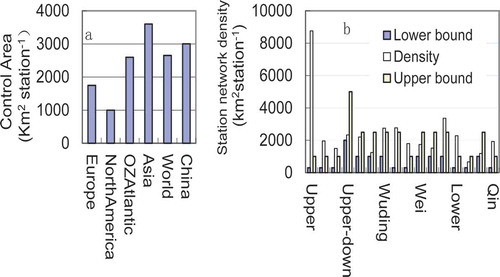
Fig. 7 (a) The controlled area per station (km2) in China and other places in the world. (b) The station network density of each sub-catchment of the Yellow River Basin, the second longest river in China; the x-axis displays the location from Western China to East China (Liu et al. Citation2010).
By reviewing the literature about the PUB work done in China, mostly written in Chinese, and reviewing the articles collected in two IAHS publications based on two China PUB workshops (Yang et al. Citation2008, Xu et al. Citation2009), the main methods used in China and links between them can be identified ().
Table 2 The number of articles in the literature focusing on PUB in China categorized with the BSG framework.
Overall, shows a similar trend for PUB methodology in China to the world; i.e. the regression method is the most popular method ever used. We also see a growing use of process-based models after the start of the PUB Decade in 2002, another feature similar to PUB internationally.
There are also some specific features to each of the methods used for China PUB. The Borrowing method was widely used in the nation-wide classification and investigation of rivers in the 1950s–1960s in China (Guo and Tang Citation1980, Liu Citation1986). For all provinces, many hydrological maps, hydrological handbooks, and storm-runoff calculation books have been produced since then. This information provided strong support for flood design (e.g. Yang Citation1999, Ministry of Water Resources of China Citation2002), unit hydrograph estimation (Li and Shen Citation1996), and even for the exploration of hydrological response to climate change (Guo et al. Citation2002) for medium and small basins. At present in China, there are not only runoff spatial distribution maps, but also maps for actual evapotranspiration, soil moisture, precipitation, radiation, sunshine duration, aridity index and others (e.g. Liu et al. Citation2001, Citation2004, Zhan and Xia Citation2010, Fan et al. Citation2011). These maps show the features in individual catchments or across entire regions. They provide sound data for ungauged basins, supporting hydrological studies and water resources management. For political reasons, most documents at that time were not published and were only printed as booklets or atlases for internal communication and/or operational reference. This explains the very small amount of published literature on this popular method in China.
For the S1 method of Substituting, there are several characteristics. First, as elsewhere in the world, China is enthusiastic about modelling (S1) especially since the initiation of the PUB Decade. The models used include the fully processed eco-hydrological models developed in China, such as the Vegetation Interface Processes model (VIP, Mo and Liu Citation2001, Mo et al. Citation2012), WEPL (Jia et al. Citation2009) and GMHM (Yang et al. Citation2008). The parameters for physical process-based distributed hydrological models, such as VIP, are determined by doing experiments, making them possible to apply in PUB. With the aid of remotely-sensed soil moisture datasets retrieved by the Vienna University of Technology (TUW), Liu et al. (Citation2009) applied the VIP model to produce the spatial pattern and trend of soil moisture in the Wuding River basin of the Loess Plateau, China from 1956 to 2004. Data were generated for the whole of the region, which has only two in situ soil moisture observation stations with short records. Second, besides the wide use of fully processed-based models to obtain hydrological signatures, there are several studies focused on seeking an analytical solution to the geomorphological unit hydrograph (Liang et al. Citation2008, Shi et al. Citation2008, Sun et al. Citation2009) and Richards equation (Lv et al. Citation2008), and to methods for obtaining the environmental flow (Liu et al. Citation2008b). Recently, an analytical method to deduce the flood volume from flood marks using hydraulics at bridges was established (Wen et al. Citation2011). Finally, by using the fully process-based model, or some analytical mathematical equations, China PUB attends to all the hydrological elements: soil moisture (as mentioned above); evapotranspiration and water-use efficiency (Mo et al. Citation2005), glacial mass balance (Ding and Xie Citation1991), river cross-section and discharge (Zhu et al. Citation2010), mud flow (Pan et al. Citation2012), and snowmelt flow (Shu et al. Citation2010, Qiu et al. Citation2013), to name a few.
Substituting S2-1 has not yet become popular in China. Only a few documents refer to it: one for the flow duration curve (Huang Citation2007) and the others for the load duration curve for predicting water pollution load (Zhang et al. Citation2011) and sediment load (Li et al. Citation2012). Substituting S2-2 is very popular; there have been many documents/articles about the regional synthesis of runoff (Wu et al. Citation1983) and, specifically, low flow (Li et al. Citation1997). A general relationship between precipitation, runoff and evapotranspiration was deduced based on gauged information (Liu Citation1986), from which some information for ungauged basins can be read. One of the earliest hydrological models used for synthesis was the Rational model for the estimation of small-watershed peak flow (Research Group of Small-watershed Peak Flow Estimation Citation1978; Liu and Wang Citation1980). In the model, peak flow can be determined by parameters such as catchment area, maximum rainfall in an hour, channel parameter, land surface parameter, and loss coefficients R and r1 which are related to soil. As these parameters were measured from a number of small experimental catchments with various physiographic factors that covered a wide range of conditions in China, the method has been widely used for railway design in Northwest China and for hydraulic engineering design in other regions. The Application of the Rational model should be done with caution for predicting snowmelt floods and in semi-arid and arid regions due to the variable contributing area, where there is vegetation, cultivation, wetlands, and over large areas generally. The other well-known hydrological models developed in China include the Xinanjiang model (Zhao Citation1984), the HydroInformatic Modelling System (HIMS, Liu et al. Citation2008a), and the DTVGM model (Xia et al. Citation2005). As calibration is needed to obtain some of the parameters of these models, their application for prediction in ungauged basins is limited because data for the calibration are sometimes not available. However, through transplanting of parameters (Liu et al. Citation2013), establishing relationships with precipitation (Zhang et al. Citation2009) and decreasing the number of the parameters to be calibrated (Qin et al. Citation2009), they are finding more and more applications in ungauged basins.
China has made obvious progress in using Substituting S3 methods, such as in using tree rings to reconstruct streamflow (Gou et al. Citation2007, Yuan et al. Citation2007). Wang et al. (Citation1999) reconstructed the streamflow of Yellow River from 1470 onwards based on historical records. As more and more advanced reconstruction techniques are used (Brázdil and Kundzewicz Citation2006), China, a big country with a long history, will make greater contributions to historical hydrology, providing more proxy data for PUB.
As shown in , Western China, which includes deserts, the Qinghai-Tibet Plateau and the Loess Plateau, is the most data-scarce region in China. There, the conditions for data borrowing and substituting are poor. Therefore, from the early 1960s, in order to provide information on runoff formation and routing for bridge and culvert design for the Western China railroad construction, many field and indoor rainfall–runoff experiments were conducted (Research Group of Small-watershed Peak Flow Estimation Citation1978). Recently, Wang et al. (Citation2009) conducted an investigation of spatial variations in precipitation in the upper catchment of the Heihe River on the northern slopes of the central Qi-Lian Mountains. They found that summer precipitation displayed a decreasing trend from east to west at intermediate altitude, with a rate of approx. 80 mm per 100 km. The zone of maximum precipitation was at 4500 to 4700 m a.s.l. (where annual precipitation is 485 mm), which coincides with the zone of maximum relative humidity (above 4400 m a.s.l., with a central height of 4600 m a.s.l.) and the height of the 0°C isotherm in summer (about 4680 m a.s.l.). This kind of knowledge generated from field experiments assists precipitation prediction in ungauged mountainous basins.
Although basins in Western China are largely ungauged, it is the source area of substantial water resources. A national hydraulic engineering project has been considered to transfer water from south to north via the western route (Liu et al. Citation2008b). One of the important questions to consider is how much water should be kept within the river channels to maintain the basic ecological function of the donating rivers. The determination of this minimum ecological instream flow requirement, or environmental flow, requires hydrological data. To overcome the data scarcity, a series of interdisciplinary field experiments between hydrology and ecology was conducted. Based on these experiments, several new methods were proposed to estimate environmental flow, as reviewed by Liu et al. (Citation2008b). These methods included the Hydraulic Radius (HR) method, the LiHaFloVa method, the Analytical Wetted Perimeter (AWP) method and the principle of scaling. Establishing the relationship between life habitat and flow regimes provides a scientific basis for impact assessment of such large, national hydraulic engineering projects.
DISCUSSION
Advantages of BSG categorization
There are several obvious advantages to the simple BSG categorization of PUB methodology. First it is simple and easily understood. It is easy to get to know which methods are popular and, most importantly, it aids idenitification of new development points for PUB and beyond. Although the PUB Decade has ended, PUB work never stops. With the simple categorization it is easy to find ways to keep going, such as S1 and S2-2, and to see what needs to be strengthened, such as S3 and G.
Second, by dividing the method of the process-based modelling into Substituting S1, i.e. fully process-based models without calibration, and Substituting S2-2, i.e. other process-based models in need of calibration that include statistical mathematical models between hydrological elements and climate/catchment characteristics, one avoids the confusion that regression is the only prevailing method in PUB.
Third, the categorization is applicable to all hydrological elements (HEs), including snow, soil moisture, groundwater table, evapotranspiration, soil water content, etc., besides runoff. For each HE, this includes annual HE, seasonal HE, distribution of HE (duration curve and quantile), the hydrograph and its characteristics (peak, low flow, time to peak, flood volume, low or high flow of a given return period). Therefore, our category has been extended to all the hydrological elements besides runoff.
Limitations of the BSG categorization and analysis
In Blöschl et al. (Citation2013), the index method originally belonged to the statistical method group and the derived distribution method belonged to process-based methods. In the BSG categorization, we combine these into one method: S2-1. Other more suitable categories for these two methods may be suggested in the future.
Uncertainty is an important topic in PUB. Predicting the response of hydrological processes to climate change and other changes is another kind of prediction for ungauged basins (no data for the future or for the change). However, as this paper only targets the work that has found real application in ungauged basins, the statistics we did based on the literature reviews did not include articles focused on uncertainty and climate change.
There is uncertainty regarding the analysis based on data collection from the references. They are not inclusive, and mostly focus only on the real applications in ungauged basins. There are still large amounts of related work that have not been analysed at present.
Lastly, although the methods of PUB can be divided into the three BSG categories, it often happens that people use two, or three or more methods in combination for better hydrological prediction for ungauged basins. So the categories do not imply exclusive use, but are for displaying their relationships.
Progressing from PUB to Panta Rhei under the BSG framework
The new Scientific Decade 2013–2022 of IAHS, “Panta Rhei—Everything Flows”, was initiated in 2013. It refers to the famous statement attributed to Heraclitus (535–475 BC, Plato, Cratylus, 339–340). Standing by rivers at the same time as Heraclitus, Confucius (551–479 BC) left a similar famous statement in history: “子在川上曰 : 逝者如斯夫 !” (The Master standing by a stream, said, “It passes on just like this, not ceasing day or night!”) (Confucius, Confucian Analects or 论语). Changes in hydrology and society are the focus of hydrological research in the next decade. How will we progress from PUB to Panta Rhei? The BSG framework provides some hints.
Following S1 and G methodologies will lead to improved understanding and interpretation of, and innovative theoretical blueprints for, the representation of processes governing the water cycle by focusing on their changing dynamics in connection with rapidly changing human systems. In the PUB field at present, there are more skills than theories, implying that predictions rely largely on empirical relationships. In the Panta Rhei Decade, it is necessary to synthesize PUB-related research results to establish some general laws; the field and laboratory experimentation needs to be strengthened. First-hand data from experiments are always the key for interpretation and understanding. To understand the entire hydrological cycle, not only discharge, but all hydrological elements need to be predicted. In addition to the quantification of the hydrological elements, their quality, their patterns of variation and transfer processes should also be taken into account.
With the S2 and B methodologies, data analysis techniques will be advanced. Using G methods, monitoring will be advanced. With hydrological observation networks, geographical information systems, remote sensing and process-based models, it is much easier to draw isoline maps for prediction for an ungauged basin. With the S3 methods, interdisciplinarity will be sought by increased efforts to connect with the socio-economic sciences and geosciences in general.
If PUB stands for the prediction in ungauged basins under the BSG framework, Panta Rhei will make efforts to improve our capability in predicting water resources dynamics to support sustainable societal development in a changing environment and also be able to follow BSG. Uncertainty analysis is important for both PUB and Panta Rhei. Perhaps, the important next step is how to make the models’ uncertainty smaller so that they can be used for better, reliable prediction. Regarding the response to climate change, with more and more doubt as to its real impacts on hydrological processes (Roderick and Farquhar Citation2002, Koutsoyiannis et al. Citation2009), it is important to provide evidence to identify the real responses. At present, the confidence in most studies is acquired only from the validation of the model based on current data.
Finally, finding more applications for PUB research results is a direct step from PUB to Panta Rhei. To date, PUB has made great strides in research. With the end of the PUB Decade and the commencement of Panta Rhei, PUB investigators must consider how these results may be applied to solve actual societal problems. The memory is still fresh of the severe mud-flow disaster, which occurred in an ungauged basin in Zhouqu, Gansu, China in 2010 and brought serious losses downstream. The more recent disaster due to the strong storm over Beijing on 21 July 2012 is a reminder that PUB is not only for remote and less populated rural areas, but also for the densly populated urban areas, where observations and predictions cannot keep pace with the rapid change due to much human activity. Hence, enhancing early warning capabilities in the face of sudden disaster is one of the most important roles hydrological research should play. There are a few cases of application of PUB to practical problem solving in China, such as Zhao et al. (Citation2011) using a fully process-based model and remote sensing to predict the floods after the Wenchuan Earthquake, and Li et al. (Citation2008) who employed analytical hydraulic solutions with field surveying to predict flood disaster in Northeast China.
CONCLUSIONS
A simple categorization of the methods used for Predictions in Ungauged Basins (PUB) is proposed: Borrowing, Substituting and Generating, abbreviated as BSG. The Borrowing (B) method is defined as obtaining hydrological information by transplanting measurements from a similar basin, or extrapolating and/or interpolating the data from neighboring catchments. The Substituting (S) method is defined as finding substitutes either from the ungauged area or from donating area(s). It is subdivided into Substituting S1, Substituting S2-1, Substituting S2-2 and Substituting S3; S1 refers to using fully process-based models mostly without calibration, and finding substitutes only within the ungauged basin; S2-1 and S2-2 refer to finding the substitutes from both the ungauged basin and gauged basins. The information from gauged basins is used to calibrate the model structure and parameters relating the climate/catchment features and hydrological signatures. The difference between S2-1 and S2-2 is that the models in S2-1 must be established within a region in which all the hydrological basins are similar, while for S2-2 the gauged basins used to establish the model must be widely representative, and thus as dissimilar as possible. Both S1 and S2 find some normal substitutes from the relationship between climate/catchment features and hydrological signatures, but method S3 is to find some special substitutes beyond the relationship, such as from tree rings, or other geophysical factors. The Generating (G) method is defined as obtaining data via field or laboratory observations.
Comparison is made between the BSG categorization and the prevailing methodological framework summarized by Blöschl et al. (2013). Using BSG, by reference to the advances of PUB worldwide cited in Blöschl et al. (Citation2013), and reviewing the PUB advances made in China referred to in documents published in both English and Chinese, several observations can be made. First, it is found that the regression method (S2-2) was the number one method for PUB both before the PUB Decade and during/after it; this finding corresponds to the dominant role that the Darwinian pathway plays in PUB, a conclusion drawn by Blöschl et al. (Citation2013). Second, it is interesting to see that developing fully process-based eco-hydrological distributed models for PUB (S1) is another ‘hot topic’ (besides S2-2) with the efficient help of remote sensing and GIS for parameter determination. The continuing parallel development along Darwinian and Newtonian pathways is the new recognition acquired with the simple BSG categorization proposed in this paper. Third, these two mainstreams of the PUB Decade (2003–2012) provide progress to Panta Rhei, the new IAHS Decade (2013–2022), for conducting activities, as described in Montanari et al. (Citation2013), such as “new modelling philosophies and approaches for hydrological systems in close connection with human activities” through S1, “analysis of the co-evolution of hydrological processes and catchment signatures, ecosystems and social systems” through S2-2 and S2-1. Finally, the relatively weaker methods of PUB will be strengthened through “developing new measurement techniques to constrain uncertainty in closure of the mass balance that is fundamental to improved process understanding;” and “theoretical and experimental analysis of hydrological processes and their links with and feedbacks to connected systems, assessment of their behavioral determinants, intrinsic dynamics and indeterminacy;” via G, and through “reconstruction of past conditions and climate (historical hydrology);” via S3 in Panta Rhei.
Funding
This study was jointly supported by 973 Basic Research Project (2012CB957802), Key Project for the Strategic Science Plan in IGSNRR CAS (2012ZD003) and NSFC (41071024).
Acknowledgements
Many thanks for the encouragement and pertinent comments are due to the Co-editor Z.W. Kundzewicz, and the reviewers, as well as Cate Gardner and Frances Watkins, IAHS and Kerenza Kerslake, Production Editor, Taylor & Francis. English editing in the early version of the manuscript by Marilyn Pomeroy is greatly appreciated.
REFERENCES
- Bart, R. and Hope, A., 2010. Streamflow response to fire in large catchments of a Mediterranean-climate region using paired-catchment experiments. Journal of Hydrology, 388 (3–4), 370–378. doi:10.1016/j.jhydrol.2010.05.016.
- Blöschl, G., et al., eds., 2013. Runoff prediction in ungauged basins: synthesis across processes, places and scales. Cambridge: Cambridge University Press.
- Blöschl, G. and Merz, R., 2008. Thoughts on a process-based catchment classification. Geophysical Research Abstracts, 10, EGU2008-A–08153.
- Blöschl, G. and Merz, R., 2010. Landform-hydrology feedbacks. In: J.-C. Otto and R. Dikao, eds. Landform: structure, evolution, processes control. Wien: Springer, 117–126.
- Brázdil, R. and Kundzewicz, Z.W., 2006. Historical hydrology. Editorial. Hydrological Sciences Journal, 51 (5), 733–738. Available from: http://www.tandfonline.com/doi/abs/10.1623/hysj.51.5.733.
- Chen, J.L., et al., 2013. Rapid ice melting drives Earth’s pole to the east. Geophysical Research Letters, 40, 2625–2630. doi:10.1002/grl.50552.
- Chokmani, K. and Ouarda, T.B.M.J., 2004. Physiographical space-based kriging for regional flood frequency estimation at ungauged sites. Water Resources Research, 40 (12), 1–13. doi:10.1029/2003WR002983.
- Ding, Y. and Xie, Z., 1991. A simple method on estimating glacial mass balance. Journal of Glaciology and Geocryology, 13 (3), 213–218. (In Chinese with English Abstract.)
- Fan, Z., et al., 2011. Spatial change trends of temperature and precipitation in China. Journal of Geoinformatic Science, 13 (4), 526–533. doi:10.3724/SP.J.1047.2011.00526.
- Falkenmark, M. and Chapman, T., 1989. Comparative hydrology—an ecological approach to land and water resources. Paris: UNESCO.
- Fernandez, W., Vogel, R.M., and Sankarasubramanian, A., 2000. Regional calibration of a watershed model. Hydrological Sciences Journal, 45 (5), 689–707. doi:10.1080/02626660009492371.
- Freeze, R.A. and Harlan, R.L., 1969. Blueprint for a physically-based, digitally-simulated hydrologic response model. Journal of Hydrology, 9, 237–258. doi:10.1016/0022-1694(69)90020-1.
- Guo, S., et al., 2002. A macro – scale and semi-distributed monthly water balance model to predict climate change impacts in China. Journal of Hydrology, 268 (1–4), 1–15. doi:10.1016/S0022-1694(02)00075-6.
- Gou, X., et al., 2007. Streamflow variations of the Yellow River over the past 593 years in western China reconstructed from tree rings. Water Resources Research, 43, doi:10.1029/2006WR005705.
- Guo, J. and Tang, Q., 1980. Preliminary study on the dynamic type and classification to Chinese rivers. Geography Journal, 12, 30–36. (In Chinese with English Abstract.)
- Granger, R.J. and Pomeroy, J.W., 1997. Sustainability of the western Canadian boreal forest under changing hydrological conditions. II. Summer energy and water use. In: D. Rosbjerg, et al., eds. Sustainability of water resources under increasing uncertainty. Wallingford: International Association of Hydrological Sciences, IAHS Publ. 240, 243–250.
- Hrachowitz, M., et al., 2013. A decade of Predictions in Ungauged Basins (PUB)—a review. Hydrological Sciences Journal, 58 (6), 1198–1255. http://www.tandfonline.com/doi/full/10.1080/02626667.2013.803183
- Huang, G., 2007. Daily flow hydrograph simulation using regional flow duration curves for ungauged region of Dongjiang basin. Journal of Hydroelectric Engineering, 26 (4), 758-764. (In Chinese with English Abstract.)
- Jia, Y., et al., 2009. Predicting inflows to barrier lakes formed in the Wenchuan earthquake using the WEP model and TRMM-based rain. In: W. Xu, T. Ao, and X. Zhang, eds. Hydrological modelling and integrated water resources management in ungauged mountainous watersheds. Wallingford: International Association of Hydrological Sciences, IAHS Publ. 335, 42–50.
- Koutsoyiannis, D., et al., 2009. Climate, hydrology and freshwater: towards an interactive incorporation of hydrological experience into climate research. Hydrological Sciences Journal, 54 (2), 394–405. doi:10.1623/hysj.54.2.394.
- Kumar, P., 2011. Typology of hydrologic predictability. Water Resources Research, 47. doi:10.1029/2010WR009769.
- Li, Q., 1998. Analysis and discussion related to the hydrological watershed models used in the first hydrological forecasting technology competition of China. Advances in Water Science, 9 (2), 191–195. (In Chinese with English Abstract.)
- Li, H., et al., 2012. Estimating sediment flux in the Xinjiang River based on the load duration curve method. China Rural Water and Hydropower, 11, 13-20. (In Chinese with English Abstract.)
- Li, X., Cao, C., and Chang, C., 2006. The first law of geography and spatial-temporal proximity. Journal of Nature, 29 (2), 69-71. (In Chinese with English Abstract.)
- Li, C., Lu, J., and Ye, B., 2008. 2-D hybrid approach to storm flood modelling in the Shalan catchment. In: D. Yang, et al., eds., Hydrological research in China: process studies, modelling approaches and applications. Wallingford: International Association of Hydrological Sciences, IAHS Publ. 322, 186–192.
- Li, H. and Shen, J., 1996. Research on the estimation of parameters of inverse Gaussian distribution model for ungauged basin. Journal of Xi an University of Technology, 12 (3), 195–199. (In Chinese with abstract in English.)
- Li, X., Zhang, C., and Fu, S., 1997. The application of geoscience analysis of remote sensing on the regional parameters about runoff of low water of river. Remote Sensing Technology and Application, 12 (3), 17–22. (In Chinese with English Abstract.)
- Liang, Z., et al., 2008. A statistically-based runoff-yield model. In: D. Yang, et al., eds. Hydrological research in China: process studies, modelling approaches and applications. Wallingford: International Association of Hydrological Sciences, IAHS Publ. 322, 88–94.
- Liu, C., 1986. The analysis to the water balance and water storage of China. In: The Proceeding of the third national hydrological conference of China. Beijing: Chinese Geographic Society. Science Press. (In Chinese.)
- Liu, C., et al., 2008a. Development of hydro-informatic modelling system and its application. Science in China Series E: Technological Sciences, 51 (4), 456–466. doi:10.1007/s11431-008-0040-x.
- Liu, C., et al., 2013. Estimating the runoff for data scarce basins based on HIMS model. South-to-North Water Transfers and Water Science & Technology, 1, 1–8. (In Chinese with English Abstract.)
- Liu, S., et al., 2001. Spatial variation of soil moisture in China: geostatistical characterization. Journal of the Meteorological Society of Japan, 79 (1B), 555–574. doi:10.2151/jmsj.79.555.
- Liu, S., et al., 2004. The effects of bushfires on hydrological processes using a paired-catchment analysis. Meteorology and Atmospheric Physics, 86, 31–44. doi:10.1007/s00703-003-0614-x.
- Liu, S., et al., 2008b. Environmental flow in China. GWSP Newsletter, 7, 9–11.
- Liu, S., et al., 2009. Temporal variation of soil moisture over the Wuding River Basin assessed with an eco-hydrological model, in-situ observations and remote sensing. Hydrology and Earth System Sciences, 13, 1375–1398. doi:10.5194/hess-13-1375-2009.
- Liu, S., Liu, C., and Zhao, W., 2010. Towards the methodology for Predictions in Ungauged Basins. Progress in Geography, 29 (11), 1333–1339. (In Chinese with English Abstract.)
- Liu, C.M. and Wang, G.T., 1980. The estimation of small-watershed peak flows in China. Water Resources Research, 16 (5), 881–886. doi:10.1029/WR016i005p00881.
- Liu, S., Xia, J., and Mo, X., 2005. Advances in Predictions in Ungauged Basins. Water Resources and Hydropower Engineering, 36 (2), 9–12. (In Chinese with English Abstract.)
- Liu, C., Zeng, Y., and Qiu, X., 2004. The Hydrometeorology atlas of Yellow River. Zhengzhou: Yellow River Water Resource Press, 94. (In Chinese with English Abstract.)
- Lv, H., Zhu, Y., and Yu, Z., 2008. Estimating unsaturated soil hydraulic parameters using a generalized Richards equation. In: D. Yang, et al., eds. Hydrological research in China: process studies, modelling approaches and applications. Wallingford: International Association of Hydrological Sciences, IAHS Publ. 322, 22–27.
- McDonnell, J.J. and Woods, R., 2004. Editorial: on the need for catchment classification. Journal of Hydrology, 299 (1–2), 2–3. doi:10.1016/j.jhydrol.2004.09.003.
- Micovic, Z. and Quick, M.C., 1999. A rainfall and snowmelt runoff modelling approach to flow estimation at ungauged sites in British Columbia. Journal of Hydrology, 226 (1–2), 101–120. doi:10.1016/S0022-1694(99)00172-9.
- Ministry of Water Resources of China, 2002. China National Water Resources Standard SL 77–94. (In Chinese.)
- Mo, X., et al., 2005. Prediction of crop yield, water consumption and water use efficiency with a SVAT-crop growth model using remotely sensed data on the North China Plain. Ecological Modelling, 183, 301–322. doi:10.1016/j.ecolmodel.2004.07.032.
- Mo, X. and Liu, S., 2001. Simulating evapotranspiration and photosynthesis of winter wheat over the growing season. Agricultural and Forest Meteorology, 109, 203–222. doi:10.1016/S0168-1923(01)00266-0.
- Mo, X., Liu, S., and Lin, Z., 2012. Evaluation of an ecosystem model for a wheat–maize double cropping system over the North China Plain. Environmental Modelling & Software, 32, 61–73. doi:10.1016/j.envsoft.2011.07.002.
- Montanari, A., et al., 2013. “Panta Rhei—everything flows”: change in hydrology and society—the IAHS scientific decade 2013–2022. Hydrological Sciences Journal, 58 (6), 1256–1275. doi:10.1080/02626667.2013.809088.
- Pan, H., et al., 2012. Study of rainfall threshold of debris flow forewarning in data lack areas. Rock and Soil Mechanics, 33 (7), 2122–2226. (In Chinese with English Abstract.)
- Pomeroy, J.W., Whitfield, P., and Spence, C., eds., 2013. Putting Prediction in Ungauged Basins into practice. Ottawa: Canadian Water Resources Association.
- Qiu, L., et al., 2013. Simulation of snowmelt runoff in the Lhasa River Basin by MODIS and SRM. Journal of Beijing Normal University (Natural science), 49 (2/3), 152–156. (In Chinese with English Abstract.)
- Qin, G., Wang, S., and Miu, R., 2009. Real-time flood forecasting with the use of corresponding rising difference model. In: W. Xu, T. Ao, and X. Zhang, eds. Hydrological modelling and integrated water resources management in ungauged mountainous watersheds. Wallingford: International Association of Hydrological Sciences, IAHS Publ. 335, 122–129.
- Reed, S., Koren, V., Smith, M., and DMIP participants, 2004. Overall distributed model intercomparison project results. Journal of Hydrology, 298, 27–60. doi:10.1016/j.jhydrol.2004.03.031.
- Research Group of Small-watershed Peak Flow Estimation, 1978. The estimation of small-watershed peak flow. Beijing: Science Press. (In Chinese.)
- Roderick, M.L. and Farquhar, G.D., 2002. The cause of decreased pan evaporation over the past 50 years. Science, 298, 1410–1411. doi:10.1126/science.1075390.
- Schaake, J., et al., 2006. The model parameter estimation experiment (MOPEX). Journal of Hydrology, 320, 1–2. doi:10.1016/j.jhydrol.2005.07.054.
- Schreider, S.Y., et al., 2002. Prediction of monthly discharge in ungauged catchments under agricultural land use in the Upper Ping basin, Northern Thailand. Mathematics and Computers in Simulation, 59 (1–3), 19–33. doi:10.1016/S0378-4754(01)00390-1.
- Shi, P., et al., 2008. Computation of grid storage capacity from topographic index in hydrological modeling. In: D. Yang, et al., eds. Hydrological research in China: process studies, modelling approaches and applications. Wallingford: International Association of Hydrological Sciences, IAHS Publ. 322, 28–32.
- Shu, C., et al., 2010. The simulation of hydrological processes in an ungauged alpine basin by using Xinanjiang model. Journal of Ecology and Natural Resources, 1 (2), 186–192.
- Sivapalan, M., et al., 2003. IAHS Decade on Predictions in Ungauged Basins (PUB), 2003–2012: shaping an exciting future for the hydrological sciences. Hydrological Sciences Journal, 48 (6), 857–880. doi:10.1623/hysj.48.6.857.51421.
- Sivapalan, M., et al., 2005. Linking flood frequency to long-term water balance: incorporating effects of seasonality. Water Resources Research, 41, W06012. doi:10.1029/2004WR003439.
- Sivapalan, M., et al., 2011. Water cycle dynamics in a changing environment: improving predictability through synthesis. Water Resources Research, 47, W00J01. doi:10.1029/2011WR011377.
- Skøien, J.O., Merz, R., and Blöschl, G., 2006. Top-kriging - geostatistics on stream networks. Hydrology and Earth System Sciences, 10 (2), 277–287. doi:10.5194/hess-10-277-2006.
- Sun, Y., et al., 2009. A study on calibration of the Nash model parameters in no-data or scarce-data regions. In: W. Xu, T. Ao, and X. Zhang, eds. Hydrological modelling and integrated water resources management in ungauged mountainous watersheds. Wallingford: International Association of Hydrological Sciences, IAHS Publ. 335, 3–8.
- Thompson, J.N., 1994. The coevolutionary process. Chicago: University of Chicago Press.
- Vanclay, J.K., 2009. Managing water use from forest plantations. Forest Ecology and Management, 257 (2), 385–389. doi:10.1016/j.foreco.2008.09.003.
- Wagener, T., et al., 2010. The future of hydrology: an evolving science for a changing world. Water Resources Research, 46, W05301. doi:10.1029/2009WR008906.
- Wang, G., et al., 1999. Natural annual runoff estimation from 1470 to 1918 for Sanmenxia Gauge Station of Yellow River. Advances in Water Science, 10 (2), 170–176. (In Chinese with English Abstract.)
- Wang, N., et al., 2009. Study on the zone of maximum precipitation in the North Slopes of the Central Qilian Mountains. Journal of Glaciology and Geocryology, 31 (3), 395–403. (In Chinese with English Abstract.)
- Wang, S. and Liu, S., 2013. Exploring the relationship between polar motion and a primitive river’s runoffbased on Granger causality. In: A. Gelfan, et al., eds. Cold and mountain region hydrological systems under climate change: towards improved projections. Wallingford: International Association of Hydrological Sciences, IAHS Publ. 360, 131–138.
- Wen, Y., et al., 2011. Flow influence line and its application in bridge flood forecast. Journal of China Raiway Society, 33 (6), 99–102. (In Chinese with English Abstract.)
- Woo, M. and Liu, C.M., 1994. Mountain hydrology of Canada and China: a case study in comparative hydrology. Hydrological Processes, 8 (6), 573–587. doi:10.1002/hyp.3360080608.
- Wu, K., Liu, C., and Wang, G., 1983. Analysis of hydrological characteristics of the rivers in the riverhead area of the Yangtze River. Geographical Research, 2 (2), 72–81. (In Chinese with English Abstract.)
- Xia, J., et al., 2005. Development of distributed time-variant gain model for nonlinear hydrological systems. Science in China Series D: Earth Sciences, 48 (6), 713–723.
- Xu, W.L., Ao, T.Q., and Zhang, X.H., eds., 2009. Hydrological modelling and integrated water resources management in ungauged mountainous watersheds. Wallingford: International Association of Hydrological Sciences, IAHS Publ. 335, 310.
- Yang, D., et al., eds., 2008. Hydrological research in China: process studies, modelling approaches and applications. Wallingford: International Association of Hydrological Sciences, IAHS Publ. 322, 262.
- Yang, D. and Shao, W., 2008. Analysis of water resources variability in the Yellow River of China using a distributed hydrological model. In: D. Yang, et al., eds., Hydrological research in China: process studies, modelling approaches and applications. Wallingford: International Association of Hydrological Sciences, IAHS Publ. 322, 228–233.
- Yang, J., 1999. Some technical problem of runoff design for small-watersheds without data. Hydrology, 6, 26–29. (In Chinese with English Abstract.)
- Young, A.R., 2006. Stream flow simulation within UK ungauged catchments using a daily rainfall-runoff model. Journal of Hydrology, 320 (1–2), 155–172. doi:10.1016/j.jhydrol.2005.07.017.
- Yuan, Y., et al., 2007. The Potential to Reconstruct Manasi River Streamflow in the Northern Tien Shan Mountains (NW China). Tree-Ring Research, 63 (2), 81–93. doi:10.3959/1536-1098-63.2.81.
- Zhan, C. and Xia, J., 2010. The tempo-spatial pattern of terrestrial evapotranspiration over China based on remote sensing. Beijing: Knowledge Copyright Press, 189. (In Chinese with English Abstract.)
- Zhang, X., et al., 2009. A unit hydrograph model with spatial variations of rainfall based on an artificial neural network. In: W. Xu, T. Ao, and X. Zhang, eds. Hydrological modelling and integrated water resources management in ungauged mountainous watersheds. Wallingford: International Association of Hydrological Sciences, IAHS Publ. 335, 116–121.
- Zhang, X., et al., 2011. Study on allocation methods of the water pollutant loads in ungauged basin. Journal of China Institute of Water Resources and Hydropower Research, 9 (2), 136–142. (In Chinese with English Abstract.)
- Zhao, R., 1984. Catchment hydrological simulation-Xinanjiang model and Shaanbei Model. Beijing: China Water Power Press. (In Chinese.)
- Zhao, Z., et al., 2011. Predicting inflows to Tangjiashan barrier lake based on WEP model and TRMM precipitation data. Shuili Xuebao, 42 (7), 848–856. (In Chinese with English Abstract.)
- Zhu, Y., et al., 2010. Hydrodynamic modeling in ungauged rivers: a case study in the Wei River. Journal of Beijing Normal University (Natural Science), 46 (3), 378–382. (In Chinese with English Abstract.)