
Abstract
The Hai River Basin (HRB) is a heavily irrigated region encompassing the North China Plain (NCP) in northeast China. In the last decades, continuous lowering of groundwater levels had been reported in the NCP. This study used data from the Gravity Recovery and Climate Experiment (GRACE) and in situ measurements to quantify recent changes in groundwater storage from 2003 to 2012. The signal from GRACE observations highlight a sharp decline in the deep subsurface water stores (deep unsaturated zone and groundwater systems) up to a rate of 17.0 ± 4.3 mm year-1 between 2003 and 2012 over the HRB, equal to a volumetric loss of 5.5 ± 1.4 km3 year-1. This result shows good consistency with in situ observations of groundwater hydraulic heads compiled from monitoring bores, and emphasizes GRACE’s ability to monitor large-scale groundwater storage variations. Results from GRACE also provide an independent assessment of the effectiveness of water saving programmes that have been implemented by the government so far. Our study indicates that groundwater overdrawal is still prevalent and the dominant factor for the persistent loss in groundwater storage over the HRB/NCP; the current groundwater consumption pattern is far beyond the natural recharge ability in groundwater system.
Editor D. Koutsoyiannis; Associate editor T. Wagener
Résumé
Le bassin de la rivière Hai (BRH) est une région pratiquant une irrigation intensive et qui englobe la plaine de Chine du Nord (PCN) dans le Nord-Est de la Chine. Au cours des dernières décennies, une baisse continue du niveau des eaux souterraines a été observée dans la PNC. La présente étude utilise des données de « Gravity Recovery and Climate Experiment” (GRACE) et des mesures in situ pour quantifier les modifications du stock d’eau souterraine de 2003 à 2012. Le signal GRACE met en évidence une forte baisse dans les couches profondes d’eau souterraine (zone non saturée profonde et aquifères) allant jusqu’à un taux de 17,0 ± 4,3 mm an-1 entre 2003 et 2012 sur le BRH, correspondant à une perte volumétrique de 5,5 ± 1,4 km3 an-1. Ce résultat est cohérent avec les observations piézométriques in situ compilées à partir des forages de surveillance, et souligne la capacité de GRACE à suivre des variations du stockage d’eau souterraine à grande échelle. Les résultats de GRACE fournissent également une évaluation indépendante de l’efficacité des programmes d’économie d’eau qui ont été mis en œuvre par le gouvernement jusqu’à présent. Notre étude indique que la surexploitation des eaux souterraines est encore un phénomène répandu et qu’il constitue la cause principale de l’érosion persistante du stock d’eaux souterraines sur le BRH/PCN. Le modèle actuel de prélèvement des eaux souterraines est bien au-delà de la capacité de recharge naturelle des aquifères.
1 INTRODUCTION
One third of the global freshwater withdrawals are from groundwater (Döll et al. Citation2012). Faced with the increasing pressures from population growth and increased irrigation, many aquifers worldwide have been over-exploited since the second half of the 20th century. Globally, groundwater depletion rates have increased from approx. 126 (±32) km3 year-1 in 1960 to ~283 (± 40) km3 year-1 in 2000 (Wada et al. Citation2010). Arid and semi-arid areas, where groundwater is the main source of water supply and aquifers have low natural recharge rates, are particularly affected by this phenomenon (Scanlon et al. Citation2006, Döll et al. Citation2012). Semi-arid regions in which extensive groundwater depletion has been reported include northwest India, the Middle East, northeastern China and North America (Konikow and Kendy Citation2005, Wada et al. Citation2010, Gleeson et al. Citation2012).
Quantifying groundwater depletion rates is essential to manage the resource, though it can be difficult, particularly at the regional scale. Wada et al. (Citation2010) compared abstraction rates from national statistics with simulated groundwater recharge from a hydrological model to estimate global groundwater depletion rates. However, groundwater monitoring networks are usually sparse, national statistics are not always up to date and hydrological models often ignore the complexity of many hydrological processes such as localized recharge via ponding and irrigation. The satellite Gravity Recovery and Climate Experiment (GRACE), aimed at measuring the mass redistribution on and under the Earth’s surface, allows us to independently quantify regional changes in groundwater storage. For example, GRACE observations were used by Rodell et al. (Citation2009) to estimate a groundwater depletion rate of 17.7 (±4.5) km3 year-1 between 2002 and 2008 in northwest India. In the Murray Darling Basin, Australia, a groundwater loss of approx. 22.4 km3 year-1 was detected using GRACE data during the peak (2003–2007) of the Millennium drought (Leblanc et al. Citation2009). Strassberg et al. (Citation2009) demonstrated the value of GRACE in monitoring changes in groundwater storage over large regions of interest subject to intense irrigation.
The Hai River Basin (HRB) encompasses the North China Plain (NCP); China’s socio-economic centre, and also one of the most important ‘food bowls’ of China for the production of more than half of the nation’s wheat and a third of its maize. Despite this, the NCP only takes up around 5% of the total water resources in the country, resulting in very low water availability per capita (approx. 300 m3 year-1 per capita; Yang and Zehnde Citation2001; Zhang et al. Citation2011), which is significantly lower than the international recommended threshold (1700 m3 year-1 per capita; Falkenmark and Widstrand Citation1992). In the HRB, growth in agriculture, urbanization and industrialization during recent decades has been heavily supported by groundwater. Aquifer depletion and land subsidence are particularly marked in the NCP (Fei et al. Citation2009, Ge et al. Citation2009). In 2003, the total annual water consumption in the NCP reached 30 km3, of which 69.5% came from groundwater (Zhang et al. Citation2009).
Several researchers have applied GRACE to detect excessive groundwater extraction in China. Zhong et al. (Citation2009) used RL04 GRACE gravity data, mapping the gravity field change across the whole of China. They found Jing-Jin-Ji region (covering Beijing, Tianjin and Hebei Province) was among the four regions within China that had remarkable mass change during the period 2003–2007; the rate of total mass change was estimated as –24 mm year-1. Moiwo et al. (Citation2009) studied the residuals of ΔTWS – ΔSM (i.e. terrestrial water storage anomalies minus soil moisture anomalies, representing groundwater storage change) from GRACE over the HRB, and compared GRACE estimates with the groundwater monitoring network. They indicated an approximate groundwater loss of 13–24 mm year-1 across the HRB during the period 2003–2006. In a recent study, Feng et al. (Citation2013) studied north China using GRACE measurements. Their results emphasized that the issue of groundwater over-exploration is particularly strong in the NCP: the depletion rate in groundwater storage was estimated as 22 ± 3 mm year-1 from 2003 to 2010.
The aim of this paper is two-fold: (a) to independently assess groundwater storage changes in the HRB over the last decades from in situ and satellite observations; and (b) to consider the compounding influences from climate variability, water demand and water governance.
2 THE STUDY AREA
2.1 Location, climate and agriculture
The Hai River Basin, located in northeast China, covers an area of approx. 320 000 km2 (). This large basin includes the Beijing and Tianjin municipalities, the majority of Hebei Province, one third of Shanxi Province (lying to the west), 20% of Shandong and 15% of Henan provinces, as well as some small parts of Liaoning and Nei Mongol provinces. The HRB can be generally divided into two parts: the mountainous regions to the west and north (Taihang Mountain, Yanshan Mountain and Shanxi tableland; taking up 60% of the total basin area) and the low lands to the southeast (the North China Plain; 40%). The HRB is dominated by semi-humid and semi-arid continental monsoon climate. The annual average precipitation between 1951 and 2012 was 531 mm year-1, with coastal regions experiencing 100–150 mm more rainfall per year compared to inland regions of the basin. Between 70 and 85% of the rainfall occurs during the summer months (June–August).
Fig. 1 Location of the study area: the Hai River Basin (HRB; black solid line), the North China Plain (NCP; dark blue solid line) and administrative provinces (gray solid line). The geomorphological regions, surface water reservoirs, soil moisture stations and monitoring bores are also demonstrated. A hydrogeological profile for the location of the cross-section (black dotted line) is shown in .
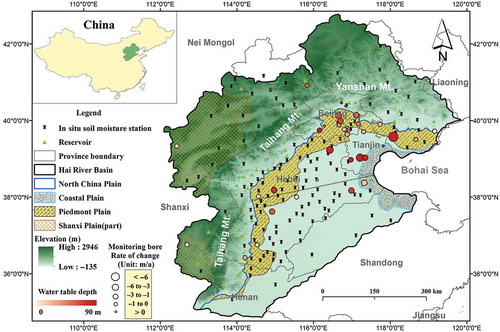
The HRB encompasses the North China Plain, which is the most populous region in China and the hub of the country’s economic activities. The NCP population is reported to have reached 133 million in 2009 (Zhang et al. Citation2011). Wheat and maize are the two major crops in the NCP, accounting for 90% of the cropland and 69% of the cultivated land (Yang et al. Citation2006a). The maize growth season synchronizes well with the rainy season; therefore, water needs are met chiefly by rainfall. In contrast, during the wheat growing season it is comparatively dry (October–May/June) and, therefore, 70–80% of its water requirements can only be met from irrigation (Liu et al. Citation2002). Over the plain, around 70% of the cultivated land is irrigated, and consumes more than 70% of the total NCP water allocation (Changming et al. Citation2001). shows the annual precipitation from 1951 to 2012 in the NCP. Although the NCP is relatively more humid (564 mm year-1, against 531 mm year-1 over the HRB, during 1951–2012), the climate is highly variable. On the decadal scale, the last three decades since 1981 represent an unusually dry period: mean annual rainfall for the period 1981–2010 is 48 mm below that observed during the 1951–1980 period.
Fig. 2 Precipitation in the study area: (a) annual and 10-year average precipitation in the NCP from 1951 to 2012, and long-term average for 1951–2012 for both HRB and NCP; (b) deviation of annual precipitation for 2003–2012 from the long-term average (50 years: 1951–2001) over the NCP and HRB. Data from the Global Precipitation Climatology Centre (GPCC).
2.2 Hydrogeological conditions
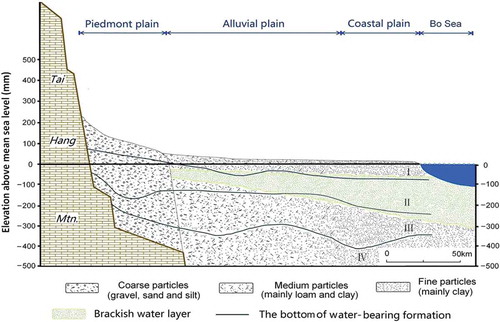
Groundwater resources in this mountainous region are limited to local and shallow aquifers. The hydrogeology of this region can be subdivided into three groups: aquitards, fractured aquifers in metamorphic and magmatic rocks and karst aquifers (UNESCO Hydrogeological Map of the World: http://www.whymap.org/). Being located in the NCP, the basin is characterized by Quaternary aquifers, and it has relatively good water bearing formations. The geomorphology can be divided into three types from west to east: the piedmont plain (adjacent to the Taihang and Yanshan mountains), the central alluvial plain (adjacent to the piedmont plain), and the coastal plain at the margin of the Bohai Sea (see ). The alluvial sediments of the piedmont plain are composed mainly of pebbles, gravel and sand. The high hydraulic conductivity of these sediments allows for high rates of (a) indirect groundwater recharge from the drainage network at the base of the mountains, and (b) direct recharge from rainfall across the plain, and therefore high sustainable yields for the shallow aquifers (Wang et al. Citation2008, Zhang et al. Citation2009). The hydraulic conductivity and recharge rates of the aquifers decrease with increasing distance from the piedmont plain to the coastal area (Foster et al. Citation2003).
Vertically, four main layers have been defined according to water use and hydrogeological characteristics (; Zhang et al. Citation2009). Formations I (10 to <50 m depth) and II (down to 210 m depth) are unconfined and semi-confined aquifers, respectively, perform a range of ecosystem services, and are used for irrigation. Formations III (down to 310 m) and IV (>310 m) are confined aquifers. Formation III is often used for domestic and industrial water supply (Zhang et al. Citation2009). Herein we refer to Formations I and II as the shallower aquifers, and Formations III and IV as the deeper aquifers.
Fig. 3 Hydrogeological profile across the NCP. Adapted from Foster et al. (Citation2003) with permission. The location of the cross-section is shown in .
2.3 Water resources
Several large river systems together with approximately 50 tributaries constitute the surface water system of the HRB. Most rivers originate from the mountain range and are harvested in a series of large reservoirs before reaching to the NCP. In 2007, 22 medium to large-scale reservoirs, with a total storage capacity of 19.2 km3, controlled 83.5% of the surface water redistribution in the mountains (Zhang et al. Citation2009). These surface water diversions have resulted in a large number of rivers within the NCP changing from perennial to intermittent; and some rivers have ceased to flow entirely. For example, Cangzhou is the downstream city of the Fuyang River and now receives only 10% of the annual river flow that it did in the 1970s (Lohmar et al. Citation2003). Similar to most major rivers across the Hebei Plain, since the 1980s the Yellow River has frequently dried up before reaching the ocean (Zhang et al. Citation2009).
As early as the 1970s, groundwater became the primary source of freshwater across the NCP. By 2003, groundwater resources supplied almost 70% of total water use, amongst which 85.7% (17.7 km3 year-1) was from the unconfined shallow aquifers and 14.3% (2.9 km3 year-1) from the confined deeper aquifers (Zhang et al. Citation2009; ). The groundwater extraction intensity across the NCP varies (Zhang et al. Citation2009). With the exception of the coastal plain region, shallow groundwater extraction exceeds 3 × 10⁴ m3 km-2 year-1) across the NCP. The most intensive areas of shallow groundwater extractions are in the piedmont alluvial plain (>25 × 104 m3 km-2 year-1). Deeper groundwater pumping mainly occurs in the central plain, ranging mostly between 1 × 10⁴ m3 km-2 year-1 and 3 × 10⁴ m3 km-2 year-1; groundwater pumping with intensities >5 × 10⁴ m3 km-2 year-1 only occurs across ~10% of the NCP (Zhang et al. Citation2009).
Table 1 Comparison of surface and groundwater use between HRB and NCP in 2003. Data are sourced from the Hai River Basin Water Resources Bulletin (Citation2003–2010) and Hai River Basin Groundwater Bulletin (Citation2010).
Over-extraction of groundwater has led to significant declines in the water table and potentiometric surface for both unconfined and confined aquifer systems (Zhang et al. Citation2009). Between 1959 and 2003, the shallow water table declined by 10–30 m in the piedmont plain, 5–10 m in the central plain, and up to 5 m in the coastal plain. For the deeper aquifer, the potentiometric surface dropped by up to 10–20 m in the piedmont plain, 20–40 m in the central plain, and up to 10–20 m in the coastal plain. In some extreme cases, such as Dezhou and Cangzhou, the potentiometric surface for the deep aquifer decreased by more than 50 m (Zhang et al. Citation2009).
3 DATA AND METHODS
The objective of this study is to gain independent and up-to-date estimates of change in groundwater storage using data from in situ measurements and the GRACE satellites. According to the water balance, change in terrestrial water storage (ΔTWS) observed by GRACE can be partitioned into the following mass changes in: surface water (SW), biomass (V), soil moisture (SM), snowpack and ice sheets (described as snow water equivalent (SWE)), and groundwater (GW). For a large groundwater basin, the variations in groundwater storage can thus be estimated as:
Inter-annual variations in biomass (ΔV) are generally insignificant compared to the other components (Rodell et al. Citation2005). The contribution from the snow water component is also very small. According to the simulations from Global Land Data Assimilation System (GLDAS), for the period 2003–2010 the snow water equivalent anomalies (ΔSWE) in North China (encompassing the HRB) only accounted for <0.03 mm year-1, which is negligible compared with the long-term TWS trend (Feng et al. Citation2013). Therefore, in our study, equation (1) can be rewritten as:
3.1 GRACE data
GRACE is a joint satellite mission launched in March 2002 by the US National Aeronautics and Space Administration (NASA) and the German Aerospace Centre (DLR). It consists of two identical satellites orbiting in tandem on a near-polar track at an altitude of approx. 500 km that, by monitoring changes in gravity, are mapping mass redistribution in the Earth’s system (Tapley et al. Citation2004). The measurements recorded by the GRACE satellites are an ensemble containing both gravitational and non-gravitational (e.g. atmospheric drag and radiation pressure) signals. Together with the latter forces, influences referred to as solid Earth tides, oceanic tides, postglacial rebound, ice melting and atmospheric and oceanic mass, are quantified and removed from the GRACE signals, leaving the residual signals mainly representing the hydrological mass variations (Schmidt et al. Citation2008, Ramillien et al. Citation2008). At present, several research groups are routinely providing GRACE TWS estimates. For this study, we used the two global solutions: the GRACE spherical harmonic fields release 2 from the French Groupe de Recherche en Geodesie Spatiale (GRGS_RL02); the other is from the University of Texas Centre for Space Research release 05 (CSR_RL05). Both these datasets have been resampled at 1° in latitude and longitude and 30-day time intervals. The time series spans from January 2003 to December 2012 (to August 2012 for GRGS data), expressed as equivalent water height.
The GRGS_RL02 solutions are provided as 10-day spherical harmonic (SH) coefficients of the gravity field. The GRGS SH coefficients are constrained by using an empirical stabilization approach which does not require any of the filtering or decorrelation steps (e.g. destriping and spatial smoothing) to be applied before use (Bruinsma et al. Citation2010). The GRGS gravity fields are expressed in terms of normalized SH coefficients up to degree 50, which corresponds to a global spatial resolution of approx. 400 km. The mean value of each coefficient was removed from all fields, so computations are expressed as anomalies relative to a mean value over the entire time span. In our study, the spatial means of total water storage were computed as the scalar product of the water mass coefficients δCnm(t), δSnm(t) with Anm and Bnm the normalized harmonic coefficients of the Hai River Basin geographical mask (e.g., Wahr et al. Citation1998, Ramillien et al. Citation2006, Darbeheshti et al. Citation2013):
where R is the mean radius of the Earth (6371 km).
The GRGS dataset includes estimates of the formal uncertainties of the spherical harmonic coefficients. We use these to derive uncertainties of our TWS values at each epoch by propagating the variances:
Errors associated with leakage of signal from outside regions were estimated using outputs from the WaterGAP global hydrology model (WHGM; Döll et al. Citation2003) and were added to the formal uncertainties. For consistency with other datasets (see below), the GRACE solutions used in this study were re-sampled to a 30-day temporal scale.
Similarly, the CSR_RL05 data maps the monthly gravity field change by an inversion of SH coefficients. Aside from signal corrections by using improved background models, several filtering and smoothing operations have been applied on the CSR dataset (Swenson and Wahr Citation2006; Landerer and Swenson Citation2012): (a) a destriping filter, to minimize the systematic north-to-south striping noises; (b) a 200-km-wide Gaussian averaging filter to reduce random errors in higher-degree SH coefficients; and (c) a low-pass spectral filter, to truncate SH coefficients to a maximum degree of 60, which implies a spatial resolution of >300 mm. Truncation and filtering operations can effectively reduce signal errors in the spectral domain; however, they will also attenuate true geophysical signals. To restore the GRACE signals and quantify leakage errors, the same processing steps used for the GRACE data are applied on synthetic TWS anomalies derived from the land surface model. A set of gridded gaining factors, aimed at recovering GRACE TWS anomalies and reducing leakage error, are obtained and reapplied to the GRACE time series. A total error comprising signal leakage and measurement errors in CSR_RL05 was computed as around 23 mm at the basin level. Readers are referred to Landerer and Swenson (Citation2012) for details of GRACE error estimation.
3.2 Rainfall data
Monthly gridded precipitation data, available online, were obtained from the Global Precipitation Climatology Centre (GPCC), operated by the National Meteorological Service of Germany (Deutscher Wetterdienst, DWD; http://gpcc.dwd.de/). Both the Full Data Reanalysis version 6 and the Monitoring Product version 4.0 were used. The Full Data Reanalysis product has data from 1901 to 2010. The Monitoring Product was used as a supplement for 2011 and 2012. The spatial resolution of the rainfall datasets is 1°. A spatial average was projected over the HRB and NCP. The temporal rainfall variability is presented as annual deviation against the long-term mean (1951–2001) in , and monthly time series between 2003 and 2012 in .
Fig. 4 Precipitation, in situ soil moisture(SM) and potential evaporation across the HRB: (a) monthly precipitation and in situ SM storage anomalies (expressed as deviation from the mean of 2003–2012); and (b) mean monthly precipitation (2003–2012), pan evaporation (1971–2000) and mean monthly in situ SM storage anomalies. The error range of SM anomalies is indicated by light grey shading. Precipitation data are from the GPCC, and pan evaporation and in situ soil moisture data are from the Chinese Meteorological Data Sharing Service (CMDSS).
3.3 Soil moisture anomalies
Soil moisture can be an important contributor to the variability of continental water storage. Previous studies have incorporated modelled soil moisture data from global land surface models to account for shallow subsurface water storage variations (e.g. Moiwo et al. Citation2009, Feng et al. Citation2013). In this study, we used in situ soil moisture data, which is more suitable for irrigated areas. In situ soil moisture data were collected from the China Meteorological Data Sharing Service System (CMDSS) which operates an active network of around 145 agro-meteorological stations across the HRB (of which about 100 stations are in the NCP). The dataset is archived as the relative soil moisture (expressed as a percentage of total soil water content in saturated condition) at depth intervals of 10, 20 and 50 cm. Soil moisture at greater depths (70 or 100 cm) is seldom recorded (<10 stations). The spatial distribution of soil moisture at gauged stations can be seen in . As most of the HRB is covered by shallow-rooted winter wheat and summer maize crops, the greatest soil moisture variability is mostly within the crop root zone in the upper 50 cm (Zhou et al. Citation2008). Hence, we assumed that the soil moisture in the 0–50 cm depth is representative of the water mass variations for the shallow unsaturated zone.
The relative soil moisture recorded three times a month (beginning, middle and end) was first aggregated into monthly means at each station. Using a regular spline with tension (RST) method, station-based relative soil moisture data at a monthly time step were spatially interpolated across the HRB and time series of basin spatial averages were computed for the period 2003–2012. Data gaps, which are frequent in winter months and January in particular (95% data gap), were filled using linear interpolation.
To convert relative soil moisture (SM) into absolute soil moisture expressed as equivalent water height, soil bulk density is required. On cultivated land, bulk density of the topsoil layer is usually impacted by tillage systems and mechanization. An averaged bulk density value of 1.5 g cm-3 was used, with ±0.2 g cm-3 accounting for the spatial variations (Zhang et al. Citation2012). The bulk density variations in space take up around ±7% of the total SM storage change. Besides that, the measurement error and deep soil moisture fluctuation may also affect the accuracy of final SM anomalies. To account for the above uncertainties, a maximum 15% of the total soil moisture storage was assigned as the error. Changes in water storage in the shallow unsaturated zone over the HRB were expressed as the deviation of the monthly spatial average against the mean for the 2003–2012 period.
3.4 Surface water storage anomalies
Surface water storage (SW) is another potential contributor to the GRACE gravity signals. Surface water over the HRB is stored in large government reservoirs. Thirty-four medium to large size reservoirs are located in the HRB and represent most of the surface water storage in the basin. Time series of annual water storage in these reservoirs were obtained from the Hai River Basin authority (www.hwcc.gov.cn/) and the Hai River Basin Water Resources Bulletin (Citation2003–2010), and converted to annual storage against the mean for 2003–2010. The dataset shows that the annual contribution from reservoir storage anomalies is very small and varies between −0.6 and 1.2 km3 (−1.8 mm and 3.7 mm in equivalent water height).
3.5 Groundwater storage
3.5.1 From in situ measurements across the HRB
Daily records of groundwater elevation from 42 boreholes located within the HRB boundary were collected from the National Earthquake Precursory Network of China (NEPN; http://qzweb.seis.ac.cn/twzx/). In situ records were aggregated to monthly means, and computed as water table change between two consecutive months at each bore. Spatial interpolation (RST method) was then performed across the basin. In order to compute changes in groundwater storage from the variations in groundwater levels, specific yield (SY) is needed (equation (5)). According to the lithology of the aquifers, values for the average specific yield were estimated to range from 0.05 to 0.07 (mean = 0.06) for the NCP region and from 0.005 to 0.02 (mean = 0.0125) for the mountainous areas. The value of SY would strongly influence the in situ estimates of change in groundwater storage. To account for uncertainties relating to the value of this parameter, calculations of in situ groundwater storage are given for a range of SY values from the literature (Moiwo et al. Citation2009, Singhal and Gupta Citation2010, Feng et al. Citation2013).
where Δh represents the change in groundwater level.
3.5.2 From in situ measurements across the Hebei Plain
Another set of in situ groundwater data used in this study is from the Hebei provincial water authority, who manage a dense monitoring network of ~314 bores over the Hebei Plain. Estimates of changes in groundwater hydraulic heads in the shallow aquifers across the Hebei Plain were spatially averaged (Environmental Bulletins for Hebei Province Citation2010–2011, Groundwater Bulletin for Hebei Province Issue 6-36). Data were mainly recorded in March, May, August/September and December, and the dataset therefore provides a general indication of the seasonal variability as well as long-term trends in groundwater storage.
The Hebei Plain covers approx. 50% of the NCP area and is typical of land-use practices throughout the whole of the NCP. The geology and climate in the Hebei Plain can also be considered as representative of the whole NCP. Groundwater represented approx. 82% of the total water consumption for the period 2000–2008; some famous large depression cones and chains can be found in the Hebei Plain (Zhang et al. Citation2009).
3.5.3 From GRACE satellite observations
The GRACE solutions and in situ soil moisture data were used to calculate the changes in water storage of the deep unsaturated zone (depth >50 cm) and aquifers, referred to herein as the deep subsurface storage (DSS) for the whole HRB. Surface water storage is negligible here. Changes in DSS can be approximated as:
As errors for ΔTWS and ΔSM have been clearly defined in previous sections, the final budget for ΔDSS can be computed as a linear propagation of the above two error sources: εdss = εtws + εs. The maximum and minimum linear trends for GRACE-derived ΔDSS are calculated as:
4 RESULTS
4.1 Variations in precipitation and soil moisture
Significant rainfall variability can result in water storage fluctuations in both surface and subsurface stores. Using the GPCC data, plots the annual rainfall variations over the HRB and NCP. The HRB generally has lower annual precipitation, compared with the NCP, which is reflected by a difference of approx. 62 mm in long-term averages (mean annual rainfall of 563.8 mm year-1 in the NCP vs 531.4 mm year-1 in the HRB between 1951 and 2012). A drought occurred in 2001 and 2002, with annual rainfall deficits of 24% across the HRB (relatively higher over the NCP, with annual rainfall deficits of 28 and 35%). A long rainy season in 2003 brought an end to this drought, with an annual rainfall surplus of 18% in the NCP and 12% in the HRB (see ). From 2003 onwards, rainfall declined steadily until 2006, when the annual rainfall was almost 20% lower than the long-term annual average in both regions. From 2008 to 2011, rainfall returned wetter conditions, with mean annual rainfall around and above average levels.
From 2003 to 2012, soil moisture storage anomalies in the first 50 cm of the soil profile (shallow unsaturated zone) varied between –50 and 50 mm (). The only remarkable peak and trough are found in the end of 2003 and in pre-summer 2007. Despite that, no significant inter-annual trend is detected for the soil moisture storage anomalies: −0.4 ± 0.06 mm year-1 between 2003 and 2012, considering the uncertainty in bulk density and other effects (see ). In the HRB, with annual potential evaporation exceeding total rainfall, agricultural irrigation is necessary and widespread, which may largely influence soil moisture variability. Significant volumes of groundwater resources are seasonally pumped to meet high water requirements for cropping, and this practice has been shown to reverse the drying trends in the soil profile (Yang et al. Citation2006b). At the seasonal scale (see ), the highest soil moisture deficit (approx. 20 mm, on average) occurs in the April–June period. This seasonal soil moisture deficit is replenished by rainfall events during the summer. A short decline in soil moisture (<5 mm) can be seen in autumn, and this is quickly compensated by a large gain from irrigation during winter (increase by 15 mm).
Table 2 Linear trends in water storage for terrestrial water storage anomalies (TWS), in situ soil moisture anomalies (SM), deep sub-surface water storage anomalies (DSS) and in situ groundwater anomalies (in situ GW), 2003–2012.
4.2 GRACE-estimated terrestrial water storage anomalies
and present the GRACE TWS anomalies from the two solutions: GRGS_RL02 and CSR_RL05. Despite the replenishment by the high rainfall in 2003, a long-lasting downward trend is observed in the GRACE data over the HRB. The total on-land water mass declined at a rate of –17.9 ± 4.6 mm year-1 according to GRGS_RL02 solutions and –8.7 ± 4.0 mm year-1 according to CSR_RL05 in equivalent water height; this is equal to a volumetric loss of –5.8 ± 1.5 km3 year-1and –2.8 ± 1.3 km3 year-1, respectively (see ). The decline in TWS during the period 2004–2006 corresponds to the same period of below average rainfall. From 2007, annual rainfall levels increased, whereas the TWS anomalies continued to decline until 2012. An examination of the amplitude of soil moisture storage anomalies demonstrates that the water mass change in soil moisture is not the likely contributor to the decrease in TWS (see Section 4.1). This may indicate a potential impact from the consumption of groundwater resources in the heavily irrigated HRB or the NCP.
Fig. 5 (a) and (b) total water storage anomalies (TWS: —) and deep subsurface water storage anomalies (DSS: ······) derived from GRACE GRGS_RL02 over the HRB from 2003 to 2012; (c) in situ groundwater storage anomalies (in situ GW: - - - -) over the HRB for the same period; and (d) seasonal amplitudes in TWS, SM, DSS and in situ GW after removing annual trend. The legends for TWS, DSS and in situ GW are kept in the same pattern as in (a), (b) and (c), except for SM (-·-·-). Linear trend for TWS, DSS and in situ GW: ![]()
Fig. 6 (a) and (b) total water storage anomalies (TWS: —) and deep subsurface water storage anomalies (DSS: ······) derived from GRACE CSR_RL05 over the HRB from 2003 to 2012; (c) in situ groundwater storage anomalies (in situ GW: - - - -) over the HRB for the same period; (d) seasonal amplitudes in TWS, SM, DSS and in situ GW after removing annual trend. The legends for TWS, DSS and in situ GW are kept in the same pattern as in (a), (b) and (c), except for SM(-·-·-). Linear trend for TWS, DSS and in situ GW: ![]()
At the seasonal scale (see and ), the phase in GRACE-estimated TWS anomalies generally agrees well with the pattern of soil moisture. Water storage in SM and TWS peaks in the summer (August–September), correlating to rich rainfall during this time; it bottoms out during the pre-summer season, with a water deficit of approx. 17 mm in soil moisture and up to 54.6 mm in TWS in June. Remarkable water stress in the late spring and early summer can be attributed to water loss via evapotranspiration, which would trigger massive groundwater pumping. The SM storage from in situ measurements appears to be extremely high in winter; up to 15.6 mm of water gain can be seen between December and the following February, which would even exceed the GRGS-estimated TWS anomalies in the same time. Some discrepancies also can be found between CRS and GRGS in TWS projection. The CSR solutions show an extra ~10 mm water deficit in June compared with GRGS; the opposite is found for the peak time in September: 15 mm less in CRS than in GRGS. The CSR solutions projected a high level of TWS storage in winter and early spring (a water gain of up to 22 mm).
4.3 Comparison of GRACE-estimated water storage anomalies in the deeper subsurface with in situ groundwater storage anomalies
By removing the soil moisture component from the ensemble TWS observed from GRACE, water storage variations in the deep subsurface (denoted by DSS) can be obtained. We presume that this result carries a strong signal about inter-annual change in groundwater storage in the HRB. To compare GRACE satellite estimates in DSS, hydraulic head records between 2003 and 2012 collected from ground monitoring bores were converted to storage anomalies and averaged over the HRB. and plots the results from both sources. Similar to the trend in TWS, DSS derived from GRACE also present a persistent decline since 2004. From , the linear trend in DSS estimated by GRGS solutions for the period 2003–2012 indicates water storage depletion at a rate of –17.0 ± 4.3 mm year-1 in equivalent water height, equal to a loss of –5.5 ± 1.4 km3 year-1 in volume (CSR: –8.3 ± 4.5 mm year-1 and –2.7 ± 1.5 km3 year-1). Depletion trends were also found in local groundwater measurements, representing a higher loss in groundwater storage; the depletion rate was estimated as –31.7 ± 7.2 mm year-1 in equivalent water height and –10.3 ± 2.4 km3 year-1 in volume, with no signs of growth in groundwater storage in 2003. The difference between GRACE and ground estimates in groundwater storage change may be related to the value of the specific yield. There are no maps or references detailing the spatial variability of the specific yield across the HRB; in our study only two average values were set for the NCP and mountain regions. The value of the specific yield will strongly affect the final trend derived from ground measurements. By changing SY setting from mean values of 0.08–0.06 for the NCP and 0.05–0.0125 for the mountain ranges, the estimated linear trend in groundwater storage from monitoring bores will drop by around 15 mm year-1 and 5 km3 year-1 in volume. In addition, uneven distribution of ground bore samples can also influence our estimation of groundwater storage change. The operational bores are mainly concentrated around Beijing, Tianjin and the northern part of Hebei Province, and may all be influenced by intensive groundwater extraction from municipal cities. There are large regions with no or limited bore observations in the central and southern parts of the NCP (Heibei Province, Shandong and Henan Province), as well as mountainous regions (Shanxi Plain).
Regarding the seasonal amplitude and phase, the GRACE estimates of DSS also show a general good agreement with in situ observations. Seasonally, a groundwater deficit occurs between April and July, with a peak in June (–23.4 and –37.1 mm from GRGS and CSR, respectively, against –20 mm from the in situ measurements). The timing of this phase correlates with the demand for irrigation from groundwater to support winter wheat, the predominant crop in the basin (Xu et al. Citation2005). Upcoming rainfall in the summer recharges local groundwater aquifers, making the storage peak in October with an estimated seasonal gain of 12.3–28.7 mm by GRACE, compared with 25.0 mm based on results from the ground monitoring bores. Unusually high levels of in situ SM storage in the winter and a following sharp decline in March and April cause a ‘false’ water gain in GRACE-estimated DSS in the same months. There is no such a trend found in ground-measured GW projections, with a gradual water deficit starting as early as in March. The DSS deficits estimated by GRGS in June and July are closer to in situ results, whereas a more severe groundwater loss is estimated by CSR.
4.4 Groundwater depletion in the NCP
By using GRACE satellite and ground observations, we can draw a conclusion that the groundwater storage over the HRB was undergoing a continuing depletion during the last decade. However, a contribution to such remarkable groundwater depletion is speculated to come from the NCP, where the total annual groundwater consumption has been said to take up approximately 80% of the total volume for the HRB (see ), rather than from its surrounding mountainous regions and tableland (see ). To confirm this conclusion, we calculated NCP-average monthly groundwater storage anomalies based on the in situ monitoring bore records. The results show that the groundwater storage over the NCP between 2003 and 2012 was dropping at the rate of –62.9 ± 10.5 mm year-1 in equivalent water height, which is obviously larger than the values averaged over the HRB; annual water loss measured in volumetric rate across the NCP is at 8.8 ± 1.5 km3 year-1, accounting for >80% of the total annual groundwater loss in the HRB.
However, we also extrapolated groundwater storage change (only with reference to shallow aquifers) provided by the Hebei water authority between 2003 and 2011 to the whole NCP. The depletion rate was computed as –14.2 ± 2.4 mm year-1 in equivalent water height (2.0 ± 0.3 km3 year-1 in volume), which is much smaller than the figures based on the ground monitoring bores collected from the NEPN. This rate is close to the GRGS estimates but larger than the rate derived from the CSR solutions. The large discrepancy between these two in situ data sources may be significantly affected by the spatial and temporal data density: according to the description from the provincial water authority, their statistics are on the basis of >300 gauging bores, with accessible data publicity at 3–4 month time interval; in contrast, the daily records collected from the NEPN only have around 40 bores covering the whole HRB, with large opening places over the central and southern parts of the NCP.
Based on the mean annual change in hydraulic head measured at each bore (from the NEPN) between 2003 and 2012, we can draw some conclusions about the spatial variations of groundwater storage change across the HRB and NCP (see ). Two bores distributed the Shanxi Plain show a slightly drop in water table level, at a rate of 0.01–0.09 m year-1. Mountainous regions surrounding the NCP have only one out of five bores dropping at 0.17 m year-1. The bores we obtained for the NCP are mainly distributed at its upper part, covering Beijing and Tianjin municipal areas and the northern part of the Hebei Plain. The majority of these locations lie in the piedmont and alluvial plain, indicating some massive groundwater loss, varying between –1 and –3 m year-1 in the deep aquifer. An extreme drop is found at a bore near the northeastern edge of the NCP, showing that the water table level declined from <40 m (depth from water level to the ground surface) in 2003 to >120 m in 2012. Two other bores lying in the middle of the alluvial plain suffered a drop in water table level of about 4 m year-1.
5 DISCUSSION
The significant declines in the groundwater resources of the NCP have prompted both the national and local Chinese governments to launch a series of water-saving programmes. A report from the World Bank predicted that the new water policies led by the Chinese government agencies during the 2001–2005 period could reduce the annual water consumption for irrigation by 15–38% in northern China (World Bank Citation2007). Mitigation efforts introduced include:
increased water price in 2002 (only for the industrial and domestic sectors, e.g. in Hebei Province) (Calow et al. Citation2009);
a series of water-efficiency management programmes (commenced in the 1990s) to maintain grain production while minimizing water use by the optimum combination of crop variety, soil conditions and agricultural practices (McVicar et al. Citation2002, Fang et al. Citation2010, Hu et al. Citation2010); and
the partial completion of the inter-basin transfer known as the Middle Route of the North-to-South Water Transfer Project (commenced in 2003), by which a maximum of 20 km3 of freshwater can be diverted into municipal regions of the NCP (Berkoff Citation2003).
In addition to these three programmes, specific districts suffering from the most severe groundwater exploitation, such as Cangzhou, Shijiazhuang and Baoding cities, have conducted a so called ‘Shut down privately-owned wells’ scheme in order to gradually reduce the scale of groundwater extraction. By the end of 2009, more than 1500 wells had been closed, resulting in a groundwater extraction reduction estimated at 0.16 km3 (Hai River Basin Groundwater Bulletin Citation2010).
Irrigation is considered to be the cause of the bulk of the groundwater deficit observed across the NCP (see ). In total, agriculture consumes more than 70% of the groundwater supply taken up for irrigation purposes (Zhang et al. Citation2011). More recently, the expansion in irrigation appears to have slowed down; the irrigated area only increased by 2.6% (from 7.5 × 10⁴ to 7.7 × 10⁴ km2) between 2001 and 2007 (Qin et al. Citation2012). However, this seems to be minor in terms of changing the significant groundwater usage. But, water-saving irrigation practices and technology were thought by some either to be impractical, because the wheat-growing pattern is too land-intensive to be equipped with dripping and micro-sprinkling facilities, or to face poor incentives to be widely carried out by farmers due to the high budget requirement. It has been suggested that the key is to change to cropping patterns that are less water-demanding (Lohmar et al. Citation2003, Foster et al. Citation2003).
Table 3 Evolution of water resources consumption by different sectors. Data source: Hai River Water Conservancy Commission (http://www.hwcc.gov.cn).
In the NCP, industry and urban water use can exert very significant localized stresses on the deep aquifer system (Zhang et al. Citation2009). The growth in domestic water consumption is mainly driven by population growth rather than a rise in water consumption per capita (Zhang et al. Citation2011, Qin et al. Citation2012). In the 1980s, the total population in the NCP was 0.97 × 10⁸, and this increased by 37.1% to 1.3 × 10⁸ in 2009 (Zhang et al. Citation2011). It was forecast by Qin et al. (Citation2012) that more than 50% of the NCP population will live in urban areas by 2020. Growth in urban areas can also significantly alter hydrological pathways and, if there are large areas of impermeable surfaces, such as roads and pavements, this can reduce local groundwater recharge volumes. The results of satellite images and land-use surveys just for Beijing showed that the total paved road area increased by 250% between 2000 and 2003 (Kendy et al. Citation2007). Therefore, future water savings from agricultural mitigation schemes may be locally counter-balanced by the increase in domestic groundwater use and reductions in groundwater recharge rates.
Both GRACE solutions (GRGS_RL02 and CSR_RL05) and in situ groundwater measurements present a steep decline in deep subsurface water storage from 2004 to 2006, which corresponds to a period of low rainfall (). The NCP shallow aquifers are primarily recharged by rainfall infiltration (68% of total groundwater recharge), irrigation return flows (14.9%) and indirect recharge from the drainage network (7.2%) (Zhang et al. Citation2009). The decrease in DSS in the 2004–2006 period is probably due to a combination of declines in direct and indirect recharge, and increased groundwater consumption for irrigation to meet crop requirements during the low rainfall conditions. From 2007 to 2012, annual rainfall was stable around the long-term average; this period is therefore valuable to isolate the anthropogenic impact from climate variability. From that, we can conclude that over-extraction is the main driving factor of the constant downward trend in groundwater storage. Governmental water-saving policies may have some effects in preventing the water table from continuously dropping, either at a small scale or in the short term, but these are likely to be offset by growth in demand from all sectors: agriculture, industry and urban.
The GRACE satellite gravimetry provides a feasible means to monitor changes in terrestrial water storage, which is particularly valuable for large regions with scarce gauging networks and limited knowledge about hydrogeological conditions. However, it does have some limits in its application. First, the accuracy of GRACE results has to rely on the goodness of ground measurements and/or numerical modelling outputs, e.g. soil moisture and surface water storage. Poor performance of ancillary water component data may contaminate GRACE’s results. Secondly, in order to suppress GRACE noise, high-degree Stokes coefficients were intentionally truncated, and these to some extent decide GRACE’s resolution in space. Coarse spatial resolution (~300 km) limits GRACE application to large basins. Lastly, the discrepancy found in different GRACE solutions which adopt their own unique processing methods may lead to different conclusions. This point can be clearly demonstrated in our study. Essentially, solutions from GRGS and CSR represent two different strategies in post-processing: CSR_RL05 employed a series of filters and scaling factors to optimize the mass signals, whereas GRGS_RL02 solutions were forced by constraints to the mean periodic reference model to substitute the filtering and smoothing operations. As a result, the depletion rate of TWS and DSS derived from GRGS_RL02 can be about twice as high as that of CSR_RL05. As ground validation is still far from sufficient at the global scale, it is still too early to make a judgement on the discrepancies between the existing GRACE solutions. A combination of applying multiple GRACE datasets and conducting broad ground validation and comparison is recommended to constrain the uncertainties.
6 CONCLUSION
GRACE observations provide rapid, up-to-date and independent means of detecting groundwater storage balance over a large region or basin. Such an application is particularly valuable for those regions that are suffering intensive groundwater extraction, but without sufficient groundwater networks to trace to. In this study, GRACE gravity field measurements were applied to observe the recent decadal groundwater storage variation over the Hai River Basin (which encompasses the North China Plain, notorious for its groundwater over-extraction in the last two or three decades). The results reveal a strong declining trend in the deep subsurface water storage (DSS) between 2004 and 2012. Trends calculated from GRACE GRGS_RL02 and CSR_RL05 solutions for the period 2003–2012 indicate that the DSS was lowered at an average rate of 17.0 ± 4.3 mm year-1 in equivalent water height, equivalent to a water loss of 5.5 ± 1.4 (CRS_RL05: 8.3 ± 4.5 mm year-1 and 2.7 ± 1.5 km3 year-1). This trend shows a good agreement with the ground monitoring network, and we believe it is mainly contributed by the massive groundwater overdrawal from the NCP.
The GRACE information also offers us important insights into the effectiveness of government water-saving programmes implemented throughout the NCP. By comparing precipitation data for the same period, we concluded that the decline in groundwater storage between 2004 and 2006 may be largely due to the rainfall deficit for the same period; from 2007 onwards, anthropogenic over-consumption of groundwater storage can be separated as the local rainfall returns to above or around average level. Groundwater over-exploration was still happening after more than a decade of implementating a series of water-saving schemes, which is not in line with the expectation of the local government and water authorities. The discrepancy between GRACE solutions may be associated with their different post-processing strategies, as well as the uncertainty contained by GRACE’s signals. Cross-comparison with in situ measurements and government statistics allows us to improve confidence and further constrain the GRACE datasets from different data providers.
Disclosure statement
No potential conflict of interest was reported by the author(s).
Acknowledgements
The authors thank the Chinese Meteorological Data Sharing Service System for the distribution of soil moisture and pan evaporation datasets, and the National Earthquake Precursory Network of China for their provision of in situ groundwater observations. The authors also acknowledge the GRGS and CSR for the GRACE datasets. Precipitation data were gratefully obtained from the Global Precipitation Climatology Centre. The authors are grateful to the two anonymous reviewers, Dr Xianfang Song and the associate editor who helped improved the quality of this paper.
REFERENCES
- Berkoff, J., 2003. China: the south-north water transfer project–is it justified? Water Policy, 5 (1), 1–28.
- Bruinsma, S., et al., 2010. CNES/GRGS 10-day gravity field models (release 2) and their evaluation. Advances in Space Research, 45 (4), 587–601. doi:10.1016/j.asr.2009.10.012
- Calow, R.C., Howarth, S.E., and Wang, J., 2009. Irrigation development and water rights reform in China. International Journal of Water Resources Development, 25 (2), 227–248. doi:10.1080/07900620902868653
- Changming, L., Jingjie, Y.U., and Kendy, E., 2001. Groundwater exploitation and its impact on the environment in the North China Plain. Water International, 26 (2), 265–272. doi:10.1080/02508060108686913
- Darbeheshti, N., et al., 2013. The ANU GRACE visualisation web portal. Computers and Geosciences, 52, 227–233. doi:10.1016/j.cageo.2012.10.005
- Döll, P., et al., 2012. Impact of water withdrawals from groundwater and surface water on continental water storage variations. Journal of Geodynamics, 59–60 (0), 143–156. doi:10.1016/j.jog.2011.05.001
- Döll, P., Kaspar, F., and Lehner, B., 2003. A global hydrological model for deriving water availability indicators: model tuning and validation. Journal of Hydrology, 270 (1–2), 105–134. doi:10.1016/S0022-1694(02)00283-4
- Environmental Bulletins for Hebei Province, 2010–2011. Environmental Protection Bureau of Hebei. Available from: http://www.hb12369.net:8000/hjzlzkgb/. [Accessed 27 June 2011].
- Falkenmark, M. and Widstrand, C., 1992. Population and water r: A delicate balance. Population Bulletin. Population Reference Bureau, Washington, DC.
- Fang, Q.X., et al., 2010. Water resources and water use efficiency in the North China Plain: current status and agronomic management options. Agricultural Water Management, 97 (8), 1102–1116. doi:10.1016/j.agwat.2010.01.008
- Fei, Y.H., et al., 2009. Analysis on evolution of groundwater depression cones and its leading factors in North China Plain. Resources Science, 31 (3), 394–399.
- Feng, W., et al., 2013. Evaluation of groundwater depletion in North China using the Gravity Recovery and Climate Experiment (GRACE) data and ground-based measurements. Water Resources Research, 49 (4), 2110–2118. doi:10.1002/wrcr.20192
- Foster, S., et al., 2003. Quaternary Aquifer of the North China Plain—assessing and achieving groundwater resource sustainability. Hydrogeology Journal, 12 (1), 81–93. doi:10.1007/s10040-003-0300-6
- Ge, D.Q., et al., 2009. Large scale land subsidence monitoring with a reduced set of SAR images. Paper presented at the Geoscience and Remote Sensing Symposium, 2009 IEEE International, IGARSS 2009, 12–17 July 2009.
- Gleeson, T., et al., 2012. Water balance of global aquifers revealed by groundwater footprint. Nature, 488 (7410), 197–200. doi:10.1038/nature11295
- Groundwater Bulletin for Hebei Province, Issue 6–36. Available via hydrology and water resources information networks of Hebei Province. Available from: http://www.hbsw.net/index.html. [Accessed 27 June 2011].
- Hai River Basin Groundwater Bulletin, 2010. The Ministry of Water Resources in the Haihe River Water Conservancy Commission. Available from: http://www.hwcc.gov.cn/pub2011/hwcc/wwgj/index.html. [Accessed 27 June 2011].
- Hai River Basin Water Resources Bulletin, 2003–2010. The Ministry of Water Resources in the Haihe River Water Conservancy Commission. Available from: http://www.hwcc.gov.cn/pub2011/hwcc/wwgj/index.html. [Accessed 27 June 2011]
- Hu, Y.K., et al., 2010. Agricultural water-saving and sustainable groundwater management in Shijiazhuang Irrigation District, North China Plain. Journal of Hydrology, 393 (3–4), 219–232. doi:10.1016/j.jhydrol.2010.08.017
- Kendy, E., et al., 2007. Can urbanization solve inter-sector water conflicts? Insight from a case study in Hebei Province, North China Plain. Water Policy, 9, 75–93. doi:10.2166/wp.2007.046
- Konikow, L.F. and Kendy, E., 2005. Groundwater depletion: a global problem. Hydrogeology Journal, 13 (1), 317–320. doi:10.1007/s10040-004-0411-8
- Landerer, F.W. and Swenson, S.C., 2012. Accuracy of scaled GRACE terrestrial water storage estimates. Water Resources Research, 48, W04531. doi:10.1029/2011WR011453
- Leblanc, M.J., et al., 2009. Basin-scale, integrated observations of the early 21st century multiyear drought in southeast Australia. Water Resources Research, 45, W04408. doi:10.1029/2008wr007333
- Liu, C.M., Zhang, X.Y., and Zhang, Y.Q., 2002. Determination of daily evaporation and evapotranspiration of winter wheat and maize by large-scale weighing lysimeter and micro-lysimeter. Agricultural and Forest Meteorology, 111 (2), 109–120. doi:10.1016/S0168-1923(02)00015-1
- Lohmar, B., et al., 2003. China’s agricultural water policy reforms: increasing investment, resolving conflicts, and revising incentives. Economic Research Service, United States Department of Agriculture (USDA).
- McVicar, T.R., et al., 2002. Monitoring regional water use efficiency indicators on the North China Plain. In: T.R. McVicar, et al., eds. Regional Water and Soil Assessment for Managing Sustainable Agriculture in China and Australia. ACIAR Monograph No. 84. 231–257. Available from: http://aciar.gov.au/files/node/468/mn84section3spatialinformationsystems-part2chapter18.pdf [Accessed 6 March 2015].
- Moiwo, J.P., et al., 2009. Comparison of GRACE with in situ hydrological measurement data shows storage depletion in Hai River basin, Northern China. Water SA, 35 (5), 663–670. doi:10.4314/wsa.v35i5.49192
- Qin, H.H., et al., 2012. System dynamics analysis of water supply and demand in the North China Plain. Water Policy, 14, 214–231. doi:10.2166/wp.2011.106
- Ramillien, G., Famiglietti, J.S., and Wahr, J., 2008. Detection of continental hydrology and glaciology signals from GRACE: a review. Surveys in Geophysics, 29 (4–5), 361–374. doi:10.1007/s10712-008-9048-9
- Ramillien, G., et al., 2006. Interannual variations of the mass balance of the Antarctica and Greenland ice sheets from GRACE. Global and Planetary Change, 53 (3), 198–208. doi:10.1016/j.gloplacha.2006.06.003
- Rodell, M., et al., 2005. Global biomass variation and its geodynamic effects: 1982–98. Earth Interactions, 9 (2), 1–19. doi:10.1175/EI126.1
- Rodell, M., Velicogna, I., and Famiglietti, J.S., 2009. Satellite–based estimates of groundwater depletion in India. Nature, 460 (7258), 999–1002. doi:10.1038/nature08238
- Scanlon, B.R., et al., 2006. Global synthesis of groundwater recharge in semiarid and arid regions. Hydrological Processes, 20 (15), 3335–3370. doi:10.1002/hyp.6335
- Schmidt, R., et al., 2008. Hydrological signals observed by the GRACE satellites. Surveys in Geophysics, 29 (4–5), 319–334. doi:10.1007/s10712-008-9033-3
- Singhal, B.B.S. and Gupta, R.P., 2010. Applied hydrogeology of fractured rocks. Dordrecht: Springer.
- Strassberg, G., Scanlon, B.R., and Chambers, D., 2009. Evaluation of groundwater storage monitoring with the GRACE satellite: case study of the High Plains aquifer, central United States. Water Resources Research, 45, W05410. doi:10.1029/2008WR006892
- Swenson, S. and Wahr, J., 2006. Post-processing removal of correlated errors in GRACE data. Geophysical Research Letters, 33 (8), L08402. doi:10.1029/2005GL025285
- Tapley, B.D., et al., 2004. The gravity recovery and climate experiment: mission overview and early results. Geophysical Research Letters, 31 (9), L09607. doi:10.1029/2004GL019920
- Wada, Y., et al., 2010. Global depletion of groundwater resources. Geophysical Research Letters, 37 (20), L20402. doi:10.1029/2010GL044571
- Wahr, J., Molenaar, M., and Bryan, F., 1998. Time variability of the earth’s gravity field: hydrological and oceanic effects and their possible detection using GRACE. Journal of Geophysical Research, 103 (B12), 30205–30230. doi:10.1029/98JB02844
- Wang, S.Q., et al., 2008. Dynamic features of shallow groundwater in North China Plain. Acta Geographica Sinica, 63 (5), 462–472.
- World Bank, 2007. Implementation completion and results report. Water Conservation Project Report No. ICR0000191. Washington, DC: World Bank. Available from: http://www-wds.worldbank.org/external/default/WDSContentServer/WDSP/IB/2007/05/03/000020953_20070503142410/Rendered/INDEX/ICR0000191.txt
- Xu, Y.Q., et al., 2005. Analysis on groundwater table drawdown by land use and the quest for sustainable water use in the Hebei Plain in China. Agricultural Water Management, 75 (1), 38–53. doi:10.1016/j.agwat.2004.12.002
- Yang, H. and Zehnde, A., 2001. China’s regional water scarcity and implications for grain supply and trade. Environment and Planning A, 33, 79–95. doi:10.1068/a3352
- Yang, Y.H., et al., 2006a. Optimizing irrigation management for wheat to reduce groundwater depletion in the piedmont region of the Taihang Mountains in the North China Plain. Agricultural Water Management, 82 (1–2), 25–44. doi:10.1016/j.agwat.2005.07.020
- Yang, Y.H., et al., 2006b. Estimation of groundwater use by crop production simulated by DSSAT-wheat and DSSAT-maize models in the piedmont region of the North China Plain. Hydrological Processes, 20 (13), 2787–2802. doi:10.1002/hyp.6071
- Zhang, G.H., et al., 2011. Situation and origin of water resources in short supply in North China Plain. Journal of Earth Sciences and Environment, 33 (2), 172–176. (in Chinese).
- Zhang, X.Y., et al., 2012. Incorporation of soil bulk density in simulating root distribution of winter wheat and maize in two contrasting soils. Soil Science Society of America Journal, 76 (2), 638–647. doi:10.2136/sssaj2011.0187
- Zhang, Z.J., et al., 2009. Investigation and assessment of sustainable utilization of groundwater resources in the North China Plain. Beijing: Geological Publishing House. (in Chinese).
- Zhong, M., et al., 2009. Trend of China land water storage redistribution at medi- and large-spatial scales in recent five years by satellite gravity observations. Chinese Science Bulletin, 54, 816–821. doi:10.1007/s11434-008-0556-2
- Zhou, S.-L., et al., 2008. The nitrate leached below maize root zone is available for deep-rooted wheat in winter wheat-summer maize rotation in the North China Plain. Environmental Pollution, 152 (3), 723–730. doi:10.1016/j.envpol.2007.06.047