
Abstract
Climate variability and change play a crucial role in the vulnerable system of the Aksu River basin located in Kyrgyzstan and northwest China, providing precious water resources for the intense oasis agriculture of the Xinjiang Province (China). Ubiquitous warming and increase in precipitation (in the lower part of the basin) have been detected. Glaciers in the region are retreating. Seasonal trends in river discharge show an increase. A clear link could be demonstrated between daily temperature and lagged river discharge at two headwater stations in summer. However, the correlation breaks over short periods in the end of summer or beginning of autumn at the Xiehela station, when the high (over 95th percentile) flow peaks caused by the glacier lake outburst floods of the Merzbacher Lake occur. This feature is a challenge for the climate impact assessment in the region, as these regular outbursts have to be represented in the projections for the future as well.
Editor D. Koutsoyiannis
Résumé
La variabilité et le changement climatiques jouent un rôle crucial dans le système vulnérable du bassin de la rivière Aksu situé aux confins du Kirghizstan et du Nord-Ouest de la Chine, et qui fournit de précieuses ressources en eau pour l’agriculture intensive d’oasis de la province du Xinjiang (Chine). Un réchauffement global et une augmentation des précipitations (dans la partie inférieure du bassin) ont été détectés. Les glaciers de la région reculent. Les tendances saisonnières du débit de la rivière sont en augmentation. Un lien clair a pu être démontré en été entre la température journalière et le débit décalé de la rivière sur deux stations amont. Cependant, la corrélation disparait rapidement à la fin de l’été ou au début de l’automne à la station de Xiehela, lors des pics de crue (au delà du percentile 95) causés par les débâcles du lac glaciaire Merzbacher. Cette situation est un défi pour l’évaluation de l’impact climatique dans la région, car ces débâcles régulières doivent être simulées dans les projections.
1 INTRODUCTION
The River Aksu () is a transboundary river which originates in Central Tien Shan in Kyrgyzstan (where it is known as Sary-Djaz) and drains into the Xinjiang Uyghur Autonomous Region (Xinjiang Province) of northwestern China. The river forms from the heavily glaciated Tomur Peak (7439 m a.s.l.; Tömür Feng in Uyghur/Chinese, Pik Pobedy in Russian and Jengish Chokosu in Kyrgyz) and the Khan Tengri massif, the highest peaks of the Tien Shan. Another less important source is the Ak-Shirak massif and the Kokshaal-Too. The Aksu, with a total length of 282 km and a drainage area of approximately 42 000 km2, is the largest and principal tributary of the Tarim River, providing about 70–80% of its total water supply, despite the fact that the area of the Aksu basin covers <5% of the area of the whole Tarim River basin (Giese et al. Citation2005, Wang et al. Citation2008).
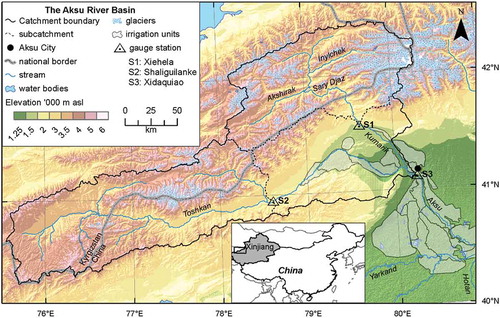
Fig. 1 The Aksu basin, its three main hydrological gauge stations: S1: Xiehela, S2: Shaliguilanke and S3: Xidaquiao, and the corresponding sub-catchment boundaries.
The Tarim River in Xinjiang is the longest inland river of China, disappearing in the sands of the Taklamakan Desert. The endorheic basin of the River Tarim, with an area of about 1 020 000 km2, is situated in the centre of the Eurasian continent, very remote from the ocean. It is surrounded by some of the highest mountain ranges of the world, including the Tien Shan in the north and northwest, the Pamir in the west and the Karakoram and Kunlun Shan in the south, which act as barriers to humid air masses. The surrounding mountains have an important function of storing and supplying freshwater. Precipitation is accumulated in seasonal snow and perennial ice. The glaciers cover an area of approximately 20 000 km2 in the Tarim basin within China (Liu et al. Citation2006). Snow and ice melting during spring and summer provide water for the growing season when the demand for water is highest. It is estimated that glacial meltwater contributes about 39% of the total river runoff of the Tarim (Liu et al. Citation2006).
The climate in the Tarim basin is arid to hyper-arid. It is highly continental with a mean annual precipitation ranging from approx. 30 mm year-1 in the central desert plain to approx. 320 mm year-1 measured at the highest Tien Shan station (3614 m a.s.l.) located close to the investigated basin. The multi-annual means of seasonal precipitation display an annual cycle, with a maximum in June–August, and a minimum in November–January (Tao et al. Citation2011). Hence, agriculture is only possible through irrigation in the oases located in the lower parts of the basin along the course of the river and its tributaries. A changing climate will have fundamental consequences for the cryosphere and, hence, for water availability in the region. The discharges of the River Aksu and other Tarim tributaries are highly influenced by the climate variability and climate change, which were a subject of studies reported in the literature (e.g. Tao et al. Citation2011, Sorg et al. Citation2012).
In this contribution, we focus on the Aksu basin and aim to investigate more systematically the current trends in climate parameters, glaciers and water discharge, and their inter-dependencies. The objectives of the study are: (a) to review literature on trend detection in the region; (b) to make a step forward in analysing more systematically the trends in climate parameters, water discharge and glaciers in the Aksu River basin, and (c) to analyse interrelationships between climate parameters and river discharge.
2 CRITICAL REVIEW OF LITERATURE ON TREND DETECTION
In this section we include an overview of literature sources discussing current trends in the Aksu and Tarim basins, and identify critical points which raise open questions and motivate researchers to make a more detailed study in the region. The intention of this paper is to clarify some of the open questions.
2.1 Climate
Northwest China, in general, has experienced a warmer and dryer climate since the middle of the 19th century. However, a transition to a warmer and a slightly wetter climate has been occurring since the late 1980s (Shi et al. Citation2006, Citation2007, Wu et al. Citation2010). There is a general agreement that both temperature (T) and precipitation (P) have been increasing during the last decades also in the Aksu-Tarim basin (Tao et al. Citation2011). However, uncertainty persists on the magnitude of change, and on how climate variability and change would affect hydrological processes in the region.
Xu et al. (Citation2006) found a significant increase in precipitation and temperature in the Tarim basin, including the Chinese part of the Aksu basin, with a marked shift in the 1980s. They noted that there are variable signals at different climate stations. Tao et al. (Citation2011) concluded for the same region that annual mean temperature, precipitation, relative humidity and actual vapour pressure show positive trends from 1961 until 2008. Some authors (e.g. Shi et al. Citation2007, Zhang et al. Citation2012a) carried out trend analysis for large regions, such as the headwater part of the Tarim upstream of Alar, or the Xinjiang Province, by averaging T and P data from many stations. However, such an aggregated assessment is questionable, especially for precipitation, as it cannot reveal spatial differences, and it is more adequate to analyse trends station by station.
Others investigated in more detail the spatial and seasonal distribution of trends (Shangguan et al. Citation2009, Zhang et al. Citation2010, Tao et al. Citation2011). Zhang et al. (Citation2010) investigated trends in temperature and precipitation for 24 meteorological stations in the headwater catchments of the Tarim River basin for the period 1960–2005. While significant temperature increases (significance level 5%) were found over the whole basin, significant precipitation increases were only found in the northern part of the basin. Statistically significant increasing seasonal trends in temperature are mostly found in autumn and winter, while in spring and summer a lower number of stations showed significant increase. With respect to precipitation, significant increasing trends mostly occur in the warm season (April–September).
According to the analysis of Shangguan et al. (Citation2009) for 25 weather stations in the Tarim River basin, a warming of 0.77 ± 0.16°C (0.019°C year-1), and an increase in precipitation of 22.8 ± 7.9% between 1960 and 2000 were found for the region. However, these estimates definitely involve uncertainties, as only three climate stations in the basin are located at altitudes above 2000 m a.s.l., while only few glacier termini are located below 3500 m a.s.l.
The only high-elevation station in the region is the Tien Shan station situated close to the Ak-Shirak range in Kyrgyzstan at an altitude of 3614 m a.s.l. (, KG6982). It is also the highest station of the whole region. This station showed a warming of 0.01°C year-1 between 1950 to 1997, while there was only a slight decrease of 0.004°C year-1 between 1972 and 1997 (Bolch Citation2006, Giese et al. Citation2007). In contrast to the stations at lower altitudes in the Tarim basin, precipitation at this high-elevation station decreased since the 1950s until 1996 (Giese and Moßig Citation2004, Bolch Citation2006). Hence, it is questionable if the trends from the weather stations located in the Chinese part of the Tarim basin reported in the literature are also valid for the glaciated altitudes and can be linked to glacier changes.
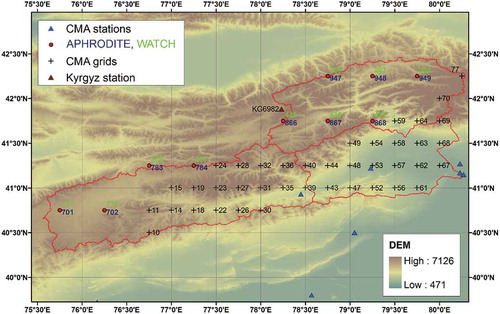
Fig. 2 Location of climate stations and grid points of interpolated CMA data, WATCH and APHRODITE data for the Aksu basin: the numbers of grid cells were created during the interpolation process.
2.2 River discharge
Most authors agree that river discharge of the Aksu River has been increasing in the last 50–60 years (Xu et al. Citation2007, Wang et al. Citation2008, Citation2010, Thevs Citation2011). According to Chen et al. (Citation2006), annual runoff from the headwaters of the Aksu and Yarkand rivers (another upper tributary of the Tarim) increased by 10.9% from the 1950s to the 1990s. Tao et al. (Citation2011) found more heterogeneous changes for the region, namely: the headwater stations of the Aksu: Xiehela and Shaliguilanke showed a significant increasing trend (at 1% significance level) during the period 1957–2008, while for the station Xidaquiao at Aksu City, the increasing trend was confirmed at a lower significance level (5%), and the Alar station on the main Tarim River, downstream of the confluence of the Aksu, Yarkand and Hotan rivers, showed a significant decreasing trend (though only at 10% significance level). On the seasonal time scale, Jiang et al. (Citation2007) found statistically significant (5%) increasing trends for summer and winter at Xiehela, and for autumn at Shaliguilanke (for the period 1957–2002). Tao et al. (Citation2011) and Hao et al. (Citation2008) attribute the decreasing trend at Alar to the increase in population and expansion of agricultural land for food and cotton in the oases along the river.
Some questionable findings on the Aksu catchment have also been reported in the literature. For example, in their assessment on river discharge, Zhang et al. (Citation2012b) found that the ‘natural discharge’ more than doubled in the last decade from 9.2 km3 in the 1990s to 19.2 km3 in the 2000s. However, the reported doubling of natural discharge resulted from erroneous data (Zhang, personal communication, Mar 2013), and really the average discharge in the 2000s was 9.1 km3, i.e. very similar to that in the 1990s.
The factors controlling changes in discharge are under discussion, as both glacier melt and precipitation influence water discharge under warmer and wetter climate conditions (Tao et al. Citation2011). Besides, the interrelationships between climate parameters and discharge have hardly been investigated before.
2.3 Glaciers
Existing studies on glaciers show that the glaciers in the entire Tien Shan and other mountain ranges surrounding the Tarim basin, as in other parts of the world, have been retreating since the end of the Little Ice Age (Savoskul Citation1997, Liu et al. Citation2006, Bolch Citation2007, Sorg et al. Citation2012). The recession has not been spatially and temporally homogenous over the whole region.
The highest glacier area loss with rates varying between approx. 0.4 and 0.8% year−1 for the period approx. 1970–2000 occurred in the outer and more humid parts of the Tien Shan (Bolch and Marchenko Citation2009, Narama et al. Citation2010), while the lowest shrinkage rates (approx. 0.03–0.3% year−1) were found for the highly continental glaciers in Central Tien Shan in Kyrgyzstan and northwestern China where the Aksu catchment is located for the similar period (Ding et al. Citation2006, Liu et al. Citation2006, Shangguan et al. Citation2006, Citation2009).
Almost insignificant changes of glacier area of only –1.3% were found for the Chinese part of the highly glaciated Central Tien Shan south of Tomur Peak (or Pik Pobedy in Russian, ) for the period approx. 1965–2000 (Shangguan et al. Citation2009), and slightly higher rates were reported for the Kyrgyz part of the Aksu basin (–3.7 ± 2.7%) between 1990 and 2010 (Osmonov et al. Citation2013).
However, glacier area changes show an indirect and delayed signal to climate (Bolch et al. Citation2012) and the response time of the mostly cold glaciers surrounded by permafrost can be several decades. In addition, according to the first Chinese Glacier Inventory (Shi et al. Citation2009) about 7% of the ice is (partly heavily) covered with debris. No specific data about debris cover is available for the Kyrgyz part of the catchment, but it is likely to be in a similar range (Osmonov et al. Citation2013). In general, thick debris cover reduces the glacier melt and, hence, further delays the response, and can explain formation of stable tongues even if ice is melting (cf. Bolch et al. Citation2011). Reduced melt in relation to debris thickness was confirmed by field measurements for Inylchek Glacier, one of the largest glaciers in the study region (Hagg et al. Citation2008).
The glacier mass balance and volume changes are the best indicators for glacier health, but respective information in the Tarim region is rare. The best investigated glacier is Urumqi Glacier No. 1 situated in eastern Tien Shan. This comparatively small glacier (not draining into the Tarim basin) shows average mass loss of 0.27 m water equivalent (w.e.) year-1, but with an increasing rate since the beginning of the measurements in 1959 (Jing et al. Citation2006, Wang et al. Citation2007, WGMS Citation2013). Consistent with the trend in area changes, the mass loss of this glacier is smaller than that of the other glaciers with mass balance measurements, located in the more humid parts of Tien Shan (WGMS Citation2008).
The geodetic mass budget estimates reveal specific mass loss of the glaciers in the Ak-Shyrak range located at the northwestern margin of the Aksu catchment of 0.56 ± 0.15 m w.e. year-1 (1977–2000, Aizen et al. Citation2006), and of the partly heavily debris-covered glaciers south of Tomur Peak of 0.33 ± 0.15 m w.e. year-1 (1976–2009). However, in recent years (1999–2009) a slightly slower mass loss of 0.23 ± 0.19 m w.e. year-1 could be observed for the latter region (Pieczonka et al. Citation2013). In line with this study, measurements of thickness changes of Keqicar Glacier (one of the largest glaciers in the Tarim region) revealed significant thinning of 0.5–1.5 m year-1 between 1981 and 2004 despite of a thick debris cover and a retreat of 2% of the area only (Xie et al. Citation2007). Duration of snow cover did not show significant changes during the last decades (Xiao et al. Citation2007, Dietz et al. Citation2013), but a slight tendency for earlier snowmelt was found.
More measurements, especially on glacier mass balance and volume changes, as well as new weather stations at high altitude, are needed in order to better understand the climate-driven glacier changes in the region.
2.4 Land use
Land use and land cover can be very important determinants of hydrological conditions, and information on their changes is vital for hydrological assessments. Land-use changes in the Aksu catchment (as well as in the remaining part of the Tarim basin) have been reported to be driven by the expansion of irrigated agricultural land since the 1950s (Liu and Chen Citation2006, Wang et al. Citation2010, Zhou et al. Citation2010, Thevs Citation2011, Zhang et al. Citation2012b). Most authors, however, focus on the increase in all types of agricultural land, rather than on the increase in irrigated land.
According to Zhang et al. (Citation2012b), the area of cultivated land increased from approx. 2300 km2 in 1950 to about 5000 km2 in 2000 and to approx. 5600 km2 in 2010 (numbers estimated from the graph), i.e. an increase of more than twice for the total 60 years period. This is the total cultivated area that can be attributed to the Aksu basin: upstream and downstream of the Xidaquiao gauge, before the Alar gauging station.
Miao (2005, cited in Wang et al. Citation2010), studied land cover changes in the Aksu basin for the period 1990–2000 using remote sensing data, finding an increase in the total cultivated area from 4803 km2 in 1990 to 5658 km2 in 2000.
Based on topographical data from 1960 and Landsat data from the mid 1970s, 1990 and 2008, Zhou et al. (Citation2010) reported an increase in cropland area from 2920 km2 in the 1960s to 3730 km2 in 1990 and 5450 km2 in 2008 (average increase over the period 1960–2008 of 1.3% per year). Bare land (including deserts, saline land and sand land) and permanent snow and ice showed decreasing trends (by 0.2% and 0.5% per year, respectively). They attribute these changes both to natural factors (e.g. decrease of ice and snow due to climate warming) and human induced factors, including policy changes and technological developments. From the beginning of the 1950s migration to the region from other Chinese provinces resulted in a strong population growth and expansion of agricultural land. Further expansion of the cultivated land was possible through the building of reservoirs and improving cultivation techniques, which allowed the reclamation of land previously unusable due to salinization problems (Zhou et al. Citation2010).
There were also significant changes in the type of crops: while grain crops were dominant until the mid 1980s, the share of cotton has notably increased after 1985, and since 2000 the area of fruit tree planting has been increasing, though cotton still occupies more than half of the total cropland area (Zhang et al. Citation2012b).
2.5 Methods used in the trend studies
The current research for the region addresses the trends through statistical methods, yet often fails to explain the findings and interpret the obtained results (e.g. Chen et al. Citation2006, Fan et al. Citation2011). Statistical approaches have been employed to analyse monotonic and shift trends, e.g. via the Mann-Kendall and Mann-Whitney tests (Changchun et al. Citation2007, Zhang et al. Citation2010, Fan et al. Citation2011). Conclusions are often purely based on the statistical findings, but thorough interpretation and process-related studies remain beyond consideration. For example, Chen et al. (Citation2006) and Xu et al. (Citation2006) found that the correlation coefficient of winter precipitation with river discharge (r2 = 0.65) in the Aksu is higher than that with summer temperature (r2 = 0.51). They concluded that changes in precipitation have a stronger impact on discharge than changes in temperature. More analyses on interdependencies between variables and physically-based approaches are needed to paint a more accurate and trustworthy picture of historical and current trends.
The discussion of shifts and abrupt changes and interpretation of changes from a particular year show the need to improve understanding and continue research on trends. For example, Chen et al. (Citation2007) and Wang et al. (Citation2010) found precipitation and temperature ‘shifts’ or ‘steps’ in the year 1986, and Tao et al. (Citation2011) concluded that precipitation and other hydrometeorological variables started to increase in 1986, and temperature in 1996 (i.e. 10 years later than the change point identified by earlier studies mentioned). The explanation of such findings and their usefulness to the water management community and for an enhancement of understanding of the hydrological system remain questionable.
As the literature on current trends reviewed above lacks consistency, the present contribution aims to add to the systematization of knowledge and clarification of some controversies.
3 CASE STUDY AREA
The Aksu River and its tributaries are mapped in . The Sary Djaz River originates in the northwest of the Khan Tengri massif, flowing south, where it gathers the Inylchek and Ak-Shirak rivers to become the Kumarik River in China. The Toshkan River originates in the west of the catchment, south of the Kyrgyz city of Naryn, flowing east into China. The name of the Aksu River (not the Aksu basin) is only used for the reach downstream of the confluence of the Kumarik and Toshkan rivers north of Aksu City.
Our study area is the Aksu River basin upstream of Aksu City. It can be subdivided into three sub-catchments according to the three available hydrological stations: two headwater sub-catchments upstream of the gauging stations Xiehela (S1) and Shaliguilanke (S2), and the lower part from S1 and S2 down to station Xidaquiao (S3) at Aksu City (see , the sub-areas are referred to hereafter by the station codes). The catchment characteristics including elevation, land cover (including glaciers) and soil types of the three sub-areas terminated by gauges S1, S2 and S3 are summarized in . The distance from the confluence of the Inylchek and Sary Djaz rivers to the Xiehela station (S1) is about 150 km.
Table 1 General characteristics of three sub-areas S1, S2 and S3 of the Aksu basin. The minimum value in the altitude range is the station elevation.
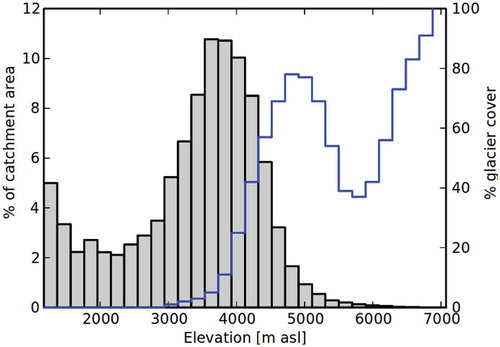
The headwater part is located at altitudes of 2000–7000 m with about 29% glacier cover in the sub-catchment S1 and 4% in S2. The elevation distribution including glacier cover of the basin upstream of S3 () shows that a major part of the catchment has an elevation above 3000 m. The glacier cover occurs from 3000 m upwards, and has two peaks in the elevation distribution curve, with a lower point at about 6000 m. The vegetation and agricultural land are mainly distributed along the rivers.
Fig. 3 Elevation and glacier cover distribution in the Aksu basin.
The Aksu River has a typical snow and glacier melt dominated regime, with more than 80% of annual discharge occurring in the warm season from April to September, and mean flow rates are about five times higher in the warm than in the cold season. The high summer discharge is also supported by the precipitation regime with predominant summer precipitation. Liu et al. (Citation2006) estimated that glacier meltwater contributes approximately 40% to the annual discharge of the Aksu River. Jiang et al. (Citation2005) provide their estimates on the share of glacier meltwater for two headwater sub-catchments: for the Xiehela gauge the share is 52.4%, and for the Shaliguilanke gauge it is 26.5% for the period 1957–2002. However, the numbers reported in the literature should be taken with caution, as they are based on rough estimates only, and there is a methodological subjectivity as snow on glaciers may be included in the glacier melt or counted as snowmelt (Sorg et al. Citation2012).
The lower reaches of the Aksu catchment support large linear river oases, with an area of 7900 km2 (located upstream and downstream of the Xidaquiao gauge) that are predominantly used for irrigated agriculture (Tang et al. Citation2007, Wang et al. Citation2010), and continue further in the course of the Tarim River. As the lower part is dominated by extensive irrigation agriculture, significant modifications to the natural streamflow have occurred there.
Large amounts of water are used for irrigation in the middle and lower parts of the Aksu River. The average annual discharge at Xidaqiao (S3) is notably lower than the total discharge of the two upper tributaries (see Section 5.2 for more details). In particular, the warm season from April to September is the major water extraction period, when the downstream river discharge is much lower than that of the upstream rivers.
4 DATA AND METHODS
4.1 Data
Climate data for the Chinese part of the basin were provided by the National Climate Centre, China Meteorological Administration (CMA) as a daily dataset of minimum, maximum and mean temperatures and precipitation at a 0.25° grid scale for China for the period 1961–2001. The data were interpolated from the observed climate records in China (see stations in ). The climate stations in China are located mainly at lower altitudes, and interpolation to higher altitudes probably introduces uncertainties.
The monthly temperature and precipitation dataset for the Kyrgyz station Tien Shan was provided for the period 1930–2001 by Kyrgyzhydromet (Giese and Moßig Citation2004). The daily dataset available for this station from NCDC (Citation2011) has many gaps, so that it was impossible to include these data in the analysis. Therefore, the monthly data from this station were analysed in our study, as it is a valuable high-altitude climate record including precipitation, minimum and maximum temperature. However, the station was relocated in the end of the 1990s complicating the trend analysis for the whole period. Therefore, we analysed data for trends only until 1996. In addition, no detailed analysis of homogeneity of the data was performed and no meta-information about the provided data was available so that the quality of the data from this station remains unclear.
In addition, the meteorological forcing dataset (based on ERA-40) WATCH Forcing Data 20th Century from the WATCH project (Weedon et al. Citation2011; http://www.eu-watch.org/) at a daily resolution was used for the Kyrgyz part of the basin. Five variables are available at 6-h resolution and five variables at 3-h resolution. Daily aggregated values were used in this analysis. Besides, precipitation data from the APHRODITE project were also used for the Kyrgyz part of the basin (http://www.chikyu.ac.jp/precip/).
In total, climate data for the following grid points were analysed:
40 grid points for CMA data covering the Chinese part of the basin;
10 grid points for WATCH data for the Kyrgyz part;
10 grid points for APHRODITE data (only P) for the Kyrgyz part; and
one climate station (Tien Shan) in Kyrgyzstan located very close to the studied basin.
shows the location of climate stations from which the CMA gridded data was interpolated, the CMA grid points, the Tien Shan meteorological station (KG6982), and the coinciding grid points used in WATCH and APHRODITE projects. Although they are shown and referred to as points, the interpolated climate data represent the average conditions of the grid cell with the centroids given in .
The daily river discharge data for the period 1965–1987 for stations Xiehela (S1), Shaliguilanke (S2) and Xidaquiao (S3) were obtained from the Hydrological Yearbook published by the Chinese Ministry of Water Resources. In addition, the monthly river discharge data for these stations were available for a longer period, from 1957 until 2004 (Wang, Citation2006). Besides, river discharge and water level data for the Inylchek Mouth station were provided for the operative years 1963–1967 and 1980–1981 by G. Glazirin (pers. comm.). After 1981 this gauging station was closed.
The climate and river discharge data from China were checked by applying the homogeneity analysis and other quality check tools.
4.2 Trend analysis
The trend analysis for climate parameters and river runoff time series was done using two methods: the linear regression and the Mann-Kendall test. For the linear regression the slope of the regression line and the standard error of slope were estimated. For both methods the statistical significance of the trend was calculated (p values). The Mann-Kendall is a test for monotonic trend in a time series based on the Kendall rank correlation. The open source software package R Development Core Team (Citation2008) for statistical computing was used to evaluate the statistical significance of trends. The significance of trends is indicated as follows: by one star (*) when p < 0.05, by two stars (**) when p < 0.01, and by three stars (***) when p < 0.001.
4.3 Correlation analysis using daily data
For the correlation analysis the standard methods of Spearman and Kendall were used to evaluate interdependence at daily resolution between the temperature/precipitation and river discharge time series.
The Spearman rank correlation coefficient is a nonparametric measure of statistical dependence between two time series or variables, assessing how well the relationship between them can be described using a monotonic function, even if their relationship is not linear. The Spearman correlation coefficient is calculated between the ranks of variables using the usual Pearson correlation coefficient formula.
The Kendall rank correlation coefficient is used to express the association between two measured quantities or samples. It provides a non-parametric hypothesis test for statistical dependence between two time series or variables. It is a measure of rank correlation, representing the similarity of the orderings of the data when ranked by each of the quantities.
As for the trend analysis, the software package R was used to calculate the Spearman and Kendall correlation coefficients.
4.4 Climate elasticity of streamflow
Climate elasticity of streamflow describes how sensitively streamflow responds to changes in climate variables. This concept was introduced by Schaake (Citation1990). Most of the studies on climate elasticity of streamflow estimate the sensitivity of streamflow to changes in precipitation. Precipitation elasticity of streamflow is larger than 1 if 1% change in precipitation leads to more than 1% change in discharge, and smaller than 1 if 1% change in precipitation leads to less than 1% streamflow change. Negative values of climate elasticity mean that an increase in precipitation is associated with a decrease in discharge (or vice versa). The higher the elasticity, the more sensitive a catchment is to precipitation changes (reason for concern for water resources management).
We derived the sensitivity of streamflow directly from observations. One the one hand, this approach has the advantage that there is no need to implement a hydrological model which introduces additional uncertainties when estimating climate elasticity. On the other hand, the direct estimation of climate elasticity from observations assumes that the relation between temperature, precipitation and discharge in a given catchment is constant in time, and this observation-based approach is not able to model the complex space–time variations in hydrological processes. For a discussion on model and observation-based approaches see Sankarasubramanian et al. (Citation2001).
Fu et al. (Citation2007) criticized that the widespread use of precipitation elasticity focuses on changes in precipitation only and neglects sensitivity to temperature. They and Risbey and Entekhabi (Citation1996) visualized the sensitivity of streamflow to changes in precipitation and temperature in a two-dimensional (2D) contour plot. We applied this extended concept of climate elasticity and established contour plots based on the anomalies of temperature, precipitation and streamflow, showing the percentage change in discharge as a function of changes in temperature and precipitation. The analysis was restricted to the warm season (April–September) only, because precipitation and river discharge are much higher in this season. There is little precipitation in the winter half-year, and, moreover, a large fraction of precipitation is stored as snow and does not contribute to runoff during the winter months. Precipitation is approximately four times higher in the warm season in both sub-catchments, and discharge is about six times higher in the warm season at the Xiehela and Shaliguilanke stations.
To derive anomalies in climate parameters and streamflow, temperature and precipitation data were averaged over sub-catchments corresponding to the Xiehela and Shaliguilanke gauges for the period 1961–2001. After that, temperature, precipitation and river discharge were averaged over the warm season. For each warm season of the observation period (1961–2001) the departure from the mean value (or anomaly) was calculated for temperature, precipitation and river discharge, e.g. for discharge:
where Qi is the average summer discharge in year i, and is the mean seasonal discharge of the period 1961–2001.
These anomalies were used to derive contour plots, showing the percentage change in discharge as a function of changes in temperature and precipitation. To obtain a smooth response surface, a LOWESS model (Cleveland Citation1979) was applied. For this locally weighted linear least-squares regression, the regression weights are given by:
where x = (x1, x2) is the location in the 2-dimensional space (change in precipitation, change in temperature) for which the response value, i.e. change in discharge, is to be estimated; wi is the weight with which the observed data point xi is considered in the linear regression; and d(x) is the distance in the 2D space from x to the most distant predictor value within the span. The span specifies the percentage of the data points that are considered for estimating the response value at x. Details about the LOWESS method and about choosing its components (such as weight function and span) are given in Cleveland (Citation1979) and Cleveland and Loader (Citation1996).
The choice of the span determines the smoothness of the response surface. We use a span value of 0.9, hence 90% of the data are used for the local regression. This choice leads to a smooth response surface and reflects our intention to understand the global behaviour of the two sub-catchments when relating changes in discharge to changes in precipitation and temperature.
5 RESULTS
5.1 Trends in temperature and precipitation
Trends in temperature and precipitation were analysed for data from all available sources: daily data from CMA, WATCH and APHRODITE, and monthly data for the Tien Shan station in Kyrgyzstan (KG6982). Trends were analysed for the period 1961–2001 using the Mann-Kendall test and the linear model trend test.
5.1.1 Temperature
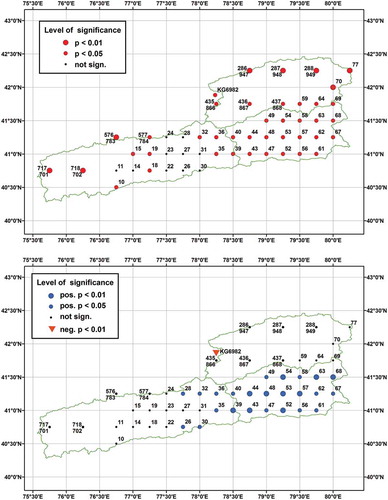
The temperature trends for all grid points were positive and for most of them statistically significant. The results for changes in temperature in terms of statistical significance are shown in (top). The statistically significant positive trends were found for 30 out of 40 grid points in the Chinese part for the period 1961–2001. The average increase for the 30 stations was 0.017°C year-1, equivalent to 0.66 ± 0.012°C in 40 years, or 0.83 ± 0.01°C in 50 years. All grid points without a significant trend (11–14, 22–31) are located in the western Chinese part of the basin (sub-catchment S2). The test based on the linear model showed a higher significance than the Mann-Kendall test. The temperature trends in the Kyrgyz part using WATCH data were statistically significant for all 10 virtual stations and higher than in the Chinese part: on average 0.026°C year-1, i.e. 1.027 ± 0.016°C in 40 years, or 1.287 ± 0.016°C in 50 years. The significance level for the Kyrgyz part was slightly higher than for the Chinese part. The temperature trend for the Tien Shan station was also positive and statistically significant but showed a lower rate: 0.01°C year-1, equivalent to 0.32 ± 0.006°C in 40 years, or 0.39 ± 0.006°C in 50 years.
Fig. 4 Statistical significance of positive trends in temperature (top) and of positive and negative trends in precipitation (bottom) in the Aksu basin according to the Mann-Kendall test for the period 1961–2001: the numbers of grid cells were created during the interpolation process.
5.1.2 Precipitation
The results in terms of significance of trends for precipitation for the period 1961–2001 are shown in (bottom). Positive statistically significant trends for precipitation were found for 24 or 30 out of 40 grid points in the Chinese part (mainly in the S3 sub-area), where CMA data was used, for the Mann-Kendall and linear model tests, respectively. The average increase for the 24 stations was 1.04 mm year-1, equivalent to 41.5 ± 0.8 mm in 40 years, or 51.9 ± 1.0 mm in 50 years. The trends are not statistically significant by both tests for points located in the western part (sub-catchment S2) and at the eastern boundary between sub-catchments S1 and S3. The precipitation trends in the Kyrgyz part using APHRODITE and WATCH data were all statistically insignificant. This conforms to the results found for Chinese grid points located close to the boundary of the two countries.
The Tien Shan station has a statistically significant negative trend in precipitation for the period 1930–1996 (years after 1996, when the station was relocated, were excluded), with a quite strong decline from 1989 onward: from 331 mm on average in 1930–1970 to 306 mm on average in 1971–1987, and to 187 mm on average in 1988–1996. The average decrease for this station for the period 1930–1996 was 1.5 ± 0.01 mm year-1, i.e. 102.6 ± 0.8 mm in 67 years. The average decrease for the sub-period 1977–1996 was 8.1 ± 0.3 mm year-1, equivalent to 162.8 ± 6.03 mm in 20 years. This decreasing trend is significant on the 0.05% level. This is in line with the previous results obtained for this station (Giese and Moßig Citation2004, Bolch Citation2006). However, as the quality of data for this station is not known (see Section 4), these results should be treated with precaution.
Besides, such a notable precipitation decrease at Tien Shan station along with the increased temperature would lead to marked mass loss of glaciers. However, the only available source for the Ak-Shirak close to the station reveals a mass loss that does not exceed the global average (Aizen et al. Citation2006, Zemp et al. Citation2009).
In addition, data from the Tien Shan station from the recent period (1997–2010) show a clear precipitation increase (Osmonov et al. Citation2013).
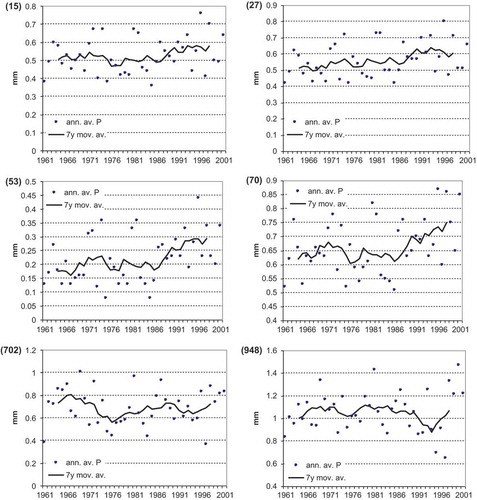
and show examples of T and P dynamics along with 7-year moving averages for six selected grid points in the region. The graphs demonstrate the observed increasing trends or their absence. From six examples for T in only one point (27) did not show a significant trend, and two examples for the Kyrgyz part (points 718 and 287) show some oscillatory behaviour. From six examples for P in , only one point (53) shows a significant trend estimated by both methods, and three examples (points 15, 702 and 948) do not show statistically significant trends.
Fig. 5 Annual average temperature and 7-year moving averages for grid points: 15, 27, 53, 70, 718 and 287. From these examples only one point (27) did not show significant positive trend.
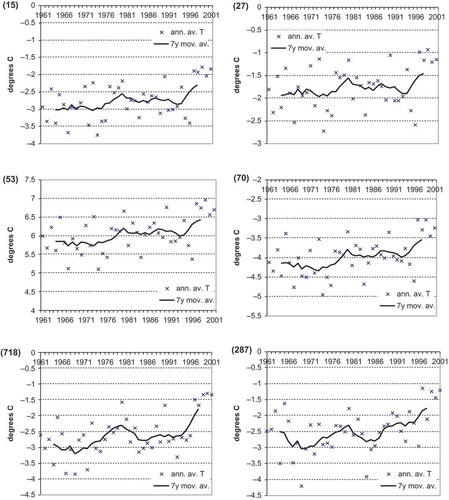
Fig. 6 Annual average precipitation and 7-year moving averages for grid points: 15, 27, 53, 70, 702 and 948. From these examples only one point (53) shows significant trend estimated by both methods, and three points (15, 702, 948) do not show statistically significant trends.
The trends in temperature and precipitation obtained for the Aksu region mostly agree with the previous results described in Section 2, though for precipitation some spatial differences were found that were not reported before, and spatial resolution in our study was finer than in most of the previous studies.
5.2 Trends in river discharge and anomalies in climate parameters and river discharge
The trends in river discharge were analysed using monthly data for the period 1957–2004 for the gauging stations S1, S2 and S3 separately for average monthly values, average seasonal values (cold season: October–March and warm season: April–September), and for the annual means. The results are summarized in .
Table 2 Significance of annual, seasonal and monthly trends in water discharge for gauging stations Xiehela (S1), Shaliguilanke (S2) and Xidaquiao (S3) for the period 1957–2004 (MK p: p value for the Mann-Kendall test, LM p: p value for the linear model test).
The annual trends in river discharge are positive and highly significant by both methods for all three gauge stations (S1, S2 and S3). Similar results—significant positive trends for all three gauges—were found for the warm season trends. For the cold period, two stations, S1 and S2, also showed significant increasing trends in river discharge, but there was no significant trend at station S3. The statistically significant seasonal trends in river discharge for S1 and S2 are shown in .
Fig. 7 Seasonal trends in water discharge for the gauging stations Xiehela (S1) and Shaliguilanke (S2) for the period 1957–2004.
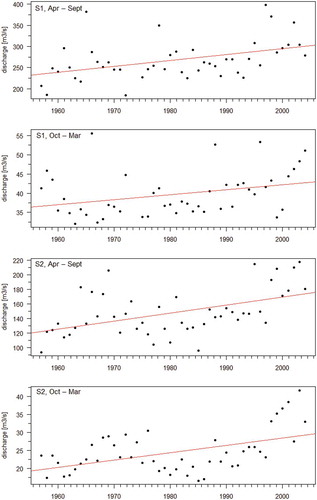
The monthly trends for S1 are all positive and significant, according to the Mann-Kendall test, for all months except April–June, with the lower level of significance when using the linear model test (significant only for 5 months). The highest significance of trends was estimated for January–February and July–August by both methods.
The monthly trends for S2 are also all positive and significant, according to the Mann-Kendall test, for all months except August, again with a lower level of significance when the linear model test was used (insignificant for 3 months). The highest significance of trends was estimated for July, October and December by both methods.
For S3, the monthly results by both methods are almost fully consistent: for 7 months the trends are statistically significant according to both tests. For 4 months—February, March, July and November—the monthly trends are statistically significant for all three stations, according to the Mann-Kendall test.
The increasing trends in river discharge agree in general with the results presented in literature and described in Section 2, though in our study a multiple time resolution was used, and spatial differences were investigated in more detail using all available data.
5.3 Analysis of difference in river discharge between three gauges
An additional analysis of water balance was conducted for the lower part of the study area, between gauges S1, S2 and S3, in order to evaluate the anthropogenic water use on the average monthly and average annual scales. The sum of monthly discharges at the two upstream gauges, S2 and S1, was compared to the monthly discharge downstream at the S3 gauge for the period 1997–2004, referring the difference to the inflow from upstream (). It was found that the average annual discharge of Aksu at the lower gauge (S3) is about 18% lower than inflow from the two upper tributaries in this period. This gap can be explained by water abstraction, mainly for irrigation of arable land, and is particularly pronounced (from –48% to –23%, see ) in the main irrigation period, from April to July. In the winter months when the influence of water abstraction is minor, the river flow is more natural with higher discharge downstream than upstream.
Table 3 Comparison of average monthly and average annual discharges at the two upstream gauges Shaliguilanke and Xiehela and the downstream gauge Xidaqiao for the period 1997 to 2004. Deviation means difference between the value for Xidaquiao and the sum of discharges at two tributaries divided by the sum of discharges at two tributaries.
To confirm this, the difference between water inflow in S1 and S2 and discharge at S3 was compared with water use for irrigation measured in irrigation channels in the area between these three gauges (data from Wang Citation2006) for the period 1998–2003. Both values were similar: 1584 × 106 m3 is the difference and 1877 × 106 m3 is water use for irrigation, verifying that diverted water for irrigation is responsible for the difference in discharge between the upper tributaries and Xidaquiao, and there are no any significant natural water losses. The larger value measured at irrigation channels may be explained by additional water inflow from the lower part of the basin (below S1 and S2). This provides the evidence that the decrease in discharge between the two upstream gauges and Xidaquiao is mainly attributable to the abstraction of river water for irrigation of agricultural land.
The difference between the upstream inflows and the downstream outflows was relatively stable over the period 1957–2004: it was 16% at the end of 1950s, increased to 20% in the period 1961–1980, then decreased to 13% in the 1980s, and increased again to 18% on average in 1991–2004 (based on data from Wang Citation2006). This can be explained by the interplay of different influencing factors, such as increase in efficiency of water use for irrigation (lower water demand), increase of irrigated area (higher water demand), and increasing trend in water discharge during this period (the same percentage means larger water abstraction).
5.4 Interrelationships between climate parameters and river discharge
Interrelationships between climate parameters (T, P) and river discharge (Q) were analysed for the headwater parts S1 and S2 using daily data. It was not done for the S3 part, as this area is heavily influenced by water abstractions for irrigation. For the analysis, temperature and precipitation were averaged over the corresponding sub-catchment areas.
Only a low and mostly not statistically significant correlation was found between daily precipitation and daily river discharge for both S1 and S2. It is understandable, as the Aksu River is to a large extent fed by melting water from snow and ice (see above), and therefore there is no fast response of discharge to precipitation, not even in summer time.
Regarding the interrelationship between temperature and river discharge, an interesting feature was found, being rather unusual for river basins in other climatic zones. It will be demonstrated by the example of sub-catchment S1 (Xiehela) and later discussed shortly for the sub-catchment S2.
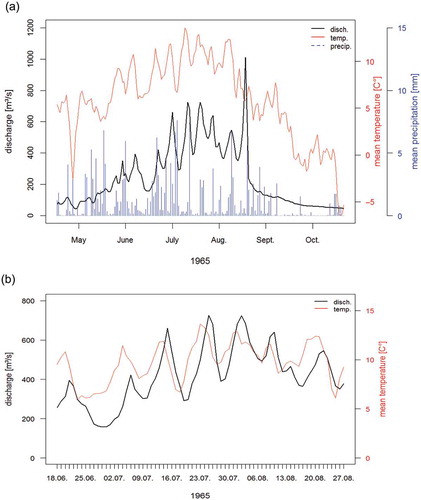
A visual analysis of T and Q time series for Xiehela in the period 1965–1987 (see an example for 1965 in ) revealed a noticeable positive interdependency between temperature and discharge peaks in summer, except for short periods with high peaks at the end of summer or beginning of autumn (mostly in August), where correlation is not evident. Besides, a time lag of 1–3 days for Q peaks after T peaks could be noticed. For these short periods at the end of the warm season even a negative connection was observed in some cases: high peaks above the 95th percentile occur with a decline in temperature.
Fig. 8 Observed dynamics of (a) average temperature, average precipitation and river discharge from the 1st of May until end of November in 1965 for the Xiehela gauge station, and (b) time series of temperature and water discharge for this station for the period 17.6.1965–26.8.1965.
To analyse the relationship between T and Q, a correlation analysis was performed for the years 1965–1987 between both time series for summer periods from 1st of June until 31st of August or longer, if high peaks above the 95th percentile were still observed. The short periods without visible correlation were separated from the longer periods in summer, and both were analysed separately. The longer periods were 78–116 days long, and the shorter periods were 8–14 d. For a few years no periods without visible relationship between T and Q were found (1975, 1977–1979, 1981).
The results of the correlation analysis using method of Spearman are presented in and for the longer periods and the shorter periods, correspondingly. The Kendall method was also used, and the results were similar (not presented). As follows from , a strong and highly statistically significant (level 0.001) positive correlation exists between temperature and river discharge for the longer periods in summer with no delay and with delays of 1, 2 and 3 d. The coefficients of correlation tend to increase from the ‘0 d delay’ case to the ‘2 d delay’ case (e.g. reflected by the increase of the mean Spearman coefficient for the whole period from 0.71 to 0.83). The results are stable for all years. In contrast, for the shorter periods the correlation is almost always low and not statistically significant, and sometimes the correlation coefficient is negative (). Thus, it was confirmed that there is a statistically significant positive correlation between T and Q during the longer periods in summer, and no significant correlation for the short periods with 1–2 peaks at the end of summer or beginning of autumn for the Xiehela gauging station.
Table 4 Correlation coefficients between temperature and water discharge based on the Spearman method for summer periods (see text for explanation) in the period 1965–1987, with 0, 1, 2 and 3 days delay. All entries are significant at the level 0.001 indicated by***.
Table 5 Correlation between temperature and water discharge based on the Spearman method for short periods in late summer/autumn in 1965–1987; level of significance: * 0.05, ** 0.01,*** 0.001.
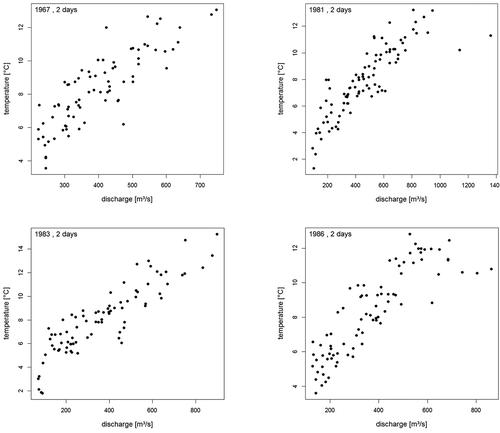
The results of the correlation analysis between T and Q for the longer periods in summer are presented in and . shows scatter plots of temperature and river discharge for the longer period in 1965 with no time delay, and delays of one, two and three days, and shows scatter plots of T and Q for longer periods for four selected years with the time delay of 2 d (highest correlation).
Fig. 9 Scatter plots of average sub-catchment temperature and river discharge at the Xiehela gauge station for the summer period of 1965 with 0, 1, 2 and 3 d delays, and the corresponding Spearman correlation coefficients.
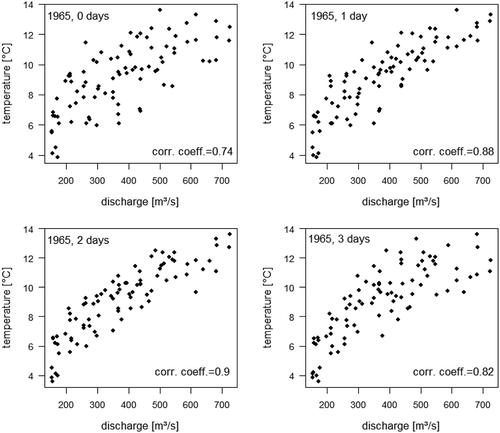
Fig. 10 Scatter plots of average sub-catchment temperature and river discharge at the Xiehela gauge station for the summer periods of four selected years with 2 d delay.
How can these results be interpreted? The high positive correlation between daily time series of T and Q is rather unusual for river basins in the temperate zone, but it is understandable for the Xiehela gauge in the Aksu basin, where water is coming mostly from snow and glacier melt in the high mountains.
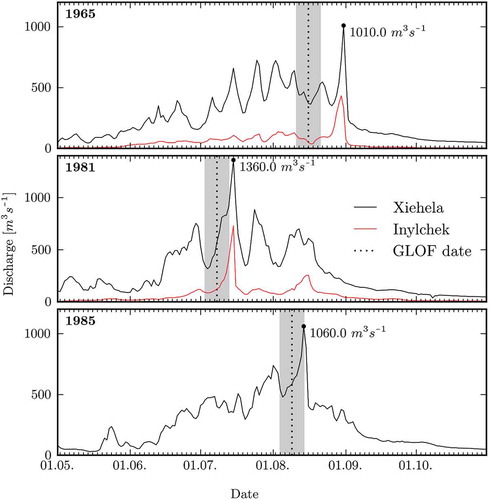
The explanation of short periods with high peaks in river discharge at the end of the warm season, when temperature starts to decline can be found in the literature. Glazirin (Citation2010) provided a review of the glacier lake outbursts of the ice-dammed Merzbacher Lake, based on observation data from the beginning of the 20th century until the present. This lake is located in the headwater part of the Aksu in the Inylchek Valley (). Glazirin describes the process as follows: in summer melting water from the northern Inylchek Valley fills the lake and when the system of englacial channels in the damming glacier opens, water flows through the main Inylchek Glacier westwards into the Inylchek Valley. From the Inylchek mouth the water flows further to the Chinese part of the basin and after 150 km reaches the Xiehela gauging station. The water release from the lake now occurs mainly in August or September. There is even some evidence according to Glazirin (Citation2010) that the outbursts tend to now occur earlier than in the 1930s, having shifted from October to August. However, Glazirin also states that the volume and timing of water release are almost unpredictable, and sometimes outbursts can also happen in spring, and (rarely) twice in a single year.
According to Glazirin (Citation2010, and personal communication), river discharge and flood (caused by the Merzbacher Lake outburst) measurements in the Inylchek River were only taken for a period of 6 years (see graphs in the cited paper). Fortunately, for four of them we have water discharge measurements in the Xiehela station, and can compare both:
In 1965 the Inylchek station recorded the flood event after 26 August (max Q = 433 m3 s-1 was recorded on 30 August), and the highest flood at Xiehela (Q = 1010 m3 s-1) was recorded on 31 August.
In 1966 the high water level was measured at the Inylchek station at the end of July, and the highest flood of 923 m3 s-1 at Xiehela was recorded on 2 August.
In 1980, two high floods, with a maximum of about 600 m3 s-1, were recorded at Inylchek on 25–27 May, and on 9–11 September, and the highest floods at Xiehela were observed on 27 May (1090 m3 s-1) and 12 September (886 m3 s-1). Glazirin (Citation2010) explains the mid-May flood in 1980 by the possibility that the lake was probably not entirely filled in autumn 1979 and due to that it released water only in May 1980.
In 1981 the Inylchek station recorded a flood event around 13–15 July (max Q = 730 m3 s-1), and the highest flood at Xiehela (1360 m3 s-1) was recorded on 15 July.
The variation in timing between glacier lake outburst floods (GLOF) and peaks at the Xiehela gauge could be (as mentioned in the cited paper) due to arbitrary reporting of the outbursts by different observers, i.e. between the very beginning and the peak of the event.
Besides, Glazirin (Citation2010) collected the dates of the observed Merzbacher Lake outburst floods from different sources and listed them in his paper. For the period 1964–1987 the list includes 14 events, sometimes two per year, and there are also some missing years (probably, no observations in some years, e.g. all years 1971–1977). Reporting of the outburst was quite arbitrary depending on the different observers. Although the dates generally refer to the onset of the flood in the Inylchek Valley, they may also refer to first signs of the outburst at the lake’s dam. Some dates may also be misreported. The time from the first leak until the peak discharge may be several days due to the buffer effect and cavity opening of the South Inylchek Glacier, which is a complex and highly variable process. Bearing in mind this uncertainty, the GLOF dates can be compared with the observed peaks in river discharge at the Xiehela station.
lists the highest annual peaks as observed at the Xiehela gauging station in the period 1964–1987, along with the dates of GLOFs from Glazirin’s table. As one can see, the maximum of peaks at Xiehela (most of them are above 95th percentile, 1085 m3 s-1) occur about 5–12 days after dates of the recorded GLOFs in the Inylchek Valley, and most probably include their water as large portions.
Table 6 Xiehela: highest annual peak discharge (peak and end of receding limb dates) in the period 1964–1987 and the corresponding dates of GLOF at Inylchek recorded by Glazirin (Citation2010). Reported dates are subject to high uncertainty due to arbitrary and partly false reporting. See text for more explanation.
In addition, shows the observed river discharge at Xiehela and the dates of GLOFs cited in Glazirin (Citation2010) for three summers. For two of three years, 1965 and 1981, the observed river discharge at the Inylchek Mouth is included. In 1981 the reported dates match the flood onset at the Inylchek Mouth, and this is also true for the 1985 flood at Xiehela. Peak discharge occurs 7 and 5 d after (at both stations in 1981). In 1965 the reported date is 16 d earlier than peak discharge. The reported date in this case may refer to early signs of the ice-dam breach observed. A slower than usual cavity opening and longer storage times within the South Inylchek Glacier may also be a cause for this delay. The time lag of peak discharge between the Inylchek Mouth and Xiehela stations is typically 0–1 d for the seven GLOF data available at both stations. This corresponds well with our estimates of the water routing time between these two stations (150 km) of 14–20 h.
Fig. 11 River discharge at the Xiehela and Inylchek Mouth gauging stations from May until November for selected years (no data available for Inylchek in 1985). Dates of GLOFs with ±5 d uncertainty bands (dashed line, grey bands) as reported by Glazirin (Citation2010) and peak discharges at Xiehela (annotated) are given.
So, the missing correlation between T and Q at Xiehela for the short periods at the end of summer can be explained as follows: the GLOFs occur after a long warm season (probably as a result of accumulated warming), when temperature already starts to decline, and not as a fast response to higher temperature. Therefore the daily T and Q time series for these short periods do not correlate.
The correlation between daily temperature and daily river discharge for the S2 sub-catchment, station Shaliguilanke, in summer was also high and statistically significant, but lower than for Xiehela. Average Spearman correlation coefficients for the whole period were 0.71 and 0.60 without time delay, and 0.83 and 0.66 with 2 d time delay for Xiehela (S1) and Shaliguilanke (S2), respectively. This can be explained by the notably higher share of glacier cover in the S1 sub-catchment and thus higher influence of snow and glacier melt processes in this sub-catchment.
Besides, there were no unusual high peaks and short periods without correlation between T and Q found for S2. The Merzbacher Lake and GLOFs are specific features of the sub-catchment S1, and for S2 similar effects either do not exist or are much smaller.
This analysis allows us to reach the following conclusions:
statistically significant correlation between T and Q was found in the headwater parts of the Aksu: for sub-catchments S1 (long periods in summer) and S2 (whole summer periods), and
high peaks at the end of summer or beginning of autumn in the Xiehela (during periods that do not show correlation with T) are to a large extent caused by glacier lake outburst of the Merzbacher Lake.
5.5 Climate elasticity of streamflow
The approach for visualizing climate elasticity of streamflow described in Section 4 was applied for two sub-catchments, terminated by Xiehela and Shaliguilanke. shows the change in the warm season streamflow (April–September) as function of changes in precipitation and temperature for these sub-catchments. It has to be noted that the streamflow surface is estimated across the whole range of observed precipitation and temperature anomalies. The observations are additionally included in to show the areas where data are sparse and the streamflow surface more uncertain.
Fig. 12 Contour plot of percentage runoff change during the warm season (April–September) as a function of percentage precipitation and temperature change in the same season for (a) Xiehela and (b) Shaliguilanke. Points show observations.
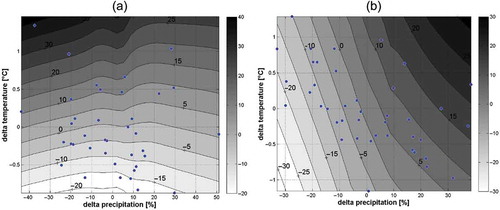
For Xiehela (), the change in streamflow shows strong gradients along the temperature axis. Positive streamflow anomalies are associated with positive temperature anomalies, i.e. years with warmer summer season show higher discharge. Changes along the precipitation axis are small. This overall behaviour illustrates that changes in summer streamflow in Xiehela are clearly dominated by changes in temperature. Since the temperature effects on streamflow override the precipitation effects, the climate elasticity values are not very informative for Xiehela. There are even areas in the precipitation–temperature plane with negative values (e.g. the lower right quadrant, where a decrease in streamflow is associated with an increase in precipitation). This is no surprise, in view of the dominant role of temperature which overrides the effect of precipitation in this catchment and at this time scale.
Climate elasticity for Shaliguilanke () shows a very different pattern. The contour lines have stronger gradients along the precipitation axis, although there is a slight increase in streamflow with increasing temperature. Climate elasticity is smaller than 1 for most parts of the temperature–precipitation plane, and there are no areas with negative climate elasticity values. Overall, this plot shows that seasonal streamflow response to changes in climate in Shaliguilanke is more influenced by changes in precipitation compared to the Xiehela sub-catchment. The comparison of both patterns illustrates the substantial differences in the warm season hydrology of these both sub-catchments.
It is interesting to compare these results for average seasonal values with the dominant role of daily temperature on daily streamflow for both Xiehela and Shaliguilanke stations described in Section 5.4. In both sub-catchments there is a very high correlation between daily temperature and daily discharge, and a very weak correlation between daily precipitation and daily discharge. The same is seen at the seasonal time scale, i.e. for warm half-years, for Xiehela. However, for Shaliguilanke the correlation results between mean warm season values are different, namely: the correlation coefficient between temperature and discharge is negative (Spearman’s rank correlation: −0.24, not significant), whereas it is positive between precipitation and discharge (Spearman’s rank correlation: 0.48, significant at the 1% level).
How can such results be interpreted? For Xiehela, with its large fraction of glacier area, temperature dominates the streamflow behaviour at the daily, monthly and seasonal scales. Changes in precipitation are not transferred to corresponding changes in discharge, since precipitation is stored in glacier and snow areas, and streamflow is controlled mainly by temperature. For Shaliguilanke, temperature is also more important for the daily dynamics, but precipitation plays a more important role at the seasonal time scale. Due to the much smaller glacier area and the lower topography in this sub-catchment, the effect of precipitation storage across years is small and the warm season precipitation is mostly transferred to streamflow in the same season.
6 SUMMARY AND CONCLUSIONS
The international Aksu River, a tributary of the Tarim, is of vast importance in the intense oasis agriculture in Xinjiang. While the climate in the Aksu River basin is arid to hyper-arid, it is the precipitation, glacier and snowmelt in the headwaters of the Aksu River and its tributaries that provide precious water resources for agricultural production.
Our study demonstrates that climate variability and climate change play a crucial role in this vulnerable system. Having examined the existing references in the literature and placed them in perspective, this contribution analysed changes in climatic variables: temperature and precipitation, as well as in river discharge. Besides, interdependencies between climate parameters and river discharge were analysed.
Ubiquitous warming has been detected and in most grid points it is statistically significant. Also, increase in precipitation has been detected, mostly statistically significant in the Chinese part of the basin. However, the precipitation measurements at the high-elevation Tien Shan station show a decrease until the mid 1990s, and data for the recent period (1997–2010) show a clear precipitation increase (Osmonov et al. Citation2013). This analysis gives us a spatially distributed overview of the climate trends in the Aksu basin, even though it has to be taken into account that using gridded products for trend detection has some drawbacks (Unger-Shayesteh et al. Citation2013), as changes in the number of contributing stations over time can influence the detected trend, and all available gridded products are based on a limited number of stations in this region.
The glaciers in the region have been retreating since the end of the Little Ice Age with a pronounced retreat in recent decades that is in line with many other glaciated regions in the world, such as the Alps (Paul et al. Citation2004) and the Himalaya (Bolch et al. Citation2012), but the recession has not been spatially and temporally homogeneous. The glacier shrinkage in the Aksu basin is significant but lower than in the more humid outer parts of the Tien Shan. Glacier shrinkage is likely the consequence of the temperature increase, as in many other parts of the world.
However, glacier area changes usually show an indirect and delayed signal to climate (Bolch et al. Citation2012), and the response time of the mostly cold glaciers surrounded by permafrost can be several decades. Hence, more and detailed measurements of the climate parameters in high altitudes and both in situ and remote sensing-based mass balance measurements are needed in order to better understand the climate–glacier relationship and to improve the knowledge on the glacier contribution to the total runoff and the projections of future discharge.
The annual and seasonal trends in water discharge (for both cold, October–March and warm, April–September seasons) in the headwater stations S1 and S2 demonstrate an increase. Attribution hypothesis of changes in river discharge can be as follows. A clear link was demonstrated between daily temperature and daily river discharge dynamics in summer for the Xiehela and Shaliguilanke sub-catchments, with a 1–3 d time lag (temperature peaks preceding discharge peaks), while no significant correlation between daily precipitation and river discharge can be observed.
It was also found that although correlation between daily temperature and daily river discharge is high for summer periods in the Xiehela station, it breaks over short periods in the end of summer or beginning of autumn, due to outburst floods of the Merzbacher Lake. This feature is a challenge for the climate impact assessment in the region, as these regular outbursts have to be represented in the projections for future as well, but due to poor data and insufficient process understanding could hardly be included in the modelling framework. A better understanding of the mechanism triggering the Merzbacher Lake outburst floods is needed for a reliable climate impact assessment in the Aksu basin, and requires further investigations.
The measured river discharge at the lowest gauge station, Xidaquiao, was on average about 18% lower in the studied period 1997–2004 than the sum of river discharges at two upper stations, resulting from a high water use for irrigation of agriculture land.
Some results depend on the time scale. In both headwater sub-catchments Xiehela and Shaliguilanke, a very high correlation between daily temperature and daily discharge, and a very weak correlation between daily precipitation and daily discharge were found. However, at the seasonal time scale, only for Xiehela, the same linkages were confirmed, whereas for the Shaliguilanke an opposite connection was found: a statistically significant correlation between average seasonal P and Q. It can be concluded that in both headwater parts the temperature dominates streamflow behaviour at the daily time scale, but at the seasonal scale for Shaluguilanke precipitation plays a more important role than temperature. It is explained by the much smaller glacier fractional area and the lower topography in this sub-catchment and, hence, a less significant effect of precipitation storage across years.
The availability of observation records in the study region is not satisfactory for a variety of reasons. The Aksu is an international river, located in Kyrgyzstan and in Xinjiang, China. The international nature of the river and its basin is a drawback in research, as data are less available and less internationally shared than elsewhere. Shrinking monitoring networks reflect the systemic (economic and political) changes. Furthermore, the headwater area in high, uninhabited mountains is difficult to access and poorly gauged. Since the topography is complex, spatial aggregates are not representative for many processes. As there is only patchy information on the glacier mass balance and volume change, uncertainty is high.
The conclusions from our study can be briefly formulated as follows:
An increasing temperature trend was confirmed for all climate grid points (on average 0.62°C in 40 years for the Chinese part, and 1.03°C for the Kyrgyz part), but the trend is not statistically significant for some stations in the western part of the basin;
the precipitation dynamics also show increasing and statistically significant trends for most grid points in the Chinese part (on average 43 mm in 40 years), but no statistically significant trends in the western and Kyrgyz parts of the basin;
the annual and warm-season seasonal trends in river discharge are positive and statistically significant for all three gauges;
the average annual discharge of the Aksu at the lower Xidaquiao gauge was about 18% lower than inflow from the two upper tributaries in the period 1997–2004 mainly due to water abstraction for irrigation of arable land;
for the Xiehela and Shaliguilanke stations, a clear link was demonstrated between daily temperature and lagged (by 1–3 d) daily river discharge in summer time; and
for Shaliguilanke station, a significant correlation between average seasonal precipitation and river discharge was found; the analysis of elasticity along with the correlation analysis results show that seasonal streamflow response to changes in climate in Shalquilanke is more influenced by changes in precipitation compared to the Xiehela sub-catchment.
The high, over 95th percentile, peaks at the end of summer or beginning of autumn at the Xiehela station (the corresponding periods are not correlating with daily temperature) are to a large extent caused by the glacier lake outburst floods of the Merzbacher Lake.
Disclosure statement
No potential conflict of interest was reported by the author(s).
Acknowledgements
The authors are very grateful to Gleb Glazirin who provided observational data for the Inylchek Mouth station.
Additional information
Funding
REFERENCES
- Aizen, V.B., et al., 2006. Glacier changes in the central and northern Tien Shan during the last 140 years based on surface and remote-sensing data. Annals of Glaciology, 43, 202–213. doi:10.3189/172756406781812465
- Bolch, T., 2006. GIS- und fernerkundungsgestütze Analyse und Visualisierung von Klimaänderung und Gletscherschwund im nördlichen Tien Shan mit einem Vergleich zur Bernina-Gruppe/Alpen, Erlangen, 210 S. (http://www.opus.ub.uni-erlangen.de/opus/volltexte/2006/447/), pp. 210.
- Bolch, T., 2007. Climate change and glacier retreat in northern Tien Shan (Kazakhstan/Kyrgyzstan) using remote sensing data. Global Planetary Change, 56, 1–12.
- Bolch, T. and Marchenko, S.S., 2009. Significance of glaciers, rockglaciers and ice-rich permafrost in the Northern Tien Shan as water towers under climate change conditions. In: L. Braun, et al., eds., Selected papers from the Workshop “Assessment of snow, glacier and water resources in Asia”, vol. 8, Almaty, 28–30 November 2006. IHP/HWRP-Berichte. Koblenz: Federal Institute of Hydrology, 132–144.
- Bolch, T., et al., 2012. The state and fate of Himalayan glaciers. Science, 336 (6079), 310–314. doi:10.1126/science.1215828
- Bolch, T., Pieczonka, T., and Benn, D.I., 2011. Multi-decadal mass loss of glaciers in the Everest area (Nepal, Himalaya) derived from stereo imagery. The Cryosphere, 5, 349–358. doi:10.5194/tc-5-349-2011
- Changchun, X., et al., 2007. Potential impact of climate change on snow cover area in the Tarim River basin. Environmental Geology, 53, 1465–1474. doi:10.1007/s00254-007-0755-1
- Chen, Y., et al., 2006. Regional climate change and its effects on river runoff in the Tarim basin, China. Hydrological Processes, 20, 2207–2216. doi:10.1002/hyp.6200
- Chen, Y., et al., 2007. Effects of climate change on water resources in Tarim River basin, Northwest China. Journal of Environmental Sciences, 19, 488–493. doi:10.1016/S1001-0742(07)60082-5
- Cleveland, W.S., 1979. Robust locally weighted regression and smoothing scatterplots. Journal of the American Statistical Association, 74, 829–836. doi:10.1080/01621459.1979.10481038
- Cleveland, W.S. and Loader, C.R., 1996. Smoothing by local regression: principles and methods. In: W. Härdle and M.G. Schimek, eds. Statistical theory and computational aspects of smoothing. Heidelberg: Physica-Verlag, 10–49.
- Dietz, A.J., Künzer, C., and Conrad, C., 2013. Snowcover variability in central Asia between 2000 and 2011 derived from improved MODIS daily snowcover products. International Journal of Remote Sensing, 34 (11), 3879–3902. doi:10.1080/01431161.2013.767480
- Ding, Y., et al., 2006. The retreat of glaciers in response to recent climate warming in western China. Annals of Glaciology, 43, 97–105. doi:10.3189/172756406781812005
- Fan, Y., et al., 2011. Impacts of temperature and precipitation on runoff in the Tarim River during the past 50 years. Journal of Arid Land, 3, 220–230. doi:10.3724/SP.J.1227.2011.00220
- Fu, G., Charles, S.P., and Chiew, F.H.S., 2007. A two-parameter climate elasticity of streamflow index to assess climate change effects on annual streamflow. Water Resources Research, 43, W11419. doi:10.1029/2007WR005890
- Giese, E., Mamatkanov, D.M., and Wang, R., 2005. Wasserressourcen und deren Nutzung im Flussbecken des Tarim (Autonome Region Xinjiang/VR China). Giessen: ZEU. ZEU Discussion Papers 25.
- Giese, E. and Moßig, I., 2004. Klimawandel in Zentralasien. Giessen: ZEU. ZEU Discussion Papers 17, pp. 70.
- Giese, E., et al., 2007. Long-term analysis of air temperature trends in Central Asia. Erdkunde, 61, 186–202. doi:10.3112/erdkunde.2007.02.05
- Glazirin, G.A., 2010. Century of investigations on outbursts of the ice-dammed Lake Merzbacher (Central Tien Shan). Austrian Journal of Earth Sciences, 103 (2), 171–179.
- Hagg, W., et al., 2008. Sub-debris melt rates on southern Inylchek Glacier, central Tian Shan. Geografiska Annaler, 90A (1), 55–63. doi:10.1111/j.1468-0459.2008.00333.x
- Hao, X., et al., 2008. Impacts of climate change and human activities on the surface runoff in the Tarim River basin over the last fifty years. Water Resources Management, 22, 1159–1171. doi:10.1007/s11269-007-9218-4
- Jiang, Y., Zhou, C., and Cheng, W., 2005. Analysis on runoff supply and variation characteristics of Aksu drainage basin. Journal of Natural Resources, 20 (1), 27–34. (In Chinese).
- Jiang, Y., Zhou, C., and Cheng, W., 2007. Streamflow trends and hydrological response to climatic change in Tarim headwater basin. Journal of Geographical Sciences, 17 (1), 51–61. doi:10.1007/s11442-007-0051-8.
- Jing, Z., et al., 2006. Mass balance and recession of Ürümqi glacier No. 1, Tien Shan, China, over the last 45 years. Annals of Glaciology, 43, 214–217. doi:10.3189/172756406781811899
- Liu, S., et al., 2006. Glacier retreat as a result of climate warming and increased precipitation in the Tarim river basin, Northwest China. Annals of Glaciology, 43, 91–96. doi:10.3189/172756406781812168
- Liu, Y. and Chen, Y., 2006. Impact of population growth and land-use change on water resources and ecosystems of the arid Tarim River basin in Western China. International Journal of Sustainable Development & World Ecology, 13, 295–305. doi:10.1080/13504500609469681
- Narama, C., et al., 2010. Spatial variability of recent glacier area changes in the Tien Shan Mountains, Central Asia, using Corona (1970), Landsat (2000), and ALOS (2007) satellite data. Global Planetary Change, 71, 42–54.
- NCDC (National Climatic Data Center), 2011. Global Historical Climatology Network (GHCN) Daily version 2.8 [online]. Available from http://www.ncdc.noaa.gov/cdo-web/search.htm [Accessed 27 September 2012].
- Osmonov, A., et al., 2013. Dynamics of glaciers in the Sary-Jaz River basin within current climate change. Remote Sensing Letters, 4 (8), 725–734.
- Paul, F., et al., 2004. Rapid disintegration of Alpine glaciers observed with satellite data. Geophysical Research Letters, 31 (21), L21402. doi:10.1029/2004GL020816.
- Pieczonka, T., et al., 2013. Heterogeneous mass loss of glaciers in the Aksu-Tarim catchment (Central Tien Shan) revealed by 1976 KH-9 Hexagon and 2009 SPOT-5 stereo imagery. Remote Sensing of the Environment, 130, 233–244.
- R Development Core Team, 2008. R: A language and environment for statistical computing. Vienna: R Foundation for Statistical Computing. ISBN 3-900051-07-0.
- Risbey, J.S. and Entekhabi, D., 1996. Observed Sacramento basin streamflow responce to precipitation and temperature changes and its relevance to climate impact studies. Journal of Hydrology, 184, 209–223. doi:10.1016/0022-1694(95)02984-2
- Sankarasubramanian, A., Vogel, R.M., and Limbrunner, J.F., 2001. Climate elasticity of streamflow in the United States. Water Resources Research, 37 (6), 1771–1781. doi:10.1029/2000WR900330
- Savoskul, O., 1997. Modern and little ice age glaciers in “humid” and “arid” areas of the Tien Shan, Central Asia: two different patterns. Annals of Glaciology, 24, 415–420.
- Schaake, J.C., 1990. From climate to flow. In: P.E. Waggoner, ed. Climate change and U.S. water resources. New York: John Wiley, 177–206.
- Shangguan, D., et al., 2006. Monitoring the glacier changes in the Muztag Ata and Konggur mountains, East Pamirs, based on Chinese Glacier inventory and recent satellite imagery. Annals of Glaciology, 43, 79–85. doi:10.3189/172756406781812393
- Shangguan, D., et al., 2009. Glacier changes during the last forty years in the Tarim Interior River basin, Northwest China. Progress in Natural Science, 19, 727–732. http://www.sciencedirect.com/science/article/pii/S1002007109000471. doi:10.1016/j.pnsc.2008.11.002
- Shi, Y., Liu, C., and Kang, E., 2009. The Glacier inventory of China. Annals of Glaciology, 50, 1–4.
- Shi, Y., et al., 2006. Peculiar phenomena regarding climatic and glacial variations on the Tibetan Plateau. Annals of Glaciology, 43, 106–110. doi:10.3189/172756406781812267
- Shi, Y., et al., 2007. Recent and future climate change in Northwest China. Climatic Change, 80 (3), 379. doi:10.1007/s10584-006-9121-7
- Sorg, A., et al., 2012. Climate change impacts on glaciers and runoff in Tien Shan (Central Asia). Nature Climate Change, 2, 725–731. doi:10.1038/nclimate1592
- Tang, Q., et al., 2007. Water balance within intensively cultivated alluvial plain in an arid environment. Water Resources Management, 21, 1703–1715. doi:10.1007/s11269-006-9121-4
- Tao, H., et al., 2011. Trends of streamflow in the Tarim River basin during the past 50 years: human impact or climate change? Journal of Hydrology, 400, 1–9. doi:10.1016/j.jhydrol.2011.01.016
- Thevs, N., 2011. Water scarcity and allocation in the Tarim basin: decision structures and adaptations on the local level. Journal of Current Chinese Affairs, 40 (3), 113–137.
- Unger-Shayesteh, K., et al., 2013. What do we know about past changes in the water cycle of Central Asian headwaters? A review. Global and Planetary Change, 110, 4–25. doi:10.1016/j.gloplacha.2013.02.004.
- Wang, G., et al., 2008. Runoff changes in Aksu River basin during 1956–2006 and their impacts on water availability for Tarim River. Journal of Glaciology and Geocryology, 30, 562–568.
- Wang, G., et al., 2010. The effects of human activities on oasis climate and hydrologic environment in the Aksu River basin, Xinjiang, China. Environment Earth Sciences, 59, 1759–1769. doi:10.1007/s12665-009-0158-6
- Wang, N., et al., 2007. Variations of the Glacier No. 1 at the source of the Urumqi River, Tien Shan Mts., China, during the past 40 years. Data of Glaciological Studies (MGI), 102, 48–53.
- Wang, Y., ed., 2006. Local records of the Akesu River basin. China: Fangzhi publisher.
- Weedon, G.P., et al., 2011. Creation of the WATCH forcing data and its use to assess global and regional reference crop evaporation over land during the twentieth century. Journal of Hydrometeorology, 12, 823–848. doi:10.1175/2011JHM1369.1
- WGMS, 2008. Global glacier changes: facts and figures. In: M. Zemp, et al., eds. UNEP. Zurich: World Glacier Monitoring Service, 88pp.
- WGMS, 2013. Glacier Mass Balance Bulletin No. 12 (2010–2011). In: M. Zemp, et al., eds. ICSU(WDS)/IUGG(IACS)/UNEP/UNESCO/WMO. Zurich: World Glacier Monitoring Service, 106pp. doi:10.5904/wgms-fog-2014-09.
- Wu, Z., et al., 2010. Climate change and human activities: a case study in Xinjiang, China. Climatic Change, 99, 457–472. doi:10.1007/s10584-009-9760-6
- Xiao, C., et al., 2007. Observed changes of cryosphere in China over the second half of the 20th century: an overview. Annals of Glaciology, 46, 382–390. doi:10.3189/172756407782871396
- Xie, C., et al., 2007. Study on the change of Keqikaer Glacier during the last 30 years, Mt. Tuomuer, Western China. Environmental Geology, 51, 1165–1170.
- Xu, C., et al., 2006. Climate change and hydrologic process response in the Tarim River basin over the past 50 years. Cninese Sciences Bulletin, 51, 25–36. doi:10.1007/s11434-006-8204-1
- Xu, J., et al., 2007. The melting Himalayas. Regional challenges and local impacts of climate change on mountain ecosystems and livelihoods. Kathmandu: International Cenre for Integrated Mountain Development (ICIMOD).
- Zemp, M., Hoelzle, M., and Haeberli, W., 2009. Six decades of glacier mass-balance observations: a review of the worldwide monitoring network. Annals of Glaciology, 50, 101–111.
- Zhang, Q., et al., 2010. Climate changes and their impacts on water resources in the arid regions: a case study of the Tarim River basin, China. Stochastic Environmental Research and Risk Assessment, 24, 349–358. doi:10.1007/s00477-009-0324-0
- Zhang, X., et al., 2012b. Impact of agricultural development on variation in surface runoff in arid regions: a case of the Aksu River basin. Journal of Arid Land, 4, 399–410. doi:10.3724/SP.J.1227.2012.00399
- Zhang, Y., et al., 2012a. Brief communication “assessment of change in temperature and precipitation over Xinjiang, China”. Natural Hazards Earth System Sciences, 12 (5), 1327–1331. doi:10.5194/nhess-12-1327-2012
- Zhou, D.C., Luo, G.P., and Lei, L., 2010. Processes and trends of the land use change in Aksu watershed in the central Asia from 1960 to 2008. Journal of Arid Land, 2 (3), 157–166.