
ABSTRACT
The Wei River Basin is a typical arid and semi-arid area of the Yellow River Basin. Quantitative estimates of the contributions of human activities and climate changes in this region will enhance our understanding of the local hydrological mechanism and provide an effective reference for other arid and semi-arid areas of the world in local water resource planning and management. The heuristic segmentation method was used to detect the inflection points of the annual runoff. The slope change ratio of accumulative quantity (SCRAQ) method was applied to compute the relative contributions of human activities and climate changes to the decreasing runoff in the whole basin and the basin above Linjiacun. For the whole basin, when 1960–1969 is selected as the baseline, the contributions of climate changes and human activities in 1970–1993 are 26.47% and 73.53%, respectively, those in 1993–2005 are 23.33% and 76.67%, respectively. When 1970–1993 is selected as the baseline, the contributions of climate and human impacts in 1994–2005 are 18.88% and 81.12%, respectively. The results imply that human activities are the dominant driving factors of runoff reduction, whose effect is increasingly intensifying. Furthermore, in order to verify the contributions of human activities and climate changes based on the SCRAQ method, an approach based on the Budyko hypothesis was used in this paper. The results indicate that the contributions of human activities and climate changes based on the SCRAQ method are consistent with those based on the sensitivity-based method.
Editor Z.W. Kundzewicz; Associate editor D. Yang
1 Introduction
The water resources system and hydrological cycle are widely influenced by climate changes and human activities (Vorosmarty et al. Citation2000, Beven Citation2001, Kezer and Matsuyama Citation2006, IPCC Citation2007). According to the IPCC (Citation2007), the mean global surface temperature increased during the past century. Many investigations have found that climatic variability under a background of global warming is likely to enhance the severity and frequency of extreme weather, which leads to more severe droughts and floods (Bates et al. Citation2008, Milliman et al. Citation2008, Jung et al. Citation2012, Thompson Citation2012). Moreover, human activities are intensifying, including irrigation, urban construction, afforestation, construction of water conservancy projects and cultivation, which all affect runoff mechanisms, especially for the changes in land utilization on a large scale (Yang et al. Citation2004, Brown et al. Citation2005, Jiang et al. Citation2012, Yang et al. Citation2012a, Citation2012b). Along with the growing population and rapid economic development in some regions, water use for the industrial and agricultural sectors has greatly increased, which directly leads to a striking decrease in runoff. From a resource perspective, runoff is an important measure of available water, which plays a major role in the utilization of water resources, sustainable development and improved governance (Zhang et al. Citation2011). However, many rivers in arid and semi-arid areas in China and other areas of the world have experienced a remarkable decrease in runoff over the past several decades, which creates severely ecological problems and affects livelihoods (Wang et al. Citation2012a). Because of limited available water resources, the sustainable industrial and agricultural developments in these regions are threatened; moreover, some arid areas cannot meet the demands for domestic water.
Therefore, it is of great significance to quantitatively estimate the relative contributions of human activities and climate changes to the decreasing runoff, which is not only necessary for further understanding the hydrological mechanism in the watershed but also for drought and flood protection as well as local water resources and watershed planning. Hence, many hydrologists have attempted to study the influences of human activities and climate changes on runoff processes (Chiew and McMahon Citation2002, Miao et al. Citation2011, Xu Citation2011, Ye et al. Citation2013). However, a majority of researchers have employed hydrological models to investigate the responses of streamflow processes to synthetic climatic variability under different catchment scenarios. Wang et al. (Citation2009b) have used the Variable Infiltration Capacity model to quantitatively estimate the effects of human activities and climate changes on hydrological responses in a sub-catchment of the Yellow River. Wang et al. (Citation2006) have employed the SIMHYD model to investigate the influences of human activities and climate variability on runoff, separately, in the Fenhe River, which is in the middle of the Yellow River catchment. Although the above hydrological models are useful tools to address these issues, the research results have many uncertainties caused by parameter calibration, the disadvantages of the structure and the scale problem. Based on what is outlined above, a method based on the slope change ratio of accumulative quantity (SCRAQ) was used in this study to assess the contributions of climate changes and human activities to streamflow change in the Wei River Basin. The SCRAQ method was initially proposed by Wang et al. (Citation2012a), where year is an independent variable and accumulative annual runoff and annual precipitation/evaporation are the dependent variables used here. The introduction of these accumulates removes the effect of the inter-annual fluctuations of the measured data to a great extent. Therefore, the acquired correlation of the relationship between years and these accumulates is very good, thus creating a favourable condition for further quantitative analysis of the contributions of climate changes and human activities to the changes in runoff. Furthermore, a sensitivity-based method which is similar to the elasticity method was also used to calculate the contributions of human activities and climate changes in order to verify the reliability of the SCRAQ method.
The choice of baseline is a very important step in computing the contributions of climate and human impacts to runoff; however, some researchers selected the baseline subjectively. Ye et al. (Citation2013) used water and energy budgets analysis to estimate the effects of climate changes and human activities on streamflow changes by subjectively using the 1960s as a baseline period. Similarly, Miao et al. (Citation2011) also subjectively put the 1950s–1960s as a baseline period to investigate the contributions of climate changes and human activities to runoff changes. However, these methods pose some errors. A relatively accurate way to separate the influence of climate changes and human activities is to identify the inflection point first, then use the hydrological time series before the change point as the baseline. The problem lies in how to capture the inflection points accurately and efficiently. Generally, statistical test methods such as the sliding T test, sliding F test, Mann-Kendall test and rank sum test are wisely used to detect variation points. These tests are based on the assumption that the data used are linear and smooth. However, hydrological time series are highly nonlinear due to the great variability of the hydrological process. Therefore, it is difficult for these methods to capture the real inflection points accurately. For this reason, the heuristic segmentation method proposed by Bernaola-Galván et al. (Citation2001) was introduced in this study to detect the actual inflection points. The method is based on the sliding T test, but it is modified to detect the inflection point of nonlinear and nonstationary time series.
The Wei River Basin is an important region of China. It includes the Guanzhong–Tianshui Economic Zone, which is a national key economic development zone in the west. However, the available water resources in the Wei River Basin are quite limited. Per capita and per acre values of river runoff in the basin are only 308 m3 and 174 m3, respectively, which only amount to 13% and 9% of the national average, respectively. Therefore, water resources are scarce in the basin. Furthermore, in recent decades, the runoff of the Wei River Basin has significantly decreased because of climate changes and human activities. Consequently, the economic and social development of the basin is restricted. In view of this, it is important to distinguish the relative contributions of climate changes and human activities to the decreasing runoff for the benefit of local water resources planning and watershed management to ensure sustainable water resources utilization.
The influence of human activities and climate changes on the variation of runoff is highly complex, especially for the arid and semi-arid areas. Severe water crises, economic stagnation and environmental degradation have occurred in these regions. According to many previous studies (Yao et al. Citation2003, Fan et al. Citation2007, Yang and Tian Citation2009), the relative influences of human activities and climate changes vary across regions. To the best of our knowledge, the relative influences of human activities and climate changes on the variation of runoff in the Wei River Basin have not been thoroughly investigated. Further research is essential to provide a conclusive and scientific interpretation of the runoff variation. This interpretation is necessary for an improved understanding of the hydrological processes in the catchment, drought and flood mitigation and protection, and watershed planning in the Wei River Basin and the middle and upper reaches of the Yellow River. Therefore, the main objectives of this study are: (1) to investigate the inflection points of annual runoff series based on the heuristic segmentation method and (2) to quantitatively estimate the contributions of human activities and climatic variation to basin-scale runoff reduction.
2 Study area and data
2.1 Introduction to the Wei River Basin
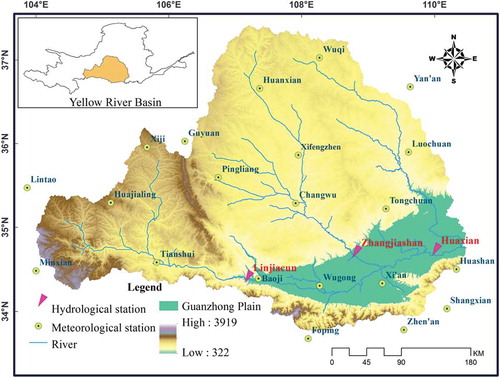
The Wei River Basin () was selected as the study area for this research. The Wei River is the largest tributary of the Yellow River; it lies between 103.5°E–110.5°E and 33.5°N–37.5°N; and it covers a total area of 1.35 × 10⁵ km2. Located in the continental monsoon climate zone, the Wei River Basin is characterized by relatively abundant precipitation and high temperature in summer, and sparse precipitation and very low temperature in winter. The annual precipitation of the basin is approximately 559 mm (Zhang et al. Citation2008). The rainfall varies monthly and annually; the flood season (from June to September) generally accounts for approximately 60% of the total annual rainfall. The annual rainfall also varies greatly due to the unstable features of the intensity, duration and impact area of the subtropical high pressure belt over the northern Pacific. Topographically, the altitude decreases from the highest northwest mountainous areas to the lowest Guanzhong Plain in the southeast and southern portion of the basin. The Guanzhong Plain is designated as a state key economic development zone, which stimulates the economic development of the surrounding areas. Therefore, the economic development of the Guanzhong Plain will directly influence the sustainable development of the economy and society in this area. However, in recent decades, the runoff of the basin has markedly decreased due to climate changes and human activities. It has failed to satisfy the water demand for socio-economic development and the eco-environment. Furthermore, severe water pollution deteriorates the water resource availability. Considering the significance of water security in the basin, a further investigation is needed to quantitatively estimate the contributions of climate changes and human activities to the decreasing runoff.
Figure 1. Location of the Wei River Basin and hydro-meteorological stations in the Yellow River Basin.
2.2 Study data
Daily rainfall, wind speed, air temperature, sunshine duration, vapour pressure and relative humidity data collected from 21 meteorological stations in the Wei River Basin were employed in this study (). Each station has meteorological data that cover the period 1 January 1960 to 31 December 2005. The meteorological data were acquired from the National Climate Center (NCC) of the China Meteorological Administration (CMA). Potential evapotranspiration (PET) values for the meteorological stations were calculated by the Penman-Monteith equation (Allen et al. Citation1998). The data quality was strictly controlled during their release. Among the 21 stations, two have missing values. However, the total missing data are less than 0.01%, and these were reconstructed by calculating the average value of their neighbour stations. We believe the reconstruction approach has little effect on the long-term temporal trend. Additionally, the double-mass curve method was used to verify the data consistency. The results indicate that all of the daily meteorological data used in this research are consistent.
Daily runoff data from the Linjiacun, Zhangjiashan and Huaxian hydrological stations in the middle and lower reaches of the Wei River were acquired from the hydrological manual. Each station has runoff data covering 1 January 1960 to 31 December 2005. The Linjiacun station is located in the middle reach of the basin. Its catchment area is approximately 3.3 × 10⁴ km2. The Zhangjiashan station is in the lower reaches of the Jinghe River, and has a catchment area of approximately 4.2 × 10⁴ km2. The Huaxian station is in the lower reaches of the basin, and its catchment area accounts for 97.16% of the entire basin. Therefore, the runoff of the Huaxian station can be regarded as the streamflow of the entire basin. In addition to the entire Wei River Basin, the study area comprises two sub-catchments: the basin above Linjiacun and the basin above Zhangjiashan.
2.3 Human activities in the Wei River Basin
Within the past several decades, the impact of human activities has increasingly intensified in the basin. The demand for surface water and groundwater has greatly increased due to the increasing population and high-speed economic development. Regarding the Wei River Basin in Shaanxi province, the population was 22.04 million in 2000 and 24.62 million in 2010, which has led to an increase in farmland due to food demand. The rapid population growth correlates with a large amount of water consumption. Moreover, the economy of the basin has rapidly developed during the past 10 years. Its average economic growth was approximately 10.5%. The urbanization rate of this region was only 38.6% in 2000, but it increased to 50% in 2010. These factors result in a significant increase in water needs. Furthermore, approximately 300 reservoirs have been constructed since 1949 with a total storage capacity of 2.73 billion m3. The construction of the reservoirs led to an increase in evaporation due to expansion of the water area, which influences the inter-annual distribution of runoff. Soil and water conservation measures in this basin were conducted in the 1950s, and implemented on a large scale after the 1970s. Thus, the process of runoff generation may have altered due to the variation of the underlying surface.
3 Methodology
3.1 The heuristic segmentation method
To divide the nonstationary time series into several stationary segments, a sliding pointer is moved step-by-step from left to right along the time series (Bernaola-Galván et al. Citation2001). The averages of the subsets of the series to the left of the pointer μ1 and to the right of μ2 are calculated. For two Gaussian-distributed random series, the difference between the averages of the two series μ1 and μ2 under the statistical significance is estimated by Student’s t-test statistic as follows:
where
denotes the pooled variance, sl and s2 are the standard deviations of the two series, N1 and N2 represent the number of points from the two series. By moving the pointer along the given time series step-by-step, the statistic t is calculated to estimate the difference between the averages of the right side and left side time series. A larger t denotes that the average values of the two time series tend to be more significantly different. The largest t value is regarded as a good candidate for the cut point. Then, the statistical significance P(tmax) is computed. Note that P(tmax) is not the standard Student’s t-test because the series are not independent and cannot be obtained in a closed analytical form; therefore, P(tmax) is approximately calculated as follows:
where and
are acquired from Monte Carlo simulations, N denotes the number of the time series to be cut, v = N – 2, and Ix (a, b) represents the incomplete beta function. If the difference in the averages is not statistically significant (e.g., P(tmax) is less than a threshold of 0.95), the time series will be not split. Conversely, the time series is divided into two segments with significantly different averages. If the time series is split, the iteration of the above procedure on each new segment will continue until the acquired significant value is less than the threshold or the length of the acquired segments are less than the presupposed minimum segment length (
).
3.2 SCRAQ
For a natural watershed, the annual water balance is expressed as where P denotes precipitation, ET stands for actual evapotranspiration, Q represents runoff and ΔW denotes the variation of the water storage. For a long time period (10 years or more), ΔW can be regarded as zero, thus ET can be calculated by means of
. Thus, the change in P and ET directly results in the variation of runoff, and the relationship between runoff and precipitation/evaporation can be seen as linear in the long term (10 years or more). Hence, the changes in runoff are determined by the changes in precipitation, evaporation and the related human activities. We assume that the slopes of the linear relationship between the accumulative runoff and year before and after the inflection point are SRb and SRa (units: 108 m3/year), respectively. Similarly, the slopes of the linear relationship between accumulative precipitation and year before and after the inflection point are SPb and SPa (units: mm/year), respectively. The slope change ratio of the accumulative runoff (%) can be expressed as follows:
Similarly, the slope change ratios of the accumulative evaporation and precipitation (%) can be expressed as follows:
Then, the contribution ratio of the accumulative evaporation and precipitation (%) can be expressed as follows:
Finally, the contribution of human activities (%) to the variation of runoff can be calculated as follows:
3.3 The Budyko hypothesis analysis
Budyko (Citation1974) found that the ratio of actual evaporation to precipitation is determined by the ratio of potential evaporation to precipitation. Hence, governing equations based on the Budyko hypothesis were proposed by many hydrologists (e.g., Fu Citation1981). According to Zhang et al. (Citation2001), the relationship of the long-term average annual ET, PET and P can be expressed as follows:
where w denotes a model parameter of water available coefficient associated with the vegetation type (Zhang et al. Citation2001), which can be calibrated by annual hydro-meteorological data.
Hydrological sensitivity can be depicted as the proportion of the change in average annual runoff affected by the variation of average annual P and PET. The changes in P and PET will result in variations of the water balance. According to Koster and Suarez (Citation1999) and Milly and Dunne (Citation2002), the change in average annual runoff induced by climate changes can be approximately calculated as follows:
where ΔQclim, ΔP and ΔPET denote the variations of runoff, P and PET respectively. and
stand for the sensitivity parameters, which can be computed as follows:
where x represents the drought index described as PET/P, w is the same parameter as in equation (10).
The change in average annual runoff can be expressed as
where ΔQobs denotes the observed variation of average annual runoff between two different periods, denotes the average annual runoff of the reference period, and
stands for the average annual runoff of the other period.
As runoff is primarily impacted by human activities and climate changes, the variation of average annual runoff can be calculated as follows:
where ΔQhum and ΔQclim are the variations of the average annual runoff caused by human activities and climate changes, respectively. The relative contributions of human activities and climate changes to runoff change can be computed as
where and
are the percentages of the impacts of human activities and climate changes on runoff change, respectively.
4 Results and discussion
4.1 Analysis of the changes in annual runoff
The annual runoff of the basin above the Linjiacun station during 1960–2005 is shown in . The runoff of the sub-basin has a high variability () decreasing trend, especially for the annual runoff in 1997 (0.84 108 m3), implying that the Wei River at the Linjiacun station was drying. A slight upward trend is detected from 1960 to 1969, and a markedly decreasing trend is identified for 1969–1973. Additionally, the runoff for 1994–2001 has a notably downward trend. The runoff of the basin above Linjiacun has a distinctly downward trend ().
Figure 2. Runoff variation of the basin above Linjiacun during 1960–2005 for (a) annual runoff, and (b) 5-point moving average runoff.
The annual runoff of the basin above the Zhangjiashan station during for 1960–2005 is presented in . The runoff of this sub-basin has no significant trends (), indicating that the impact of climate changes and human activities on the basin above Zhangjiashan is relatively smaller than that in the basin above Linjiacun. Although the runoff has no obvious trend, a slightly downward trend is detected for 1965–1973.
Figure 3. Runoff variation of the basin above Zhangjiashan during 1960–2005 for (a) annual runoff, and (b) 5-point moving average runoff.
The annual runoff of Huaxian station for 1960–2005 is exhibited in . It can clearly be observed from that the runoff of this basin has a notably downward trend. The periods of 1960–1965, 1973–1978 and 1980–1986 exhibit a slight increase, whilst a clear downward trend is identified for 1965–1974. Additionally, a decreasing trend is detected during 1986–1998. It can clearly be seen from (b) that the runoff of Huaxian has distinctly decreased.
Figure 4. Runoff variation of the Wei River Basin during 1960–2005 for (a) annual runoff, and (b) 5-point moving average runoff.
In general, the two sub-basins and the entire basin are similar in terms of the trends of the annual runoff. However, the variation of the annual runoff in the basin above the Linjiacun station is more similar to Huaxian than that of Zhangjiashan, and they have a more consistent annual runoff.
4.2 The inflection points of the runoff
4.2.1 Above Linjiacun station
As outlined in Section 4.1, the annual runoff in each basin has a nonlinear and nonstationary feature; therefore, the heuristic segmentation method introduced in Section 3 was applied to detect the inflection points of the annual runoff. The threshold P0 was set to 0.95 and was set to 25. The segmentations and inflection points of the annual runoff in the basin above Linjiacun are shown in . The solid line in shows the first iteration and segmentation process. An inflection point (1971) is identified due to the condition that P(tmax) = 1 > P0, which is consistent with the findings of Wang et al. (Citation2012a), who found that the runoff in Longmen–Tongguan section has a change point in 1971 based on cumulative anomaly. The dotted line in presents the second iteration and segmentation process. Another inflection point (1993) is detected due to the condition that P(tmax) = 0.9985 > P0. Because the length of the segments is smaller than
, the segmentation process stops.
Figure 5. Segmentations and change points of annual runoff in the basin (a) above Linjiacun, (b) above Zhangjiashan and (c) for the whole basin.
4.2.2 Above Zhangjiashan station
Using the same procedure as above, the threshold P0 was set to 0.95 and was set to 25. The segmentations and inflection points of the annual runoff in the basin above Zhangjiashan are exhibited in .
The maximum value of T occurs in 1971; however, its corresponding P(tmax) is 0.8020, which is less than P0 (). Thus, the inflection point of the annual runoff in the basin above Zhangjiashan does not exist.
4.2.3 Above whole basin
Again, the threshold P0 was set to 0.95 and was set to 25. The segmentations and inflection points of the annual runoff in the whole basin are shown in . The solid line in presents the first iteration and segmentation process of the annual runoff. An inflection point (1969) is detected due to the condition that P(tmax) = 0.9929 > P0. The dotted line in shows the second iteration and segmentation process of the annual runoff. Another inflection point (1993) is detected due to the condition that P(tmax) = 0.9985 > P0. Because the length of the segments are smaller than
, the segmentation process ends. For Linjiacun and Huaxian stations, they have a common inflection point (1993), which is similar to the findings of Zuo et al. (Citation2014), who applied a nonparametric method to identifying the change points of runoff in the Wei River, and found that the runoff for Linjiacun and Huaxian stations had an inflection point of 1993.
To verify the inflection points obtained in this study, the statistical values of the runoff before and after the inflection points were calculated and are illustrated in . It can easily be seen from that the averages and variances of the annual runoff of the three time series in the basin above Linjiacun are notably different. As regards the variation coefficients, those values during 1960–1971 and 1972–1993 are similar, whereas during 1994–2005 they are different. The statistical characteristics of runoff before and after the inflection point in the whole basin are similar to those in the basin above Linjiacun. Overall, the statistical values of the runoff before and after the inflection points in the two basins are strikingly different; therefore, the inflection points are reasonable.
Table 1. Statistical values of runoff before and after the change points.
4.3 The underlying causes of the inflection points
Two inflection points occur in the annual runoff in the whole basin: the early 1970s and the mid 1990s.
To begin with, the causes of the first inflection point are analysed. Soil conservation measures were conducted in the Wei River Basin in the 1950s and were expanded after the early 1970s, which reduced the runoff. Additionally, the basin is in the continental monsoon climate zone of China and tends to be influenced by the West Pacific subtropical high pressure system. In 1971, the weakness of this system in combination with development of an El Niño event caused substantial atmospheric circulation and climate anomalies in China (Bao et al. Citation2012), resulting in a sharp decrease in rainfall in the Wei River Basin, which contributed to the first inflection point identified. Furthermore, many reservoirs and irrigation canals were completed in the early 1970s (e.g., the Yangmaowan and Fengcun reservoirs were completed in 1970, the Dayu and Shimen reservoirs were constructed in 1972 and the Baojixia Canal was completed in 1971), which greatly reduced the runoff and contributed to the inflection point.
Next, the causes of the second mutation point are analysed. National economic water consumption sectors in the Wei River Basin in the 1990s increased remarkably, especially in domestic and industrial water use. The total national economic water consumption was 4.3 billion m3, which increased by 52.6% compared with the decades before 1990, and directly decreased runoff. Moreover, according to Zhang et al. (Citation2008), a third ENSO event occurred in 1993, when the West Pacific subtropical high pressure system was strong. This caused an extreme reduction in rainfall in the basin and contributed to a 42.4% reduction in the average annual runoff.
4.4 Relationships between accumulative runoff and year
4.4.1 Above Linjiacun
The two inflection points (1971 and 1993) of the streamflow change in the basin above the Linjiacun station split the streamflow into three distinct periods: 1960–1971 (AR), 1972–1993 (BR) and 1994–2005 (CR). The fitted linear relationships between the accumulative runoff and year during the three periods are shown in .
Figure 6. The relationships between accumulative runoff and year in the basin (a) above Linjiacun, (b) above Zhangjiashan and (c) in the whole basin.
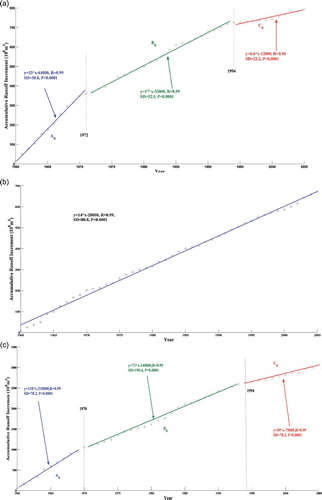
It can clearly be observed from (a) that the annual runoff in the basin above Linjiacun station is divided into three segments. The correlation coefficients of all of the segments are high. The correlation coefficient of CR is smaller than that of AR and BR, implying that the runoff has been influenced by more complex factors within recent years. Furthermore, the slope of the segments is decreasing from AR to CR; thus, the annual runoff has a downward tendency.
4.4.2 Above Zhangjiashan
The fitted linear relationships between accumulative runoff of the basin above Zhangjiashan and year during the entire period are exhibited in (b).
The relationship between accumulative runoff and year is nearly a fitted line. The correlation coefficient is large (0.99), indicating that the annual runoff in the basin is highly consistent and no inflection points occur during the entire period. This result is consistent with what was outlined previously and further proves that no inflection points occur in the annual runoff during 1960–2005.
4.4.3 In the whole basin
The two inflection points (1969 and 1993) of the runoff in the basin above Huaxian station split the runoff into three periods: 1960–1969 (AR), 1970–1993 (BR) and 1994–2005 (CR). The fitted linear relationships between the accumulative runoff and year during the three periods are presented in (c). The slope of the segments decreases from AR to CR, which indicates that the annual runoff in this basin has a decreasing trend, which is similar to the basin above Linjiacun.
4.5 The contributions of human activities and climate changes to runoff variation based on the SCRAQ method
Climate changes are primarily related to precipitation and evaporation. Because no inflection points exist in annual runoff in the basin above Zhangjiashan station, only the contributions of human activities and climate changes to runoff change in the Wei River Basin and the basin above the Linjiacun station are analysed. The contributions of human activities, precipitation and evaporation to the runoff changes in the basin above Linjiacun and the Wei River Basin are computed based on the parameters presented in and . The results are shown in .
Table 2. The slope and change ratio of the linear relationship between accumulative runoff, precipitation, evaporation and year in the basin above Linjiacun.
Table 3. The slope and change ratio of the linear relationshhip between accumulative runoff, precipitation, evaporation and year in the Wei River Basin.
Table 4. Contributions of human activities and climate changes in each basin based on the SCRAQ method.
Regarding the basin above the Linjiacun station, when the runoff for 1960–1971 is the baseline, the influences of precipitation on the runoff changes during 1972–1993 and 1994–2005 are 31.98% and 20.63%, respectively. The impacts of evaporation on the runoff changes during 1972–1993 and 1994–2005 are 12.1% and 8.3%, respectively. Moreover, the contributions of human activities to the runoff change during 1995–2005 is larger than that during 1972–1993, implying that the influence of human activities in this basin is increasingly intensified. When the baseline is the runoff series during 1972–1993, the contributions of climate changes and human activities to the runoff changes during 1994–2005 are 26.03% and 73.97%, respectively. Similarly, as regards the Wei River Basin, when the runoff during 1960–1969 is the baseline, the influences of precipitation on the runoff changes during 1970–1993 and 1994–2005 are 14.37% and 17.83, respectively. The impacts of evaporation on the runoff changes during 1970–1993 and 1994–2005 are 12.1% and 5.5%, respectively. Additionally, it also can obviously be seen that the contribution of human activities to the runoff change during 1994–2005 is larger than that during 1970–1993. Thus, the influence of human activities in the basin is also increasingly intensified. When the baseline is the runoff series during 1970–1993, the contributions of climate changes and human activities to the runoff changes during 1994–2005 are 21.08% and 78.92%, respectively. Overall, human activities are the most dominating driving factor influencing the decrease in the runoff, and the effect is increasingly intensified; this finding is consistent with Xing et al. (Citation2007).
The modes of human activities affecting the changes in runoff in the various basins are different. With regards to the basin above Linjiacun, the population density is small and direct water use by humans is relatively low. The decrease of runoff in this basin was primarily impacted by the overloading of grasslands with the rapid expansion of stockbreeding after 1993 and the increasing use of agricultural water. Conversely, the average density of the population and economy in the whole basin is larger than that in the basin above Linjiacun, especially in the Guanzhong Plain, which is an important agricultural production and economic development area in western China. This plain receives a large volume of water from the Wei River every year to support the sustainable development of its society and economy, which leads to a large decrease of the runoff in this basin. In theory, the influence of human activities on the decrease of runoff in the whole basin is larger than that in the basin above Linjiacun. The results in show that the contribution of human activities to the decrease of the runoff in the whole basin is larger than that in the basin above Linjiacun, which further proves the rationality and reliability of the results.
4.6 The contributions of human activities and climate changes to runoff variation based on the sensitivity-based method
According to the procedures outlined in Section 3.3, the contributions of human activities and climate changes in each basin based on the sensitivity-based method was calculated. The fitted w of the basin above Linjiacun and Huaxian stations are 2.33 and 2.40, respectively, and their corresponding Budyko curves are exhibited in . The calculated contributions of human activities and climate changes in each basin based on the sensitivity-based method is shown in . Through comparing the results based on the sensitivity-based method with those based on the SCRAQ method, it is quite evident that the contributions of human activities and climate changes in each basin based on the SCRAQ method is similar to that based on the sensitivity-based method, which further verifies the reliability of contributions of human activities and climate changes based on the SCRAQ method. Furthermore, both and indicate that the human activities are the major driving factor on the changes in runoff, and the anthropogenic pressure is increasingly intensified.
Figure 7. The Budyko curves of the basin above Linjiacun and Huaxian stations.
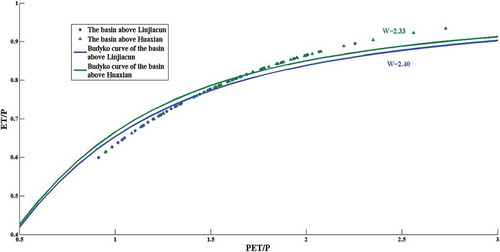
Table 5. Contributions of human activities and climate changes in each basin based on the sensitivity-based method.
4.7 Comparison with other research
Wang et al. (Citation2012a) investigated the contributions of climate changes and human activities to the changes in runoff increments in different sections of the Yellow River based on the SCRCQ method. In terms of geographic proximity, the section of Longmen–Tongguan is nearest to the Wei River Basin; hence, it is worth comparing it with the Wei River Basin. Wang et al. (Citation2012a) found that the contribution of human activities in the period 1985–2009 was 86.58%, which is slightly larger than that in the Wei River Basin for 1973–1994 due to the slightly different time period. Overall, the results in this study are consistent with those of Wang et al. (Citation2012a). Moreover, Wang et al. (Citation2012b) used the SCRCQ method to conclude that the respective contributions of precipitation and human activities to the runoff decrease in the period 1980–1997 in the Huangfuchuan drainage basin are 36.43% and 63.57%, whereas the values for 1998–2008 were 16.81% and 83.19%. Their results are similar to our findings, and the contribution of human activities to the runoff decrease is slightly larger than that in the Huangfuchuan drainage basin. The reason for this difference lies in the different economic levels and population densities of the two basins. The economic level and population density of the Wei River Basin are larger than those of the Huangfuchuan drainage basin. Therefore, the contribution of human activities to the runoff decrease is larger than that in the Huangfuchuan drainage basin. Overall, the results of this study are reasonable when compared with other research.
4.8 Uncertainty analysis
The main purpose of this study is to separate the contributions of climate changes and human activities to the changes in runoff. Nevertheless, many factors tend to disturb the results. Regarding the contributions of climate changes and human activities to the changes in runoff, the inflection point is a key issue. The heuristic segmentation method was used in this study, and the results were affected by the threshold of P0 and . Furthermore, the uncertainty of the model adopted in the manuscript also influences the results. The influences of climate changes and human activities on the changes in runoff is nonlinear, whereas the SCRAQ method used in this study is based on the assumption that these factors can be linearly combined. Although the relationships between precipitation and evaporation with runoff present a strongly linear relation, there are some uncertainties of this model to successfully separate the impacts of climate changes and human activities on the runoff changes in this basin.
Furthermore, assessment of data uncertainty and its effect on the evaluation should be emphasized more and more during each assessment and management (Wang et al. Citation2009a, Song Citation2011). The ensemble Kalman filter was employed to assimilate the annual potential evaporation, precipitation and runoff data. Given the space limit, only the results for Huaxian station are presented here. The measured and simulated annual potential evaporation, precipitation and runoff data at Huaxian station are shown in .
Figure 8. Measured and simulated annual potential evaporation, precipitation and runoff data at Huaxian station.
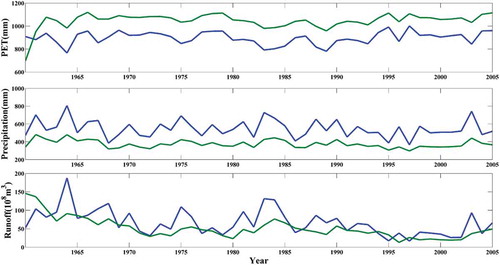
It can be observed from that all of the simulated annual potential evaporation, precipitation and runoff data at Huaxian station based on the ensemble Kalman filter are smoother than these measured data. Then, the heuristic segmentation method was used to identify the inflection points of these simulated annual runoff data at Huaxian station. The segmentations and inflection points of the annual simulated runoff in the Wei River Basin are exhibited in . The solid line in shows the first iteration and segmentation process of the annual simulated runoff in the Wei River Basin. An inflection point (1969) is detected due to the condition that P(tmax) = 1 > P0. The dotted line in shows the second iteration and segmentation process of the simulated annual runoff of the Wei River Basin. Another inflection point (1993) is identified because of the condition that P(tmax) = 0.997 > P0. The inflection points of the simulated annual runoff of the whole Wei River Basin are consistent with those of the measured annual runoff of the whole basin outlined in Section 4.2.3.
Figure 9. Segmentations and change points of the simulated annual runoff in the Wei River Basin.
Following the specific procedures of computing the contributions of climate changes and human activities to the changes in runoff outlined in Section 3.2, these contributions based on the simulated annual potential evaporation, precipitation and runoff data are calculated. Regarding the baseline of 1960–1970, the contributions of climate changes and human activities to the changes in the simulated runoff during 1970–1993 are 22.12% and 77.88%, respectively, and those during 1994–2005 are 19.96% and 80.04%, respectively; whereas the contributions of climate changes and human activities to the changes in the measured runoff during 1970–1993 are 26.47% and 73.53%, respectively, and during 1994–2005 are 23.33% and 76.67%, respectively. Overall, the contributions of climate changes and human activities to the changes in the measured and simulated runoff are consistent to a great extent.
In conclusion, the results of the identification of the inflection points and the contributions of climate changes and human activities based on the measured data are similar to those based on the simulated data assimilated by the ensemble Kalman filter. Therefore, the input data are reliable and have little effect on the results of this manuscript.
5 Conclusions
Within the context of global climate changes, the changing local climate and human activities are regarded as the driving factors causing many natural disasters in the Wei River Basin. An investigation has been made to identify the relative influences of human activities and climate changes on the variations of runoff in the basin during the past several decades. The heuristic segmentation method was used to detect the inflection points of the annual runoff. No inflection points were identified in the basin above the Zhangjiashan station, whereas two inflection points (1971, 1993 and 1969, 1993) are detected in the basin above Linjiacun and the Wei River Basin, respectively. Furthermore, to accurately compute the contributions of the climate changes and human activities, the SCRAQ method was used.
Regarding the basin above the Linjiacun station, when the runoff during 1960–1971 is selected as the baseline, the contributions of climate changes and human activities during 1972–1993 are 44.08% and 55.92%, respectively, and during 1994–2005 the values are 28.93% and 71.07%, respectively. When the runoff during 1972–1993 is the baseline, the contributions of climate changes and human activities during 1994–2005 are 26.03% and 73.97%, respectively. For the entire basin, when the runoff during 1960–1969 is the baseline, the contributions of climate changes and human activities during 1970–1993 are 26.47% and 73.53%, respectively, and the values during 1994–2005 are 23.33% and 76.67%, respectively. When the runoff during 1970–1993 is the baseline, the contributions of climate changes and human activities during 1994–2005 are 18.88% and 81.12%, respectively.
Additionally, in order to verify the contributions of human activities and climate changes based on the SCRAQ method, a method based on the Budyko hypothesis was used in this paper. The results indicate that the contribution of human activities and climate changes based on the SCRAQ method is consistent with that based on the sensitivity-based method, which further verifies the reliability of contributions of human activities and climate changes based on the SCRAQ method.
In conclusion, the human activities in the Wei River Basin are the most dominant driving factors influencing the decrease in runoff, and the influence has increasingly intensified, which poses a new challenge for policy-makers to enhance water resources management in the Wei River Basin. Therefore, reasonable adjustments to the water utilization structure are urgently needed to sustain socio-economic development of the basin.
Acknowledgements
Sincere gratitude is extended to the editor and anonymous reviewers for their professional comments and corrections, which greatly improved the presentation of the paper.
Disclosure statement
No potential conflict of interest was reported by the authors.
Additional information
Funding
References
- Allen, R.G., et al., 1998. Crop Evapotranspiration Guidelines for Computing Crop Water Requirements. FAO Irrigation and Drainage Paper No. 56. FAO, Rome.
- Bao, Z.X., et al., 2012. Attribution for decreasing streamflow of the Haihe River basin, northern China: climate variability or human activities? Journal of Hydrology, 460–461, 117–129. doi:10.1016/j.jhydrol.2012.06.054
- Bates, B.C., et al., 2008. Climate change and water. Technical paper of the intergovernmental panel on climate change. Geneva: IPCC Secretariat, p. 210.
- Bernaola-Galván, P., et al., 2001. Scale invariance in the nonstationarity of human heart rate. Physical Review Letters, 87 (16), 160815. doi:10.1103/PhysRevLett.87.168105
- Beven, K.J., 2001. Rainfall–runoff modeling. Chichester: John Wiley.
- Brown, A., et al., 2005. A review of paired catchment studies for determining changes in water yield resulting from alterations in vegetation. Journal of Hydrology, 310, 28–61. doi:10.1016/j.jhydrol.2004.12.010
- Budyko, M.I., 1974. Climate and Life [M]. San Diego, CA: Academic.
- Chiew, F.H.S. and McMahon, T.A., 2002. Modelling the impacts of climate change in China in recent 45 years. Journal of Climate, 56 (3), 257–271.
- Fan, J., Yang, Y.H., and Zhang, W.J., 2007. A study of changes in runoff resulting from climate and land cover changes in the Yehe Catchment. Acta Agriculturae Bureali-Sinica, 22 (1), 175–179. (In Chinese).
- Fu, B.P., 1981. On the calculation of the evaporation from land surface. Scientia Atmospherica Sinica, 5 (1), 23–31. (In Chinese).
- IPCC, 2007. Climate Change 2007: Synthesis Report. Contribution of Working groups I, II and III to the Forth assessment report of the Intergovernmental Panel on Climate Change. Geneva: IPCC, 104 pp.
- Jiang, S.H., et al., 2012. Analyzing the effects of climate variability and human activities on runoff from the Laohahe basin in northern China. Hydrology Research, 43 (1–2), 3–13. doi:10.2166/nh.2011.133
- Jung, G., Wagner, S., and Kunstmann, H., 2012. Joint climate-hydrology modeling: an impact study for the data-sparse environment of the Volta Basin in West Africa. Hydrology Research, 43 (3), 231–248. doi:10.2166/nh.2012.044
- Kezer, K. and Matsuyama, H., 2006. Decrease of river runoff in the Lake Balkhash basin in central Asia. Hydrological Processes, 20 (6), 1407–1423. doi:10.1002/hyp. 6097
- Koster, R.D. and Suarez, M.J., 1999. A simple framework for examining the interannual variability of land surface moisture fluxes. Journal of Climate, 12, 1911–1917. doi:10.1175/1520-0442(1999)012<1911:ASFFET>2.0.CO;2
- Miao, C., et al., 2011. A preliminary estimate of human and natural contributions to the changes in water discharge and sediment load in the Yellow River. Global and Planetary Change, 76, 196–205. doi:10.1016/j.gloplacha.2011.01.008
- Milliman, J.D., et al., 2008. Climatic and anthropogenic factors affecting river discharge to the global ocean, 1951–2000. Global and Planetary Change, 62, 187–194. doi:10.1016/j.gloplacha.2008.03.001
- Milly, P.C.D. and Dunne, K.A., 2002. Macroscale water fluxes 2. Water and energy supply control of their inter-annual variability. Water Resources Research, 38 (10), 24–29. doi:10.1029/2001WR000760
- Song, X., et al., 2011. Advances in the study of uncertainty quantification of large-scale hydrological modeling system. Journal of Geographical Sciences, 21 (5), 801–819. doi:10.1007/s11442-011-0881-2
- Thompson, J.R., 2012. Modelling the impacts of climate change on upland catchments in southwest Scotland using MIKE SHE and the UKCP09 probabilistic projections. Hydrology Research, 43 (4), 507–530. doi:10.2166/nh.2012.105
- Vorosmarty, C.J., et al., 2000. Global water resources: vulnerability from climate change and population growth. Science, 289, 284–288. doi:10.1126/science.289.5477.284
- Wang, D., et al., 2009a. Stochastic observation error and uncertainty in water quality evaluation. Advances in Water Resources, 32 (10), 1526–1534. doi:10.1016/j.advwatres.2009.07.004
- Wang, G.S., Xia, J., and Chen, J., 2009b. Quantification of effects of climate variations and human activities on runoff by a monthly water balance model: a case study of the Chaobai River basin in northern China. Water Resources Research, 45, W00A11. doi:10.1029/2007WR006768
- Wang, S.J., et al., 2012a. Contributions of climate change and human activities to the changes in runoff increment in different sections of the Yellow River. Quaternary International, 282, 66–77. doi:10.1016/j.quaint.2012.07.011
- Wang, S.J., et al., 2012b. Contributions of precipitation and human activities to the runoff change of the Huangfuchuan drainage basin. Acta Geographica Sinica, 67 (3), 388–397. (In Chinese).
- Wang, G.Q., Zhang, J.Y., and He, R.M., 2006. Impacts of environmental change on runoff in Fenhe river basin of the middle Yellow River. Advance in Water Science, 17 (6), 851–858. (In Chinese).
- Xing, D.Y., Wang, Y.R., and Zhang, Y.F., 2007. Influence and cause analysis for the runoff change in Weihe River. Journal of Water Resources & Water Engineering, 18 (2), 1–4. (In Chinese).
- Xu, J., 2011. Variation in annual runoff of the Wudinghe River as influenced by climate change and human activity. Quaternary International, 244, 230–237. doi:10.1016/j.quaint.2010.09.014
- Yang, D., et al., 2004. Analysis of water resources variability in the Yellow River of China during the last half century using historical data. Water Resources Research, 40, W06502. doi:10.1029/2003WR002763
- Yang, C.G., et al., 2012a. Impact of climate change on flood and drought events in Huaihe River Basin, China. Hydrology Research, 43 (1–2), 14–22.
- Yang, X.L., et al., 2012b. Impacts of land use and land cover changes on evapotranspiration and runoff at Shalamulun River watershed, China. Hydrology Research, 43 (1–2), 23–37. doi:10.2166/nh.2011.120
- Yang, Y.H. and Tian, F., 2009. Abrupt change of runoff and its major driving factors in Haihe River Catchment, China. Journal of Hydrology, 374, 373–383. doi:10.1016/j.jhydrol.2009.06.040
- Yao, Z.J., Guan, Y.P., and Gao, Y.C., 2003. Analysis of distribution regulation of annual runoff and affection of annual runoff by human activity in the Chaobaihe River. Progress in Geography, 22, 599–606. (In Chinese).
- Ye, X.C., et al., 2013. Distinguishing the relative impacts of climate change and human activities on variation of streamflow in the Poyang Lake catchment, China. Journal of Hydrology, 494, 83–95. doi:10.1016/j.jhydrol.2013.04.036
- Zhang, H., et al., 2008. The characteristics of precipitation variation of Weihe River Basin in Shaanxi Province during recent 50 years. Agricultural Research in the Arid Areas, 26 (4), 236–242. (In Chinese).
- Zhang, L., Dawes, W.R., and Walker, G.R., 2001. The response of mean annual evapotranspiration to vegetation changes at catchment scale. Water Resources Research, 37, 701–708. doi:10.1029/2000WR900325
- Zhang, Z.X., et al., 2011. Evaluating the non-stationary relationship between precipitation and streamflow in nine major basins of China during the past 50 years. Journal of Hydrology, 409, 81–93. doi:10.1016/j.jhydrol.2011.07.041
- Zuo, P.D., et al., 2014. Identification of Streamflow response to climate change and human activities in the Wei river basin, China. Water Resources Management, 28, 833–851. doi:10.1007/s11269-014-0519-0