
Abstract
The first objective of this paper is to analyse the trends and change points in the hydroclimatic time series of five representative sub-catchments of the Macta basin, which lies in western Algeria. The second objective is to quantify the role of climate on the trends observed in annual flow time series. This is achieved using hydrological modelling at the multi-annual time step using the Schreiber formulation. The results showed no significant trends on annual rainfall in the 1975–2005 period, a significant increase of temperature and different flow responses to the latter, depending on the catchment considered. Two out of five catchments considered presented a significant flow decrease in the 1975–2005 period with a change point at the beginning of the 1990s. Modelling results suggest that the increase of air temperature is not the sole factor explaining the decrease of annual flow time series in these two catchments.
Résumé
Le premier objectif de cet article est d’analyser les tendances et ruptures des séries de variables hydro-climatiques dans les sous bassins versants de la Macta qui se situe à l’Ouest de l’Algérie. En second lieu, le rôle du climat sur les tendances observées sur les chroniques de débit a été quantifié par une modélisation hydrologique pluriannuelle à l’aide de la formulation de Schreiber. Les résultats montrent une stabilisation des pluies annuelles sur la période allant de 1975 à 2005, une augmentation significative des températures, et différentes réponses sur le débit dans les cinq bassins versants considérés. Deux des cinq bassins considérés présentent une baisse significative des débits avec une rupture identifiée après le début des années 1990. Les résultats de la modélisation semblent indiquer que l’augmentation de température n’est pas le seul facteur pouvant expliquer la baisse du débit sur ces deux sous-bassins.
1 INTRODUCTION
North Africa is extremely vulnerable to climate variations (IPCC Citation2007, Schilling et al. Citation2012). Population growth has been accompanied by an equally dramatic increase in the demand for water. Consequently, even without climate change, it is argued that many countries in North Africa will surpass their maximum economically-usable land-based water resources before 2025 (Ashton Citation2002).
In North Africa, significant warming associated with more frequent and longer-lasting heat waves has been noted for the 1979–2011 period (Fontaine et al. Citation2013, Tramblay et al. Citation2013). In northern Algeria, historical data show that the annual rainfall has dramatically declined since the mid-1970s (Meddi et al. Citation2008, Citation2010b, Lambs and Labiod Citation2009, Donat et al. Citation2014). These changes necessarily have an impact on the region’s water resources and to a certain extent might explain the deterioration of both piezometric depths (Bekoussa et al. Citation2008) and runoff (Meddi and Hubert Citation2003, Meddi et al. Citation2010a). However, groundwater pumping activities have also sharply increased due to demographic growth, even if quantitative data on withdrawal volumes are not available.
Since several drivers of runoff change come into play, it is quite a challenge to distinguish and quantify the role played by each driver (Wagener Citation2007, Destouni et al. Citation2013). Naturally, climate variability is frequently raised as the major cause of runoff variability, but other local, human-induced activities (water withdrawal for irrigation and drinking water, dams, land-use changes, etc.) could also be the dominant cause.
The main objective of this paper is to quantify the influence of recent climate variability on the trends and change points detected on annual flow time series in the Macta basin, located in northwestern Algeria. This paper focuses on the past three decades, i.e. since the shift of mean annual precipitation in the mid-1970s. Section 2 presents the sites studied and the hydroclimatic data used. Section 3 describes the methods used to identify existing trends and change points of selected hydroclimatic variables over the Macta basin for the three last decades, and the water balance modelling framework designed to investigate the role of climate in explaining runoff variability. Section 4 presents the results of the studies and Section 5 summarizes and discusses the potential limits and perspectives of this study.
2 STUDY SITE DESCRIPTION AND DATA USED
2.1 The Macta basin and its sub-catchments
The Macta basin is a relatively large catchment covering 14 389 km2, with two major tributaries, namely the Mekerra River in the western part and the Hammam River in the eastern part. The altitude ranges from the large littoral plain in the north to the mountainous areas covering most of the basin and reaching an altitude of 1455 m. The basin also presents varied climatic settings, the north having a Mediterranean climate, while the southern part presents an arid climate setting. Mean annual rainfall for the 1930–2002 period ranges from 230 mm in the southern part to 550 mm in the northern part of the basin (Laborde Citation1993).
Given this spatial variability in the area’s climate, five sub-catchments were used to analyse the relative sensitivity of runoff to climate characteristics (see ). presents the main hydroclimatic characteristics of the catchments studied, which describe the diverse climatic settings of the Macta basin relatively well.
Table 1 Catchment set and main hydroclimatic variables.
Fig. 1 Location of the Macta basin, major rivers and hydrometric catchments studied.
The land cover of Macta basin is characterized by desert to Mediterranean scrublands in the south-western part of the basin, forested land in the middle-western part and arable land in the eastern part (Cherif et al. Citation2009, El Mahi et al. Citation2012). Water pumping activities dramatically increased during the 1975–2005 period, as presented in , but no quantitative estimates are available.
2.2 Hydroclimatic data used
In this study, flow data at the outlet of the catchments were used at the annual and multiannual time steps, from the available daily database. After delineating the catchments for these gauging stations, mean annual catchment-scale rainfall amounts were estimated from the monthly rainfall network, which consisted of 68 raingauges located within or close to the sub-catchments considered. Missing rainfall data at each station were estimated using data from surrounding stations and linear relationships on the monthly rainfall estimates. Note that missing data were very few, representing only 1.68% on average for the whole set of raingauges.
The Thiessen polygon technique (Thiessen Citation1911) was followed to obtain spatial rainfall estimates for each of the catchment sets over the 1975–2005 time period.
Catchment-scale air temperature data were derived from the climatologically aided interpolated (CAI) datasets produced by the University of Delaware (Willmott and Matsuura Citation1995, Willmott and Robeson Citation1995). Estimates were compared to the air temperature observed for the station at Ghriss, and the high correlation between the observation and re-analysis data suggests that this long-term gridded dataset accurately represents the region’s temperature changes. As the water balance models preferentially used potential evapotranspiration estimates, a simple monthly temperature-based equation was used in this study (Oudin et al. Citation2005, Citation2010).
3 METHODS
3.1 Trend and step changes detection
In this study, we used the classical Mann-Kendall test (Mann Citation1945, Kendall Citation1975), the statistical test most widely used to detect the presence of temporal trends in hydroclimatic data. It measures the association between X and T as the proportion of concordant pairs minus the proportion of discordant pairs in the samples. Two bivariate observations, (Xi, Ti) and (Xj, Tj), are called concordant whenever the product (Xi − Xj)(Ti − Tj) is positive, and discordant when the same product is negative. The Kendall statistic S is the difference between the numbers of concordant and discordant pairs. If X and T are independent and randomly ordered, S has a mean of zero and a variance that is a function of the sample size.
To detect the presence of change points, Pettitt tests (Pettitt Citation1979) were also performed on the time series of annual rainfall, air temperature and flow. The Pettitt test is a widely-used, rank-based, non-parametric test; details are available in the literature (Kundzewicz and Robson Citation2004).
3.2 Water balance model
Considering the catchment as a watertight system, the fundamental water balance quantification can be expressed as:
In this paper, we chose to focus our analysis on the relatively simple Schreiber (Citation1904) equation, which can be expressed as dimensionless as follows:
3.3 Methodology to distinguish observed and climate-driven runoff variations
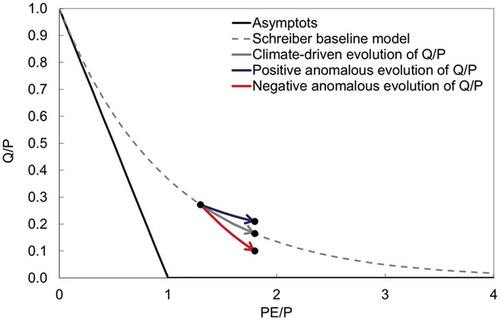
The methodology applied to distinguish the climate-driven runoff variations is derived from the framework proposed by Arora (Citation2002) and recently applied by Jaramillo et al. (Citation2013) on Swedish catchments, and by Coron et al. (Citation2014) on the 14 catchments of the IAHS Workshop “Testing simulation and forecasting models in non-stationary conditions” held in Gothenburg (Sweden) (Thirel et al. Citation2015). Water–energy balance models, such as the Budyko or the Schreiber models, implicitly assume that climate is the sole driver of runoff variability, and they provide a simple dimensionless representation of the links between climate variability and runoff variability. Water balance equations, such as equation (6), can be plotted on a dimensionless graph as in . When climate varies, under the assumption that the Schreiber model is correct, runoff yield might vary accordingly on the baseline of the water balance model. If positive or negative deviation from this baseline is observed, the cause might be a driver other than climate.
Fig. 2 Interpretation of deviations from the climate-driven baseline of water balance models due to climatic variations.
shows the time series of the observed and simulated 3-year runoff-to-precipitation ratios for catchments 0506 and 1403 in calibration and validation modes. The envelopes correspond to the simulations obtained with the 95% confidence intervals for the calibrated model parameter values.
Fig. 3 Observed and simulated 3-year runoff-to-precipitation ratio time series for catchments (a) 0506 and (b) 1403, in calibration and validation modes. The envelopes correspond to the simulations obtained with the 95% confidence intervals for the calibrated model parameter values.
The 30-year record period (1975–2005) was split into two sub-periods: 1975–1990 and 1990–2005. Then, for the first sub-period of each catchment, θ and confidence intervals of were obtained by linearizing the Schreiber formulation and using the ordinary least squares technique. The calibrated parameter was then used to simulate the climate-driven runoff-to-precipitation ratio
for the second sub-period, and the associated confidence intervals, representing parameter uncertainty.
The comparison between the observed runoff-to-precipitation ratio and the climate-driven runoff-to-precipitation ratio allows the assessment of whether climate alone is responsible for the runoff-to-precipitation variability between the two sub-periods.
4 RESULTS
4.1 Changes detection in hydroclimatic series over the last three decades
For each catchment, the Mann-Kendall and Pettitt tests were applied to detect the existence of trends and/or step changes in hydroclimatic time series over the 1975–2005 time period. summarizes the results by indicating the significant trends and change points detected by the tests, and shows the annual time series for the five catchments.
Table 2 Trends and change points of hydroclimatic variables over the 1975–2005 period. “NS” indicates no significant trend at a 95% confidence interval, “+” and “−” indicate a significant increase and decrease, respectively, at a 95% confidence interval. Step change years are indicated if detected as significant.
Fig. 4 Time series of runoff, precipitation and air temperature for the five studied catchments over the 1975–2005 period.
Fig. 5 Examples of runoff coefficient variations and climate-driven runoff coefficient variations provided by the modified Schreiber model: (a) catchment 0506, and (b) catchment 1403.
Over the five catchments studied, no significant trend was observed for the annual catchment-scale rainfall time series. Previous findings over the same region (Meddi et al. Citation2010b, Tramblay et al. Citation2013, Donat et al. Citation2014) detected a significant rainfall decrease, but the different results obtained in this paper stem from the shorter time period considered (1975–2005). The change point in annual precipitation for the region studied occurred in the mid-1970s and therefore it is not detected here.
Concerning air temperature, the five catchments present a significant increase for the 1975–2004 period, which is in agreement with numerous studies over northern-hemisphere Africa (see e.g. Collins Citation2011, Fontaine et al. Citation2013, Donat et al. Citation2014). A significant change point is also detected at the beginning of the 1990s for all catchments.
Trends in the mean annual streamflow time series are mixed. Two catchments (0506 and 1403) presented a significant decrease, and the other three presented no significant trend. The spatial patterns of the trends in streamflow time series (see and ) suggest that small catchments in the hilly western and eastern parts of the Macta basin are more affected by this decreasing trend. This may be due to the absence of any underlying aquifer in these two catchments. A change point in the late 1980s is also detected by the Pettitt test for catchments 0506 and 1403. Consequently, in the following, we consider the change point of 1990, and model flow before and after this change point for the two catchments that present change points and trends in the flow time series.
4.2 Model calibration and validation results
The performance of the modified Schreiber model was assessed through a classical split sample test procedure (Klemeš Citation1986). As explained in Section 4.1, two sub-periods (1975–1990 and 1990–2005) were considered for each catchment in turn. The θ parameter was obtained by solving the following linear equation using the ordinary least squares technique, derived from equation (6):
presents the calibration and validation results for the two sub-periods on catchments 0506 and 1403. The RMSE and bias values of the 3-year averaged runoff-to-precipitation ratios (y) exhibit large discrepancies between calibration and validation. This is due to the shift of the parameter value from the validation to the calibration model on both catchments. Other water balance equations (e.g. Budyko) were tested to improve the results in both calibration and validation, but as very similar results were obtained, we kept the Schreiber model since it is quite simple and allows us to address the uncertainty issue in a straightforward way using the usual regression analysis tools.
Table 3 Performance in calibration and validation of the modified Schreiber model for 3-year averaged runoff-to-precipitation ratio (y). The range of model parameters represents the 95% confidence intervals obtained with the linear equation (7).
4.3 Distinguishing climate-driven runoff variations from total (observed) runoff variations
In this section, we interpret variations of the runoff coefficient from the 1975–1990 time period to the 1990–2005 time period following the methodology described in Section 3.3. Confidence intervals of the θ parameter were used to take into account uncertainties of the model calibrated for the first sub-period.
shows the results for the two catchments. For both catchments, the observed runoff coefficients for the second sub-period lie below the confidence interval, and therefore the decrease cannot be explained by climate alone. This means that a cause other than climate might explain the reduction of runoff. The differences observed on these two catchments compared to the three other study catchments probably lie in the diverse trends of the underlying aquifer levels. Catchments 0506 and 1403 are no longer sustained by aquifers, unlike the three other catchments. This assumption is corroborated by previous studies pointing out the decreasing levels of the piezometric heads of some aquifers in the region (Bekoussa et al. Citation2008).
5 DISCUSSION AND CONCLUSION
In the first part of this paper, we presented a classical change detection analysis of the hydroclimatic data available over the Macta catchment for the 1975–2005 period. Mean annual rainfall on this region encountered a severe shift in the mid-1970s (see e.g. Meddi et al. Citation2010b) that considerably affected runoff amounts, but it seems that, since then, no trend in mean annual rainfall is detectable for the catchment set considered. Conversely, air temperature and consequently potential evapotranspiration have increased steadily over the past three decades. This increase might also explain the runoff reduction observed for some of the study catchments after 1975.
Despite the important role played by climate on runoff variability, many other human-induced causes may influence runoff variability. The effect of climate change on mean annual runoff can be investigated by simple empirical water–energy balance models, such as the Budyko and Schreiber models (Gardner Citation2009). We assessed the relevance of such models to simulate observed runoff variations in catchments located in Algeria. Two of the five catchments studied present a significant decreasing trend in mean annual runoff over the last three decades, with a step change occurring in the late 1980s. Since the evaporative demand increased over these three decades, we determined to what extent this may explain the decrease in runoff on these two catchments. Interestingly, mean annual climate variations are not sufficient to explain the reduced runoff observed, because observed runoff is generally less than the runoff simulated by the water balance model and, therefore, other causes for change need to be investigated.
Increased water pumping probably influences the reduced observed runoff; the water use has probably increased considerably over the three past decades, even if the absence of quantitative data on water withdrawal make it impossible to readily investigate this.
The change in seasonal climate patterns—particularly winter rainfall—might also have influenced the decrease in runoff. This cannot be assessed by classical water balance models with a 3-year time step; consequently, other models should be used at a finer time step, but the quality of finer time step hydrometric data makes it difficult to implement such models. Refinements of water balance models that take into account other inputs, such as rainfall seasonality (Potter and Zhang Citation2009), might also be used to address this issue in a more reasonable way.
Disclosure statement
No potential conflict of interest was reported by the author(s).
Acknowledgements
We are grateful for the hydrometric and rainfall data provided by the Agence Nationale des Ressources Hydrauliques. Pierre Brigode, Marie Sylvestre and Hocine Bendjoudi are also acknowledged for their assistance, comments and suggestions.
Additional information
Funding
REFERENCES
- Arora, V.K., 2002. The use of the aridity index to assess climate change effect on annual runoff. Journal of Hydrology, 265 (1–4), 164–177. doi:10.1016/S0022-1694(02)00101-4
- Ashton, P.J., 2002. Avoiding conflicts over Africa’s water resources. Ambio, 31 (3), 236–242.
- Bekoussa, B.S., Meddi, M., and Jourde, H., 2008. Forçage climatique et anthropique sur la ressource en eau souterraine d’une région semi-aride : cas de la plaine de Ghriss (Nord-Ouest algérien). Sécheresse, 19 (3), 173–184.
- Budyko, M.I., 1974. Climate and life. New York: Academic Press, 508.
- Cherif, E.A., Errih, M., and Cherif, H.M., 2009. Modélisation statistique du transport solide du bassin versant de l’Oued Mekerra (Algérie) en zone semi-aride méditerranéenne. Hydrological Sciences Journal, 54 (2), 338–348. doi:10.1623/hysj.54.2.338
- Collins, J.M., 2011. Temperature variability over africa. Journal of Climate, 24 (14), 3649–3666. doi:10.1175/2011JCLI3753.1
- Coron, L., et al., 2014. Visualising catchment changes in the Turc-Budyko nondimensional space. Hydrological Sciences Journal, 60 (7–8). doi:10.1080/02626667.2014.964245
- Destouni, G., Jaramillo, F., and Prieto, C., 2013. Hydroclimatic shifts driven by human water use for food and energy production. Nature Climate Change, 3 (3), 213–217. doi:10.1038/nclimate1719
- Donat, M.G., et al., 2014. Changes in extreme temperature and precipitation in the Arab region: long-term trends and variability related to ENSO and NAO. International Journal of Climatology, 34 (3), 581–592.
- Dooge, J.C.I., Bruen, M., and Parmentier, B., 1999. A simple model for estimating the sensitivity of runoff to long-term changes in precipitation without a change in vegetation. Advances in Water Resources, 23 (2), 153–163. doi:10.1016/S0309-1708(99)00019-6
- El Mahi, A., Meddi, M., and Bravard, J.P., 2012. Analyse du transport solide en suspension dans le bassin versant de l’Oued El Hammam (Algérie du Nord). Hydrological Sciences Journal, 57 (8), 1642–1661. doi:10.1080/02626667.2012.717700
- Fontaine, B., Janicot, S., and Monerie, P.-A., 2013. Recent changes in air temperature, heat waves occurrences, and atmospheric circulation in Northern Africa. Journal of Geophysical Research: Atmospheres, 118, 1–17.
- Gardner, L.R., 2009. Assessing the effect of climate change on mean annual runoff. Journal of Hydrology, 379 (3–4), 351–359. doi:10.1016/j.jhydrol.2009.10.021
- IPCC (Intergovernmental Panel on Climate Change), 2007. Climate change 2007: the physical science basis. In: S. Solomon, et al., eds. Contribution of Working Group I to the Fourth Assessment Report of the Intergovernmental Panel on Climate Change. Cambridge: Cambridge University Press.
- Jaramillo, F., et al., 2013. Multimethod assessment of evapotranspiration shifts due to non-irrigated agricultural development in Sweden. Journal of Hydrology, 484, 55–62. doi:10.1016/j.jhydrol.2013.01.010
- Kendall, M.G., 1975. Rank correlation methods. 4th ed. London: Charles Griffin.
- Klemeš, V., 1986. Operational testing of hydrological simulation models. Hydrological Sciences Journal, 31 (1), 13–24. doi:10.1080/02626668609491024
- Kundzewicz, Z.W. and Robson, A.J., 2004. Change detection in hydrological records—a review of the methodology. Hydrological Sciences Journal, 49 (1), 7–19. doi:10.1623/hysj.49.1.7.53993
- Laborde, J.P., 1993. Cartes pluviométriques de l’Algérie du Nord à l’échelle du 1/500 000, notice explicative. Agence Nationale des Ressources Hydrauliques, projet PNUD/ALG/88/021.
- Lambs, L. and Labiod, M., 2009. Climate change and water availability in north-west Algeria: investigation by stable water isotopes and dendrochronology. Water International, 34 (2), 280–286. doi:10.1080/02508060902846846
- Mann, H.B., 1945. Nonparametric tests against trend. Econometrica, 13 (3), 245–259. doi:10.2307/1907187
- Meddi, M., Boucefiane, A., and Belabbes, A.S., 2010a. Impact of climate change on runoff in the Chellif basin (Algeria). Global change. Facing Risks and Threats to Water Resources, 340, 95–102.
- Meddi, M. and Hubert, P., 2003. Impact of a change in rainfall levels on water resources of northwestern Algeria. Hydrology of Mediterranean and Semiarid Regions, 278, 229–235.
- Meddi, M., Talia, A., and Bekoussa, B.S., 2008. Evolution of pluviometric regimes in various stations of the Northern Algerian Sahara. In: C. Lee and T. Schaaf, eds. International scientific conference on desertification and drylands research, 19–21 June, Tunis.
- Meddi, M.M., Assani, A.A., and Meddi, H., 2010b. Temporal variability of annual rainfall in the Macta and Tafna catchments, Northwestern Algeria. Water Resources Management, 24 (14), 3817–3833. doi:10.1007/s11269-010-9635-7
- Mouelhi, S., et al., 2006. Linking stream flow to rainfall at the annual time step: the Manabe bucket model revisited. Journal of Hydrology, 328 (1–2), 283–296. doi:10.1016/j.jhydrol.2005.12.022
- Oudin, L., et al., 2005. Which potential evapotranspiration input for a lumped rainfall–runoff model? Part 2, Towards a simple and efficient potential evapotranspiration model for rainfall-runoff modelling. Journal of Hydrology, 303 (1–4), 290–306. doi:10.1016/j.jhydrol.2004.08.026
- Oudin, L., et al., 2008. Has land cover a significant impact on mean annual streamflow? An international assessment using 1508 catchments. Journal of Hydrology, 357 (3–4), 303–316. doi:10.1016/j.jhydrol.2008.05.021.
- Oudin, L., et al., 2010. Estimating potential evapotranspiration without continuous daily data: possible errors and impact on water balance simulations. Hydrological Sciences Journal, 55 (2), 209–222. doi:10.1080/02626660903546118
- Pettitt, A.N., 1979. A non-parametric approach to the change-point problem. Applied Statistics, 28 (2), 126–135. doi:10.2307/2346729
- Potter, N.J. and Zhang, L., 2009. Interannual variability of catchment water balance in Australia. Journal of Hydrology, 369 (1–2), 120–129. doi:10.1016/j.jhydrol.2009.02.005
- Schilling, J., et al., 2012. Climate change, vulnerability and adaptation in North Africa with focus on Morocco. Agriculture, Ecosystems & Environment, 156, 12–26. doi:10.1016/j.agee.2012.04.021
- Schreiber, P., 1904. Über die Beziehungen zwischen dem Niederschlag und der Wasserführung der Flüße in Mitteleuropa. Zeitschrift für Meteorologie., 21, 441–452.
- Thiessen, A.H., 1911. District No. 10, Great Basin. Monthly Weather Review, 39 (8), 1248–1248. doi:10.1175/1520-0493(1911)39<1248a:DNGB>2.0.CO;2
- Thirel, G., et al., 2015. Hydrology under change: an evaluation protocol to investigate how hydrological models deal with changing catchments. Hydrological Sciences Journal, 60 (7–8). doi:10.1080/02626667.2014.967248
- Tramblay, Y., El Adlouni, S., and Servat, E., 2013. Trends and variability in extreme precipitation indices over Maghreb countries. Natural Hazards and Earth System Science, 13 (12), 3235–3248. doi:10.5194/nhess-13-3235-2013
- Wagener, T., 2007. Can we model the hydrological impacts of environmental change? Hydrological Processes, 21 (23), 3233–3236. doi:10.1002/hyp.6873
- Willmott, C.J. and Matsuura, K., 1995. Smart interpolation of annually averaged air-temperature in the United States. Journal of Applied Meteorology, 34 (12), 2577–2586. doi:10.1175/1520-0450(1995)034<2577:SIOAAA>2.0.CO;2
- Willmott, C.J. and Robeson, S.M., 1995. Climatologically Aided Interpolation (CAI) of terrestrial air-temperature. International Journal of Climatology, 15 (2), 221–229. doi:10.1002/joc.3370150207