
ABSTRACT
The aim of this study is to analyse the seasonal characteristics of four Palmer indices calculated on the basis of data from 27 meteorological stations in Romania, and the impact of these indices on river discharges in the period 1931–1998. Our research also tests the influence of large-scale atmospheric circulation on these indices and on discharge. For each season, developments in the empirical orthogonal functions (EOF) and multivariate EOF (MEOF) are achieved. The MEOF representation highlights the overall characteristics of the four Palmer indices. It maximizes specific information for each season compared with individual information of each Palmer index. We then identify geographical areas with homogeneous distribution, taking into account both the discharge distribution and the rotated EOF components of each Palmer index. Finally, we analysed the impact of large-scale atmospheric circulation on hydro-climatic events in Romania by means of the Greenland-Balkan Oscillation Index (GBOI), which is shown to have a greater influence on southeastern Europe than the North Atlantic Oscillation Index (NAOI).
Editor Z. W. Kundzewicz Associate editor not assigned
Introduction
Both hydro-climatic drought and excess discharges are natural phenomena with spatio-temporal extent and intensity still not known sufficiently to allow their disastrous effects to be prevented or mitigated. Climate extremes in recent decades have led to a significant impact on hydrological extremes in Central and Eastern Europe (Kundzewicz et al. Citation2014). Large and damaging floods occur every year; severe drought episodes occur with an increased frequency. These events have had adverse economic and social effects, including considerable loss of life.
For a long time there have been concerns with representing climate variables in a simplified form that reflects the essence of the studied element. The need for a synthetic representation of an ensemble of essential features of natural processes with disastrous consequences (droughts, floods, etc.) arises from the researchers’ or other stakeholders’ desire to understand “at a glance” the mechanisms leading to extreme events. The existence of a lot of indices aimed at reducing the multitude of hydro-meteorological and climatic variables again leads to undesirable complexity. Our study is driven on the one hand by the lack of means to consider the set of indices, and on the other hand by the need to maximize the correlative connections of natural processes that lead to disasters.
Several so-called hydro-climatic state indices have been designed to quantify the state of drought or moisture. This concept of index (most often called “drought index”) has gone through many stages of development, with researchers looking at meteorological drought, hydrological drought, pedological drought, etc. It is intended that these indices, simple or complex, characterize the sequence of extreme and normal states.
The easiest way to define drought is using the main drought generator, i.e. the amount of rainfall in a given period of time. Defining and monitoring drought can be achieved easily (McKee et al. Citation1993) by adopting a standard precipitation index (SPI). This index characterizes hydrological drought quite well, as precipitation is the main factor generating the discharge in a hydrographic network.
More complex indices have been introduced to take into account the water balance, such as the Palmer Drought Severity Index (PDSI), which was initially used in the USA (Palmer Citation1965). Previous research by the authors of this article was focused on the study of extreme events in the Danube basin and followed different methods: in Mares et al. (Citation2002b) the teleconnections between the North Atlantic Oscillation (NAO) or ENSO (El Niño-Southern Oscillation) and drought indices were analysed. The studied indices included the PDSI defined in nine regions of Europe (Briffa et al. Citation1994) and a drought index based on an empirical orthogonal function (EOFDI). The EOFDI was defined by Mares et al. (Citation2002a) by means of the first principal component of the decomposition in empirical orthogonal functions (EOFs) of the temperature and precipitation fields from 31 stations in Romania. Firstly, the research concluded that, although the NAO signal is present in winter, most of its influence does not occur within the same month—there are some lags. Secondly, it was established that the ENSO signal is weak in the precipitation field in Europe; only for some regions are the connections significant. A negative Southern Oscillation Index (SOI) in winter and springtime favours a wetter summer in the northeastern part of Europe.
Mihailescu et al. (Citation2010) analysed the climate variability of drought conditions in Romania by using two indices: a drought index based on temperature and precipitation data and the self-calibrating PDSI (sc_PDSI). The change in these drought indices between the 20th and the 21st centuries was analysed from simulations using the FUB EGMAM model. The results indicated a tendency for dryness for the periods 2018–2028 and 2042–2050, and a tendency for excess moisture for the periods 2005–2018, 2030–2041 and 2090–2098. Chelcea et al. (Citation2013) investigated the seasonal variability of drought phenomena in the Danube River catchment area and its relationship with the large-scale climate anomaly patterns for the spring season (March–May) through a statistical analysis of the sc_PDSI and the standardized precipitation evapotranspiration index (SPEI). Although the SPEI is generally good for Romania, we will show in the present study that Palmer indices are more powerful.
While shortcomings of the Palmer indices have been highlighted by a number of papers (Alley Citation1984, Karl Citation1986, Heim Citation2002, Dai Citation2011), they are currently the most widely used indices that quantify dry or wet periods when estimating ecological, hydrological and agricultural impact.
Alley (Citation1984) was concerned with the ability of Palmer indices to describe drought intensity, spatio-temporal extent and especially the duration of the drought. The weighting factor required for the calculation of the Palmer Z index must be chosen so as to make compatible different geographical areas and different months spanned by the drought. The author was looking for an index that “objectively” reflects the severity of drought in time and space. Alley (Citation1984) found in PDSI this quality that few other indices have and this encouraged us in our current approach. Wells et al. (Citation2004) were concerned with the long-term quantifying of drought conditions using PDSI indices. By comparing PDSI indices, they noted that these indices are inconsistent from location to location and proposed a remedy in the form of “self-calibrating PDSI”. Also, recent criticism (Vicente-Serrano et al. Citation2010) was related to the fact that Palmer indices are unable to adequately describe droughts on time scales of less than 12 months, whereas using PDSI monthly values is generally valid. But from our point of view, quantifying information given by the PDSI on longer intervals of time (seasons, for example) is not a problem. On the positive side (Dai Citation2011), it is worth noting that the PDSI is based on a physical model of water balance and air temperature (and other variables relating to evapotranspiration) as input data and not on a statistical model that includes only precipitation.
In this study we use Palmer indices to classify extreme events in Romania and their impact on discharges. To this effect, we analyse four versions of the Palmer index. Three of the Palmer indices used in the present study, namely the PDSI, the Palmer Hydrological Drought Index (PHDI) and the Palmer Z Index (ZIND), appear in the initial model proposed by Palmer (Citation1965). The fourth index used is the modified Palmer Drought Severity Index (WPLM), which, as mentioned in Vicente-Serrano et al. (Citation2012), was proposed by the National Weather Service Climate Analysis Center for operational meteorological purposes (Heddinghaus and Sabol Citation1991). Drought phenomena are defined by negative values of the Palmer drought index; positive values define periods of wetness.
A second topic covered in this study is the influence of the Greenland-Balkan Oscillation Index (GBOI) on Palmer indices. We found that the GBOI is well correlated with discharges in the lower Danube region (Mares et al. Citation2013). In the next section the data used and the methodology of the work are described. The most important results and discussion are then presented, followed by the conclusion.
Data and methodology
In this study, we used the average monthly discharge series for 27 gauging stations () distributed relatively uniformly across the country for the period 1931–1998. For the same period we used series of precipitation and average monthly air temperature provided by the Climatic Research Unit (CRU) TS3.10.01 (http://climexp.knmi.nl). Datasets are calculated on high-resolution (0.5° × 0.5°) grids by the CRU.
Table 1. Geographical information about the analysed stations.
The complete calculation procedure for the PDSI is found in many publications (Karl Citation1983, Citation1986, Alley Citation1984). The self-calibrating Palmer indices (Wells et al. Citation2004) were developed to improve the performance of the Palmer indices.
In the present paper the Palmer indices or_PDSI, or_PHDI, or_WPLM, or_ZIND (“or” stands for “original”) and the self-calibrating indices sc_PHDI and sc_PHDI (“sc” stands for “self-calibrating”) were calculated on a monthly basis using a routine developed by Nathan Wells from the National Agricultural Decision Support System (http://nadss.unl.edu). The routine takes as inputs the precipitation, temperature and available water capacity (AWC). The AWC values were extracted from the Harmonised World Soil Database (FAO/IIASA/ISRIC/ISSCAS/JRC Citation2012) for each of the 27 stations in our study. All analyses were achieved using the seasonal averages for all variables considered in this study.
In order to see the influence of large-scale atmospheric circulation on Palmer indices for Romania, we considered the seasonal mean values of sea level pressure field (SLP) on the sector (50°W–40°E, 30°–65°N). We first attempted extracting SLP values from ERA-40, which is a re-analysis of meteorological observations from September 1957 to August 2002 produced by the European Centre for Medium-Range Weather Forecasts (ECMWF) in collaboration with many institutions (Uppala et al. Citation2005). As the ERA-40 dataset starts from 1958, we had to extract SLP data for the remaining period from the National Center for Atmospheric Research (NCAR), (http://rda.ucar.edu/datasets/ds010.1). As mentioned in the associated documentation, this dataset contains the longest continuous time series of monthly gridded Northern Hemisphere SLP data in the DSS archive. The 5° latitude/longitude grids, computed from the daily grids in ds010.0, begin in 1899 and cover the Northern Hemisphere from 15°N to the North Pole. The accuracy and quality of this dataset is discussed in Trenberth and Paolino (Citation1980).
A synoptic analysis of the trajectories of baric formations on the Atlantic-European sector and their impulses led to the creation of a bipolar baric structure that acts in the Balkans, leading to heavy rainfall or to drought states of varying severity. In this way, we defined a new atmospheric index, the Greenland-Balkan Oscillation Index (GBOI). This index is described in (Mares et al. Citation2013).
In the present study we used the development in EOFs. Data analysis using EOFs has become a standard procedure in meteorological and oceanographic studies. Lorenz (Citation1956) introduced the EOF analysis to earth sciences. The most important reason for its widespread use is that this method describes the variation of a complex geophysical field with a relatively small number of functions and associated time coefficients. This allows the development of statistical models based on a reduced number of predictors. If the components are rotated, the method can be applied to any variable observed in grid points or at stations (Richman Citation1986), potentially helping derive physical interpretations.
Many different EOF techniques are available. For instance, the extended EOF (EEOF) version identifies those patterns coherent both in space and in time. The EEOF method was applied in Mares and Mares (Citation2003) using a 3-month data window on temperature and precipitation fields in Romania. An autoregressive (AR) model was used to produce forecasts of the time series of the EEOF components.
First of all, in the present analysis, we considered the first principal components (PC1) of development in EOF (PC1_Q27) for the seasonal discharge (Q) in Romania. Also, each of the four Palmer indices (both original and self-calibrating) was developed in EOFs. Then, to extract the most important information (maximizing the correlative link) of all these indices, we used the procedure of MEOFs development (multivariate EOFs). We called this methodology MEOF4, because it was applied to the four time series corresponding to the four original Palmer indices. We applied the MEOF procedure in previous papers (Mares et al. Citation2009, Citation2014), where the efficiency of this approach when considering more than two climate fields has been demonstrated.
We then used the varimax rotation EOFs to highlight homogeneous climate areas in Romania. We considered five equally probable classes by aquantile method to see the limits of extreme climatic events quantified by Palmer indices.
In order to demonstrate the connection between large-scale atmospheric pressure quantified by GBOI and Palmer indices or discharges, besides the correlative analyses, we generated composite maps. The analysis of the correlation between the original Palmer indices and the self-calibrating ones with discharges revealed that for the Romanian territory the original indices are the most efficient. Therefore, all investigations in this paper focus on the original Palmer indices.
Results and discussion
Firstly, we calculated the correlation between the PC1 of the Palmer indices (PC1_XXX, where XXX is one of the four Palmer indices) with the PC1 of the seasonal discharges (PC1_Q27). PC1 is the first principal component, which is representative of the 27 stations for the period 1931–1998.
The variance of the first EOF component is presented in . One can note that the highest values of the variance assigned to the first EOF component is in the autumn season, when EOF1 for or_WPLM, or_ZIND indices and for the river discharge (Q_27) explains more than 65% of total variance of each variable. The smallest variance corresponding to EOF1 is observed in winter, except for the or_ZIND index, for which the smallest variance is during the summer, and the or_PHDI, for which the variance during spring and summer is slightly smaller than in winter.
Table 2. EOF1 variance (%) for the four Palmer indices and for rivers discharges.
The PC1 correlation of the corresponding indices with the PC1_Q27 was calculated separately for each season. Simultaneous correlation showed statistically significant links between PC1_Q27 and each PC1 of the mentioned indices for all seasons. The correlation coefficients are given in . At a 99% confidence level for a statistical sample with a number of degrees of freedom of 60, correlation coefficients must be greater than 0.325 and for a sample of 70, greater than 0.302. In our case, the number of degrees of freedom is 66, which means that all the correlations are statistically significant. It is worth noting that in the winter season, the correlations are lower in absolute value. Positive or negative values are due to how individual indices are calculated.
Table 3. Correlation coefficients between PC1_Q27 and PC1 of drought indices (1931–1998).
For the spring season, the or_WPLM index is noteworthy as it correlates best with the discharge. During the summer, the or_WPLM and MEOF4 indices (which represent the PC1 for the MEOF4 development of the time series of the four considered Palmer indices) have the best link with the discharge. For autumn, the closest correlation with the discharge is found for the PC1 corresponding to MEOF4 (PC1_MEOF4). For winter all indices bring a lower contribution to the discharge compared to other seasons. From , it can be noticed that, overall, the index defined by MEOF is more powerful than any of the considered indices.
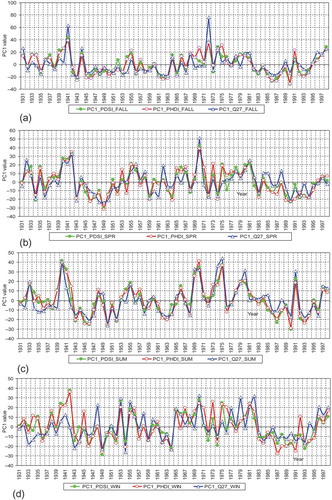
presents the behaviours of two PC1s of the or_PDSI and or_PHDI indices, compared with the PC1 of the discharge, for the four seasons. This shows that there is a good agreement of phases for the PC1 of Palmer indices and PC1 of discharge, especially in the summer.
Figure 1. PC1 for discharges in comparison with PC1 for or_PDSI and or_PHDI: (a) spring, (b) summer, (c) autumn and (d) winter.
shows the evolution of the PC1_Q27 in comparison with the PC1_or_WPLM index and PC1_or_ZIND for all seasons. As for or_PDSI and or_PHDI (), the or_WPLM and or_ZIND indices reflect a good agreement with the discharge time series. The or_WPLM may be a good predictor for discharge during the spring and summer seasons and or_ZIND during autumn.
Figure 2. PC1 for discharges in comparison with PC1 for or_WPLM and for or_ZIND: (a) spring, (b) summer, (c) autumn and (d) winter.
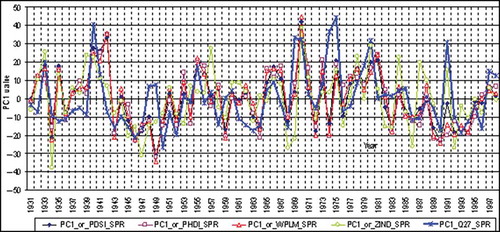
The PC1 time series for each of the or_PDSI, or_PHDI, or_WPLM and or_ZIND indices for the spring season compared with PC1_Q27 is shown in . This graphical representation reveals that it is relatively difficult to interpret the phases of each index with the discharge index phase. At times the phases are simultaneous, but at some points in the time series there are significant deviations. However, each of these indices has its own advantages as described below. Some of these indices capture better the drought beginning, others the persistence or its end.
Figure 3. PC1 for discharges in comparison with PC1 for each of the four Palmer indices for spring.
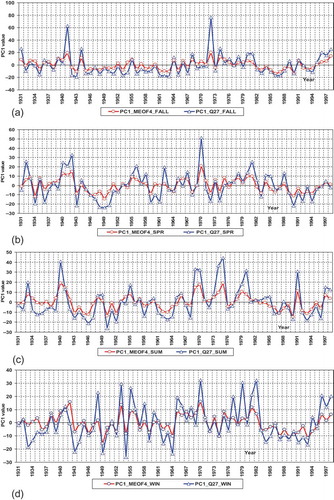
shows that for the spring season the PC1_MEOF4 index evolves in phase with the discharges represented through PC1, which is not the case for any of the four Palmer indices. This highlights the value of PC1_MEOF4, as it gives more information than the four indices taken separately. The evolutions for the other seasons shown in (b)–(d) also highlight the superiority of the PC1_MEOF4 index. In the summer season (), this performance is most evident according to (correlation coefficient 0.89).
Figure 4. PC1 for discharges against PC1 for MEOF4 for: (a) spring, (b) summer, (c) autumn and (d) winter.
Along with the indices presented thus far, which were calculated at local scale, it is very important to have an understanding of large-scale circulation to be able to predict hydrological conditions. For this purpose we could use the NAO, which has an important influence on hydro-climatic events over Europe. However, although the NAO index has a statistically significant impact on Romania (Mares et al. Citation2002a, Citation2002b), its influence is not as strong as on other areas of Europe (López-Moreno et al. Citation2011). This assertion is corroborated by tests performed on Palmer indices analysed in this paper. For example, the correlation of the NAO index with PC1_or_ZIND and PC1_MEOF4 in winter has coefficient values of – 0.49 and – 0.33, which although statistically significant are not very high. By comparison, the correlation of the GBOI with PC1_or_ZIND during winter () and PC1_MEOF4 () results in coefficients of 0.74 and 0.48 at a confidence level of 99%. This shows that the GBO index is superior to the NAO index as a means of calculating river discharges in Romania, quantified by PC1. The correlation coefficient between PC1_Q27 and GBOI is 0.58, while the correlation coefficient between PC1_Q27 and NAOI is only – 0.35. The time series of PC1_Q27 and GBOI are presented in .
Figure 5. PC1 for or_ZIND in comparison with atmospheric index GBO for winter (R = 0.74).
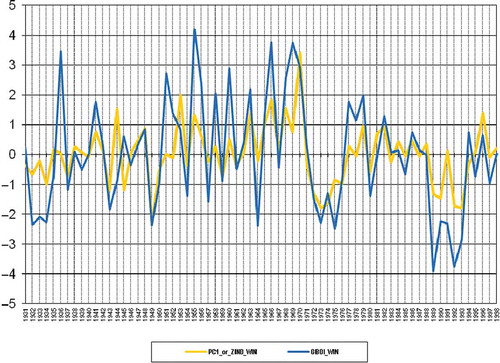
Figure 6. PC1 of MEOF4 in comparison with the atmospheric index GBOI for winter (R = 0.48).
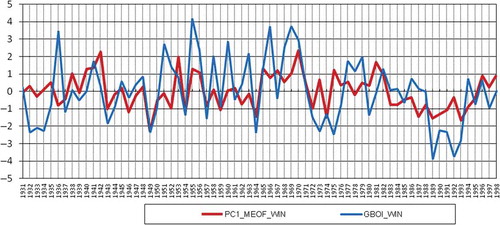
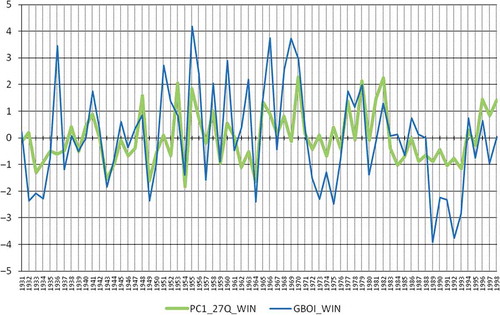
Figure 7. PC1 of winter discharges in comparison with winter GBOI (R = 0.58).
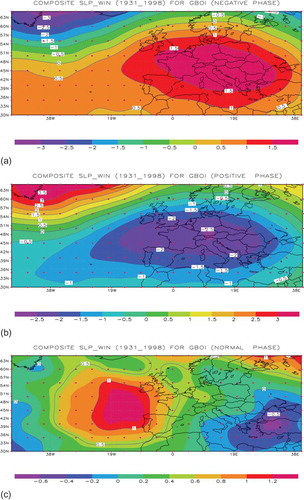
The correlative analysis between GBOI and Palmer indices with some season lags had a statistically significant result between GBOI in winter and PC1_or_WPLM index during spring (). The concordance of the GBOI with PC1_or_WPLM is remarkable; therefore, the GBOI can be used as a precursor of hydrological conditions in the spring season in Romania. Composite maps for the three states of GBOI are presented in (a)–(c). The SLP composites for the negative/positive phases of GBOI clearly show that SLP anomalies correspond to a deficit/excess of the hydro-meteorological state of a large geographical area that includes Romania.
Figure 8. PC1 of or_WPLM spring in comparison with winter GBOI (R = 0.41).
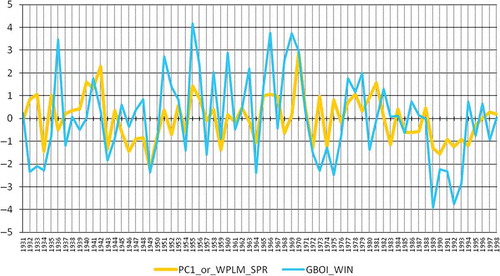
Figure 9. Composite map of normalized SLP for three states of winter GBOI (1931–1998): (a) negative; (b) positive and (c) normal.
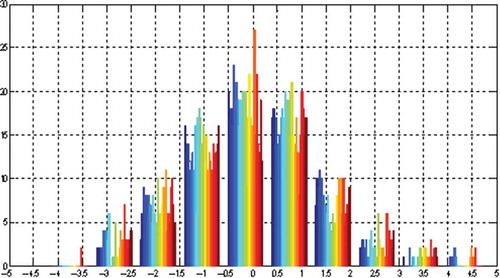
Since the or_WPLM index is a good predictor for discharges and responds well to the external forcing we considered, that is, to the atmospheric circulation quantified by GBOI, we took this index (or_WPLM) as an example to highlight the range of the spatial extent of drought frequency in the territory of Romania. Thus, in is shown the histogram for the 27 stations for the or_WPLM index for the spring season. We notice a significant variation in this set, as the distribution of hydrological stations in Romania is uneven.
Figure 10. Histogram for or_WPLM (27 stations) in spring.
Aiming to highlight extreme events, we divided the Palmer indices in to five equally probable classes. The upper and lower limits of this classification for the four indices relative to the 27 stations are shown in . As an example of the local characteristics of these indices, shows the evolution of the four Palmer indices for the Chisineu-Cris station in spring; this station is representative of a hydro-climatically homogeneous distribution of north western Romania. Horizontal lines represent quantile limits: lower (q5_inf) and higher (q5_sup) for the or_PHDI index. Values below q5_inf belong to the first class, while values greater than q5_sup belong to the fifth class.
Figure 11. Spring evolutions of the or_PDSI, or_PHDI, or_WPLM and or_ ZIND indices; q5_inf and q5_sup represent the lower and upper quantile, corresponding to or_PHDI for the Chisineu-Cris station.
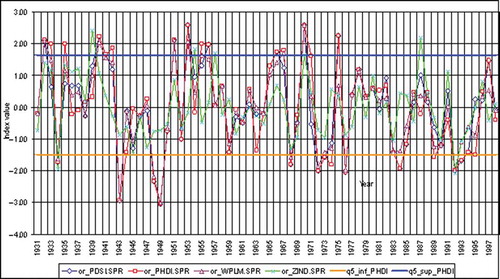
Table 4. Lower and upper quantiles (five classes) for the four Palmer indices for 27 stations.
shows all four quintile values that we used for dividing the five classes of the four Palmer index at the Chisineu-Cris station for spring. The five Palmer index classes characterize the hydrological regime installed in the basin for the analysed period. Although the large variability in results does not show evident homogenous hydrological areas, a more rigorous analysis does reveal a number of such characteristics in Romania. To check this hypothesis of homogenous hydrological areas in Romania, we calculated composites for extreme hydrological states in the winter season, which are shown in and . corresponds to quintile 1 (drought—values less than 20th percentile), while corresponds to quintile 4 (discharge surplus—values greater than the 20th percentile). Composite maps for the lower quintile shown in (negative anomalies for the winter discharge between 0 and −65) outline three main nuclei: one more pronounced in the north-west of Romania, one in the southwest and the third, least important, located in Wallachia. shows composite maps for the upper quintile. There is a similar spatial distribution of anomaly nuclei for the winter season except that the anomalies are positive and more intense (0–95 units).
Figure 12. Composite map for winter discharge anomalies corresponding to the first class.
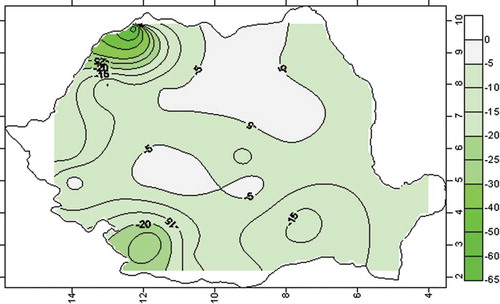
Figure 13. Composite map for winter discharge anomalies corresponding to the fifth class.
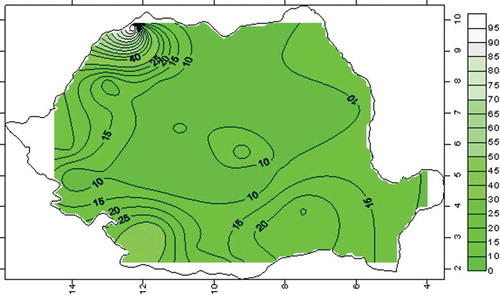
Table 5. Quintile values for the Palmer indices for Chisineu-Cris station in spring.
For the winter period, the multi-annual average atmospheric pressure was calculated in correspondence with extreme hydrological states. For the SLP composite maps, the extreme hydrological states were highlighted by means of PC1_Q27. In we find that the synoptic generator of hydrological drought has a maximum barometric that persists throughout southern Europe, with a nucleus anticyclone centred precisely on Romania. The pressure distribution shown in can be seen as a synoptic generator for excess discharge in Romania, totally different from the previous one, with a notable depression area in the central and eastern Mediterranean region. These two opposite types of baric formations produce either extreme hydrological drought or excess rainfall (and implicit hydrological excess) in Romania.
Figure 14. Composite maps of SLP (hPa) corresponding to the winter discharges (PC1_Q27) in Romania for: (a) deficitar discharge and (b) excedentar discharge.
In the spring season (not shown here), negative anomalies of the discharges (severe drought outlined by the lower quintile) are much larger in absolute value than in winter. A similar situation occurs for the upper quintile during spring, recorded by positive anomalies. The higher spread of anomalies in the spring season is of course due on the one hand to convective clouds, which favour increased amounts of rainfall, and on the other hand, to higher temperatures, leading to an additional contribution of water from melting snow in mountain areas. These baric configurations specific to drought, or to the extremely wet conditions that lead to discharge extremes in Romania, can be used in the analysis of general circulation model (GCMs) outputs to generate predictions for the 21st century by applying the conditional analogy method. In this way we obtain useful indirect information that contributes to evaluating the drought and excess hydrological state sequence in Romania. This assessment is made only to the extent to which PC1 from the developments in EOFs of river discharges in major river basins in Romania explains a significant amount of the total variance.
It is important to quantify spatial water resources, which can be assessed by determining homogeneous areas in Romania in terms of territorial distribution of river discharges. There are several evaluation methods that can be applied to these homogeneous zones, including the handy cluster method. This method consists of finding similarities and non-similarities using the distance from a central point (Euclidean) or compared to an ellipsoid axis (Mahalanobis distance). These geometrical measures do not take into account the connection between processes occurring in different areas. The method that eliminates this drawback is rotated EOFs (Lorenzo-Lacruz et al. Citation2013). This method maximizes information about spatially associated events. In Mares (Citation1988), the EOF technique with varimax rotation (Richman Citation1986) was used in order to find homogenous areas of temperature and precipitation variability in Romania.
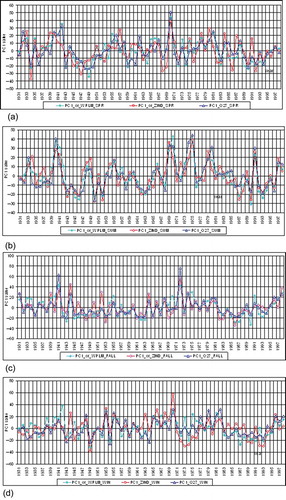
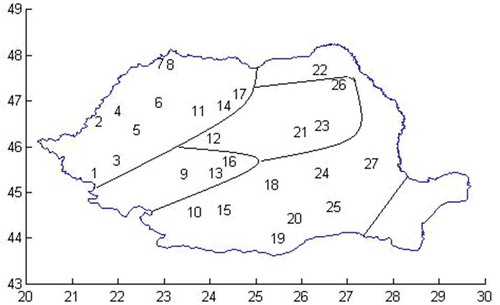
In accordance with Loukas et al. (Citation2002), the significant weights of each component (rotated EOFs) lead to the shaping of homogeneous areas based on the uniformity of the correlative link from that area. We followed a similar procedure in the present work to identify homogeneous hydrological areas in Romania. We present here the homogeneous areas obtained for the spring season, the season in which occur the largest discharges in the lower basin of the Danube (Mares et al. Citation2009). highlights five homogeneous areas determined by the significant weights of the first five rotated spatial modes values (EOF1–5) of discharges in the spring season. Note that the Dobrogea sector is not included in the analysis as there were no representative stations available for this sector to include in our study. In are represented the homogeneous areas (four in number) determined by the weights of the first four rotated significant spatial modes (EOF1–4) of the WPLM index for spring. A similarity between the repartition of the homogeneous areas in Romania ( and ) can be noticed on the basis of these criteria. The numbers in these figures represent the position of the stations included in our analysis; their names and coordinates are listed in .
Figure 15. Homogeneous zones obtained from the significant weights of the first five EOFs rotated for the spring discharges (1931–1998).
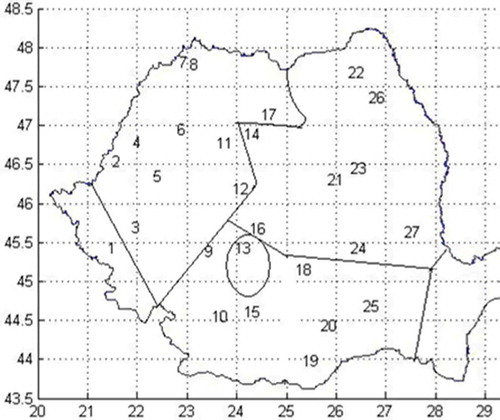
Figure 16. Homogeneous zones determined from the significant weights of the first four EOFs rotated for the spring or_WPLM index(1931–1998).
Conclusions
We resolved a number of issues as part of the present study, which help to fill gaps in the specialty literature. These include identifying planetary-scale atmospheric factors that have a major impact on the regional and local water regime, and the development of robust methods for highlighting essential hydro-climatic characteristics in a highly differentiated orographic area such as Romania.
The present study adds substantial information towards hydrological management at seasonal level for the assessment of extreme events on the one hand, and the separation of a territory into areas that are homogeneous from a hydrological point of view, on the other. It should be noted that the PC1_MEOF4 index defined in this paper, derived from the four original Palmer indices (1931–1998), gives an ensemble solution and is more powerful than any of the four indices taken separately. This method can be seen as a maximization of the correlative link of four characteristics of each Palmer index, captured and summarized as a single index.
The PC1_MEOF4 index adds information about the evolution in phase with the discharges represented by PC1, especially for the autumn and winter seasons, where in comparison with the individual indices, this index shows the closest connection with the discharge (correlation coefficients of 0.86 and 0.77). This link is close in summer too, but with the same correlation coefficient of 0.89 as the or_WPLM index. In spring, the PC1_or_WPLM shows a close connection (0.87) with PC1_Q27, while the correlation coefficient between the PC1_MEOF4 index and PC1_Q27 has a value of 0.85. It is noteworthy that all correlations have a very high significance level. In the present analysis, the number of degrees of freedom is 66 and at the 99% confidence level correlation coefficients must be around 0.310. Therefore, the four original Palmer indices (PDSI, PHDI, WPLM and ZIND) taken both individually and in their overall characteristics (MEOF4) are very good predictors for river discharges in Romania. This result is very important for predicting future discharge states, as these Palmer indices can be calculated from temperatures and precipitation simulated by GCMs or regional circulation models (RCMs).
The influence of large-scale atmospheric circulation was quantified by the GBOI and we found that this index is more powerful than the NAO index. GBOI can be a good estimator of hydrological events in Romania in the winter season. Also, the correlation with a high level statistical significance that we identified between the winter GBOI and the spring or_WPLM index leads to the conclusion that the atmospheric GBOI in winter can be used as a good precursor for hydrological states in the spring season in Romania.
To highlight extreme events, the quantiles method was applied. By means of quintiles, the analysed time series were divided into five equally probable classes. The values that were lower than the first quintile or higher than the fourth quintile were considered extreme events, i.e. either drought events or wet events that determine deficit or excessive discharges.
Composite maps were constructed for both extreme discharges and for synoptic situations calculated from SLP. Using these maps, we highlighted the position of the baric centres in Europe, which correspond to the extreme discharges that occur on interior rivers in Romania.
To highlight climate-homogeneous areas in Romania, we used the varimax rotation of the EOFs, taking into account only the significant weights of the first rotated EOFs. Despite the diversity of the hydric regime, our hypothesis of homogeneous zones and their distribution is demonstrated through four to five zones from all catchment areas of Romania. The structure of the homogeneous areas for the discharge field in Romania is similar to homogeneous zones obtained on the basis of the or_WPLM Palmer index.
In this study we performed a rigorous statistical analysis of water regime variability and its causes at local and regional levels. We achieved this in an area that has a high spatial and temporal variability of river discharge (Romania), aiming to improve water management over long time intervals (at season level).
For a better understanding of physical mechanisms, we propose to verify GCM/RCM outputs in the future to find out to what extent these reproduce the European baric configurations quantified by the GBOI, which lead to extreme hydrological conditions in Romania.
As is shown in Palmer et al. (Citation2004), the best solution for seasonal forecasting is to use the full multimodel ensemble. Therefore, the present investigation would add great value to the seasonal prediction of river discharges in Romania if the predictive characteristics of the GBOI were confirmed by analysing the solutions of a multimodel ensemble, such as the models produced by European long-range forecasting centres.
Also, by generating estimations of extreme hydrological states in Romania according to the drought indices provided by the climate models, the management of water resources becomes possible even over large time intervals.
Acknowledgements
The authors are grateful to the two anonymous reviewers for their very useful suggestions and comments.
Disclosure statement
No potential conflict of interest was reported by the author.
Additional information
Funding
References
- Alley, W.M., 1984. The Palmer drought severity index: limitations and assumptions. Journal of Climate and Applied Meteorology, 23, 1100–1109. doi:10.1175/1520-0450(1984)023<1100:TPDSIL>2.0.CO;2
- Briffa, K.R., Jones, P.D., and Hulme, M., 1994. Summer moisture variability across Europe, 1892–1991: an analysis based on the Palmer drought severity index. International Journal of Climatology, 14, 475–506. doi:10.1002/joc.3370140502
- Chelcea, S., et al., 2013. Seasonal variability of the drought phenomena in the Danube River catchment area and its relationship with large-scale anomaly patterns in spring. EGU General Assembly 2013, 7–12 April, 2013, Vienna, Austria, EGU2013-7078.
- Dai, A., 2011. Characteristics and trends in various forms of the Palmer drought severity index during 1900–2008. Journal of Geophysical Research, 116, D12115. doi:10.1029/2010JD015541
- FAO/IIASA/ISRIC/ISSCAS/JRC. 2012. Harmonized world soil database (version 1.2). FAO, Rome, Italy and IIASA, Laxenburg, Austria.
- Heddinghaus, T.R. and Sabol, P., 1991. A review of the Palmer drought severity index and where do we go from here? Proceedings of the Seventh Conference on Applied Climatology, Salt Lake City, UT. American Meteorological Society, 242–246.
- Heim, R.R., 2002. A review of twentieth-century drought indices used in the United States. Bulletin of the American Meteorological Society, 83, 1149–1165. doi:10.1175/1520-0477(2002)083<1149:AROTDI>2.3.CO;2
- Karl, T.R., 1983. Some spatial characteristics of drought duration in the United States. Journal of Climate and Applied Meteorology, 22, 1356–1366. doi:10.1175/1520-0450(1983)022<1356:SSCODD>2.0.CO;2
- Karl, T.R., 1986. The sensitivity of the Palmer drought severity index and Palmer’s Z-Index to their calibration coefficients including potential evapotranspiration. Journal of Climate and Applied Meteorology, 25, 77–86. doi:10.1175/1520-0450(1986)025<0077:TSOTPD>2.0.CO;2
- Kundzewicz, Z.W., et al., 2014. Flood risk and climate change: global and regional perspectives. Hydrological Sciences Journal, 59 (1), 1–28. doi:10.1080/02626667.2013.857411
- López-Moreno, J.I., et al., 2011. Effects of the North Atlantic Oscillation (NAO) on combined temperature and precipitation winter modes in the Mediterranean mountains: observed relationships and projections for the 21st century. Global and Planetary Change, 77, 62–76. doi:10.1016/j.gloplacha.2011.03.003
- Lorenz, E.N., 1956. Empirical orthogonal functions and statistical weather prediction. Statistical Forecasting Project Scientific Rep. 1, Department of Meteorology, Massachusetts Institute of Technology, Cambridge, MA, 49 pp.
- Lorenzo-Lacruz, J., et al., 2013. Streamflow droughts in the Iberian Peninsula between 1945 and 2005: spatial and temporal patterns. Hydrology and Earth System Sciences, 17, 119–134. doi:10.5194/hess-17-119-2013
- Loukas, A., Vasiliades, L., and Dalezios, N.R., 2002. Hydroclimatic variability of regional droughts in Greece using the Palmer moisture anomaly index. Nordic Hydrology, 33 (5), 425–442.
- Mares, C., et al., 2014. A hidden Markov model applied to the daily spring precipitation over the Danube basin. Advances in Meteorology, 11, 2014. Article ID 237247. doi:10.1155/2014/237247
- Mares, C. and Mares, I., 2003. Improvement of long-range forecasting by EEOF extrapolation using an AR-MEM model. Weather and Forecasting, 18, 311–324. doi:10.1175/1520-0434(2003)018<0311:IOLFBE>2.0.CO;2
- Mares, I., Mares, C., and Mihailescu, M., 2002a. NAO impact on the summer moisture variability across Europe. Physics and Chemistry of the Earth, Parts A/B/C, 27, 1013–1017. doi:10.1016/S1474-7065(02)00135-3
- Mares, C., Mares, I., and Mihailescu, M. 2002b. Testing of NAO and ENSO signals in the precipitation field in Europe. In: M. Beniston, eds. Climatic change: implications for the hydrological cycle and for water management. Advances in global change research. Vol. 10. Dordrecht: Kluwer Academic Publications, 113–121.
- Mares, C., Mares, I., and Stanciu, A., 2009. Extreme value analysis in the Danube lower basin discharge time series in the twentieth century. Theoretical and Applied Climatology, 95, 223–233. doi:10.1007/s00704-008-0001-0
- Mares, I., 1988. Factor analysis of monthly temperature and precipitation and determination homogeneous zones over Romania territory. Meteorology and Hydrology, 18, 23–27.
- Mares, I., Mares, C., and Mihailescu, M., 2013. Stochastic modelling of the connection between sea level pressure and discharge in the Danube lower basin by means of Hidden Markov Model. EGU general assembly conference abstracts, 15, 7606.
- McKee, T.B., Doesken, N.J., and Kleist, J., 1993. The relationship of drought frequency and duration of time scales. Eighth conference on applied climatology, American meteorological society, Jan 17–23, 1993, Anaheim, CA, pp.179–186.
- Mihailescu, M., et al., 2010. Climate variability of drought indices in Romania in the 20-th and 21-st centuries. Proceedings of the international conference on water observation and information system for decision support. Ohrid Republic of Macedonia: Balwois.
- Palmer, T.N., et al., 2004. Development of a European multimodel ensemble system for seasonal-to-interannual prediction (Demeter). Bulletin of the American Meteorological Society, 85, 853–872. doi:10.1175/BAMS-85-6-853
- Palmer, W.C., 1965. Meteorological drought. Rep. 45, 58 pp, US Department of Commerce, Washington, DC. Available at: http://www.ncdc.noaa.gov/temp-and-precip/drought/docs/palmer.pdf.
- Richman, M.B., 1986. Rotation of principal components. International Journal of Climatology, 6, 293–335. doi:10.1002/joc.3370060305
- Trenberth, K.E. and Paolino, D.A., 1980. The Northern Hemisphere sea level pressure data set: Trends, errors, and discontinuities. Monthly Weather Review, 108, 855–872. doi:10.1175/1520-0493(1980)108<0855:TNHSLP>2.0.CO;2
- Uppala, S.M., et al., 2005. The ERA-40 re-analysis. Quarterly Journal of the Royal Meteorological Society, 131, 2961–3012.
- Vicente-Serrano, S.M., et al., 2010. A new global 0.5° gridded dataset (1901–2006) of a multiscalar drought index: comparison with current drought index datasets based on the Palmer drought severity index. Journal of Hydrometeorology, 11, 1033–1043. doi:10.1175/2010JHM1224.1
- Vicente-Serrano, S.M., et al., 2012. Performance of drought indices for ecological, agricultural, and hydrological applications. Earth Interactions, 16, 1–27. doi:10.1175/2012EI000434.1
- Wells, N., Goddard, S., and Hayes, M.J., 2004. A self-calibrating Palmer drought severity index. Journal of Climate, 17, 2335–2351. doi:10.1175/1520-0442(2004)017<2335:ASPDSI>2.0.CO;2