
ABSTRACT
Glacier-melt-induced changes in runoff are of concern in northwestern China where glacier runoff is a major source for irrigation, industries and ecosystems. Samples were collected in different water mediums such as precipitation, glacial ice/snowcover, meltwater, groundwater and streamwater for the analysis of stable isotopes and solute contents during the 2009 runoff season in the Laohugou Glacial Catchment. The multi-compare results of δ18O values showed that significant difference existed in different water mediums. Source waters of streamflow were determined using data of isotopic and geochemical tracers and a three-component hydrograph separation model. The results indicated that meltwater dominated (69.9 ± 2.7%) streamflow at the catchment. Precipitation and groundwater contributed 17.3 ± 2.3% and 12.8 ± 2.4% of the total discharge, respectively. According to the monthly hydrograph, the contribution of snow and glacier meltwater varied from 57.4% (September) to 79.1% (May), and that of precipitation varied from 0% (May) to 34.6% (September). At the same time, the monthly contribution of groundwater kept relatively steady, varying from 9.7% (June) to 20.9% (May) in the runoff season. Uncertainties for this separation were mainly caused by the variation of tracer concentrations. It is suggested that the end-member mixing analysis (EMMA) method can be used in the runoff separation in an alpine glacial catchment.
Editor Z.W. Kundzewicz; Associate editor Not assigned
1 Introduction
It is estimated that 1/6 of the global population derives much of their water from glacier and snow-fed watersheds (Barnett et al. Citation2005, Kundzewicz et al. Citation2007). During the summer months glacial meltwater may provide the only source of water for some alpine valleys and dry lowlands (Bradley Citation2006, Casassa et al. Citation2009). Widespread glacier recession has been occurring over the past half century (Kundzewicz et al. Citation2007). Continued decline of glacier mass results in a transient increase in river discharge and has many implications operating on all spatial scales (Dyurgerov and Carter Citation2004, Hock et al. Citation2005, Blume et al. Citation2008, Yao et al. Citation2012, Gao et al. Citation2013). In conjunction with glacier shrinkage, many land systems suffer from altered precipitation regimes, drought and reduced snowpack, further exacerbating the effects of climate change on water supply (Barnett et al. Citation2005, Kundzewicz et al. Citation2007, Stewart Citation2009). Rapidly melting alpine glaciers are a source of flooding (Immerzeel et al. Citation2010).
Glacier-melt-induced changes in runoff are of concern in areas such as northwestern China where glacier runoff is a major source for irrigation, industries and ecosystems. Recent research indicates that 82.2% of all the monitored glaciers in China retreated with 41.5% glacier area loss from the late 1950s to the late 1990s (Liu et al. Citation2006). The glacial retreat has caused an increase of 5–13% in river runoff in northwestern China (Xiao et al. Citation2008). Another study in northwestern China found that runoff volumes were enhanced initially due to the glacier melt disequilibrium and followed by runoff decline along with the rapid shrinking of the glaciers (Ding et al. Citation2006).
The stable isotopic compositions in natural waters in the water cycle respond to environmental variation very sensitively (Joussaume et al. Citation1984). The stable isotopic compositions in different water mediums can indicate the change of geographic environment or mark the recharge of runoff using their physical tracer function (Dansgaard Citation1964). Stable isotope composition of water has been successfully used as naturally occurring hydrologic tracers to constrain estimates of the contributions of different water sources to streamflow, including snowmelt, glacier meltwater and groundwater baseflow (Dinçer et al. Citation1970, Hooper and Shoemaker Citation1986, Rodhe Citation1998, Rock and Mayer Citation2007, Zhang et al. Citation2009, Pu et al. Citation2012).
The separation of a hydrograph into its component parts is important for many types of water resources planning and management projects. Consequently, many approaches have been developed to estimate the contributions of different components to surface water, which cannot be directly measured. End member mixing analysis (EMMA) (Christophersen and Hooper Citation1992) is a widely accepted approach to identify the contributions of different components to runoff and evaluate streamflow generation mechanisms. Most commonly, isotope tracers, in conjunction with geochemical tracers (major ions, trace elements, dissolved organic carbon, etc.), have been used to compute multiple contributions to a streamflow, which have also been helpful for establishing or redefining hydrological models at catchment scale (e.g. Hooper et al. Citation1990, Buttle Citation1994). EMMA techniques have been applied in a variety of studies, at both the plot and the catchment scales (Barthold et al. Citation2010). These studies were primarily developed at sites in the temperate zone (Dinçer et al. Citation1970, Hooper et al. Citation1990, McDonnell et al. Citation1990, Soulsby et al. Citation2003, Katsuyama et al. Citation2009), with a smaller number representing tropical regions (Elsenbeer et al. Citation1995, Hooper Citation2003, Chaves et al. Citation2008). Only a few studies have applied EMMA in arid or semi-arid regions (Liu et al. Citation2008a, Barthold et al. Citation2010).
The streamflow is usually composed of ice-snowmelt, local precipitation and groundwater in cold regions (Moser and Stichler Citation1980). However, the groundwater comes from ice-snowmelt and local precipitation and discharges to the river mainly from a spring. The contribution of groundwater directly gaining the streamflow in an alpine glacial area is always neglected. Two-component EMMA was also applied in cold regions in China. Studies showed ice-snow meltwater was a significant contributor in the upriver and middle reaches of the Heihe River, northwestern China (Zhang et al. Citation2009), while the contribution of meltwater varied from 63.8% to 92.6% during the wet season in the Heishui Valley (Liu et al. Citation2008b), suggesting that snow and glacier meltwater was the main supplying water source of baseflow. It has been shown that water from snow and glacier meltwater accounted for about 74.6–82.4% of the total streamwater in summer in the trunk stream of Hailuogou valley, Gongga Mountain, another typical monsoonal temperate glacier region in China (Yin et al. Citation2008). According to a monthly hydrograph, Pu et al. (Citation2012) found the contribution of snow and glacier meltwater varied from 40.7% to 62.2% in the wet season in Mt.Yulong region, southwestern China. Usually, local water resources have closer links with monsoonal temperate glaciers because they are more sensitive to climate change, compared with continental glaciers (Li et al. Citation2010).
The Tibetan Plateau and surroundings contain the largest number of glaciers outside the polar regions (Yao et al. Citation2007). This region and its water resources play an important role in global atmospheric circulation, biodiversity, rainfed and irrigated agriculture, and hydropower. These regions where water supply is dominated by melting snow or ice are predicted to suffer severe consequences as a result of recent warming. Results demonstrate that glaciers in the Tibetan Plateau have retreated significantly during the last four decades with total areal reduction amounting to 16.3% or 0.47%/year (Liu et al. Citation2006). The obvious retreat of glaciers happened within the surrounding high mountainous ranges like the north slopes of the Himalaya, Qilianshan and the eastern part of the Plateau with maximum areal decrease up to 46% of their area in the 1960s (Liu et al. Citation2006). Glacial retreat in this region is impacting the hydrological processes and has caused an increase of more than 5.5% in river runoff from the Plateau (Yao et al. Citation2007). The Laohugou River Basin, which is located on the north edge of the Tibetan Plateau, is a typical glacial basin. Therefore, to utilize water resources effectively and predict their change, it is essential to analyse the percentage of ice-snowmelt and other components in runoff to evaluate the contribution of glaciers to local water resources and to quantify interactions between surface and groundwater in a typical glacial basin. Glaciers are of crucial importance for the livelihood of the local populations who depend on meltwater for drinking and irrigation. Previous studies of this area mainly focused on the variation (Du et al. Citation2008), the movement features (Liu et al. Citation2010) and the surface energy budget (Sun et al. Citation2012) of the Laohugou Glacier No. 12. The isotopic and chemical characteristics in streamwater (Hou et al. Citation2012) and a shallow ice core (Cui et al. Citation2011) were also investigated. However, little information was reported on the components and the generation mechanism of streamflow in the area. Thus the roles of glacier and snow meltwater should be significantly noticed in water resource management.
In this study, temporal variations of water stable isotopes oxygen and solutes, the identification of water sources and uncertainty analysis of hydrograph separation were conducted on a small glacial catchment of 30.2 km2. The principal scientific objective of this work was to evaluate isotopic and chemical tracers at natural abundances for their ability to distinguish sources of flow in a meltwater-fed stream. Specific objectives were to:
Characterize seasonal variation in isotopic and chemical composition of a glacier fed stream;
Quantify the contribution of glacial and snow meltwater, precipitation and groundwater (especially the ice-snowmelt water) to stream discharge using EMMA;
Investigate the applicability of EMMA in alpine glacial catchments; and
Provide an insight for water resource formation and management in the area.
2 Study area
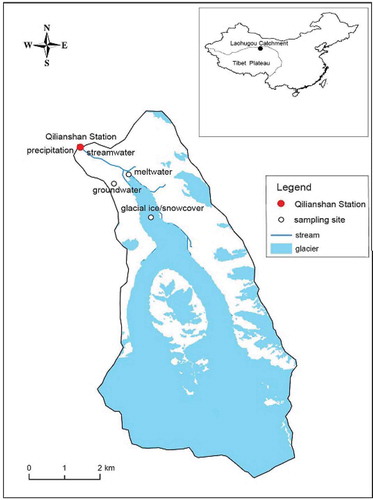
The Laohugou River Basin (96°10' – 97°0'E – 39°10' – 40°0'N) is located at the northern edge of the Tibetan Plateau, northwestern China (). Glacier No. 12 (39°26.4'N – 96°32.5'E), which is a valley glacier 10.1 km in length and 21.9 km2 in area, is the largest glacier in this area. It consists of two tributaries and the altitude ranges from 4260 to 5481 m a.s.l. (Liu et al. Citation2010). Our study was carried out at the upper stretch of the Hydrological Gauging Station in Glacier No. 12 which drains 30.2 km2 of the area () and will hereafter be referred to as the Laohugou Glacial Catchment (LGC). Qilianshan Station, located 2 kilometres below the terminus of Glacier No. 12 (4180 m a.s.1.) of Laohugou Valley, was set up in 2007.
Figure 1. Sketch map showing the location of Laohugou Glacial Catchment and sampling sites (in the figure, the sampling sites of precipitation and streamwater, as well as the Hydrological Gauging Section, are overlapped with the Qilianshan Station).
The LGC is characterized by the typical continental climate under the influence of year-round westerlies. According to the observation data during 1959–1962 and 2009–2011, the average annual temperature is −6.6°C at Qilianshan Station. Daily mean temperature in summer is above 0°C. The precipitation is 160–450 mm/year with a mean of 298.6 mm. Precipitation occurs mainly from May to September.
The catchment mainly belongs to the Precambrian Qilian Mountain fold belt. The lithology mainly includes Sinian limestone, phyllite, slate and mafic volcanic rocks. In the firn basin and near the glacier tongue areas, the schist and gneiss, as well as small-scale acid intrusive rock are PreSinian in age. To be noted, the presence of thin coal-bearing Silurian strata in this area is the main source of sulphate. The groundwater in this area is mainly from lateral infiltration from loose slope sediments in the mountainous areas which are not covered by glaciers.
3 Material and methods
3.1 Field sampling
An intensive monitoring period was carried out between May and September 2009. In total, 132 samples were collected during this period.
A precipitation sampling project was carried out at the Qilianshan Station (). Precipitation samples were collected immediately after each precipitation event in order to minimize the alteration of concentration of heavy isotopes by evaporation with plastic funnel/bottle sets. Usually the precipitation form was snow in this area. Snow samples were collected into a plastic bag and taken into a warmer place to be melted naturally. After wholly melted, water samples were transferred into the sampling bottles. In total, 35 precipitation samples were collected.
Glacial ice/snowcover samples were collected weekly at 4350 m a.s.1 (). The surface 5 cm glacial ice/snowcover was gathered into a plastic bag and taken into a warmer place to be melted naturally. It was then transferred into the sampling bottles: 18 samples were got.
Napshot sampling (Grayson et al. Citation1997) was used to collect grab water samples. Meltwater, totalling 19 samples, was sampled weekly at the terminus of Glacier No. 12. The groundwater was taken biweekly from the spring nearby the terminus of Glacier No. 12 ().
The streamwater was sampled at the Hydrological Gauging Station (). During the low flow period in May, June and September, streamwater was sampled weekly. In July and August, streamwater was sampled at a much higher frequency. In total, 53 streamwater samples were collected.
3.2 The meteorological and discharge data collection
The meteorological parameters were measured continuously by means of an automatic weather station (AWS) installed at Qilianshan Station. A Geonor T-200B gauge was used to measure precipitation.
Discharge was measured at the Hydrological Gauging Section using a level logger HOBO (Onset, USA) and a current meter (Chongqing Hydrological Instruments Company, China). Rating curves determined by 52 pairs of data of discharge and water level were then applied to derive discharge time series on a daily basis.
3.3 Sample analysis
All samples were kept in near-frozen conditions and transported to the State Key Laboratory of Cryospheric Science, Chinese Academy of Sciences for testing.
The D and 18O composition of all water samples were analysed by Liquid-Water Isotope Analyzer (DLT 100, Los Gatos, USA) based on off-axis integrated cavity output spectroscopy (OA-ICOS). The isotopic ratios were expressed in per mil (‰) units relative to Vienna Standard Mean Ocean Water (V-SMOW). Accuracy of δD and δ18O were ± 0.6 ‰ and ± 0.2 ‰, respectively.
Concentration of anions (Cl-, SO42-) was analysed by Ion Chromatogragh (IC, DX-120, Dionex, Germany) while HCO3- and CO32- by the titration method. Cations, K+, Na+, Ca2+ and Mg2+ were analysed by using Atomic Absorption Spectroscopy (AAS) method. Measurement errors, expressed as RSD, were less than 1%. The detection limits of all ions were lower than 0.1 mg/L.
3.4 Data analysis
We conducted EMMA following the procedures suggested by Christophersen and Hooper (Citation1992), Liu et al. (Citation2004), and Barthold et al. (Citation2010). These include (1) the determination of conservative tracers, (2) performance of principal component analysis (PCA) and eigenvector analysis to determine the dimensionality of the hydrologic system and to identify the end members, and finally, (3) the calculation of each end member’s contribution to streamflow.
From the suite of 8 possible tracers including cations, anions and 18O, those tracers that exhibit conservative behaviour were selected and used for further analysis. The determination of conservative tracers was based on the chemical characteristics of the solutes. The four conservative tracers are Na+, Cl-, SO42- and 18O. Outliers were identified as those points that are >1.5 times away from the interquartile range and were removed prior to analysis. Potential end members were identified by screening their elemental concentrations for significant differences to the streamwater. The 95% CI was used as a measure of uncertainty in this analysis.
PCA is a commonly applied technique that is used to explore and describe the variability of a multivariate dataset. The dimensionality of U space is determined by the number of eigenvectors, or principal components (PCs), that are retained from the PCA. The rule of one (Joreskog et al. Citation1976) was applied to determine the number of PCs to retain. The number of PCs plus one is then the number of end members that are needed to describe the system. With the rule of one, the last PC retained in the dataset needs to explain 1/nth of the variance where n is the number of solutes used as tracers. The medians of all possible end members were projected into the U space of the streamwater. Those end members that best bounded the streamwater were identified. The following set of equations (Christophersen et al. Citation1990, Barthold et al. Citation2010) was solved to calculate the contributions of each end member to streamflow for a three end member system:
where f1, f2 and f3 are the fractions of each end member, SWU1 and SWU2 are the projected streamwater observation in U space coordinates and EMnU1 and EMnU2 are the coefficients of the U space projected nth end member.
4 Results
4.1 Hydrological characteristics
The region is characterized by a distinct seasonal continental climate. The monthly mean temperature, increasing from January to August and then decreasing, holds its maximum value (4.8°C) in August and the minimum value (−16.0°C) in January in 2009. There were 116 days in which the daily mean temperature was above 0°C from the beginning of May to the end of September with the maximum value (8.0°C) on 24 July (). As seen in , the annual precipitation was 331.9 mm in 2009 (), of which about 84% took place in the hot season (from May to September), indicating uneven distribution of precipitation in a year.
Figure 2. The precipitation, air temperature and discharge in Laohugou Glacial Catchment in 2009.
4.1.1 The variation of discharge
The hydrograph at LGC is characteristic of melt dominated watersheds. Its discharge clearly varied over the year (). The runoff process can be divided into three parts: (1) Due to the low while increasing average temperature, the discharge of streamwater which was recharged by slowly melted snow showed a relatively steady increase during April 15 to June 11; (2) Due to the continuous, relatively higher temperature and heavier precipitation, the stream discharge mainly from melting glacier as well as the precipitation was under a higher level from June 12 to July 25. The discharge reached its peak at the end of June. Very low discharge values appeared during the July 10 to July 15 due to continuous precipitation days and lower temperatures from July 9 to July 15; (3) The gradually decreased air temperature led to relatively steady decreasing discharge from July 26 to October 30.
Figure 3. Time series of discharge and solute concentrations of streamwater from LGC in 2009.
4.1.2 The relationship between discharge and precipitation/temperature
The observation results in the Qilian Mountains showed that the impact of precipitation on the discharge was mainly from June to September while the temperature had different impact levels on discharge throughout almost the whole year (Song et al. Citation2010). By regression analysis, the daily relationships between discharge and precipitation/temperature were expressed as equations (4)–(6):
where Q is the daily discharge, P is daily precipitation when the precipitation occurs, T is mean daily air temperature and Tdmax is maximum daily air temperature.
The 10-day relationships between discharge and precipitation/temperature are shown in equations (7)–(9):
where Q is the 10-day mean discharge, P is 10-day mean precipitation, T is 10-day mean air temperature and Tdmax is maximum 10-day air temperature.
By comparing the relations between discharge and precipitation/temperature, the discharge had a better correlation with daily mean temperature than with precipitation. It indicated that the meltwater was the main source of the discharge. In terms of time scale, the discharge had a better correlation with precipitation/temperature at the 10-day time scale than at the daily scale. This can be explained by changes of discharge lagging the change in precipitation/temperature. At high altitudes, precipitation was mostly solid. The melting process of snow and glacier ice and the confluence of meltwater led to the lag.
4.2 Solute contents
shows the mean contents of the major ions for precipitation (usually as snow), glacial ice/snowcover, spring, meltwater and streamwater. Solute concentrations in precipitation and glacial ice/snowcover were generally much lower than other types of water. Concentrations in streamwater varied widely, indicating the complicated sources. also shows high concentrations of Ca2+ relative to other cations for all samples. Mg2+ is typically the next most abundant cation, and concentrations of Mg2+ are lowest relative to Ca2+ in glacial ice while nearly equal in other types of water. Concentrations of HCO3- are high relative to other anions, except in spring water where SO42- is the dominate anion. SO42- in the groundwater is inferred to be mainly from the water–rock interaction with coal-bearing strata. Changes of solute concentrations over time in streamwater are shown in . Concentrations were generally higher during the initial sampling period. With the rapid increase in discharge on May 8, solute concentrations began to decrease. Annual minimum concentrations of all solutes occurred just after maximum discharge near June 25. Solute concentrations began to increase on the recession limb of the hydrograph.
Table 1. Summary statistics of the major ions from sampling sites (mean values are presented followed by the standard deviation; the unit is mg/L).
4.3 Characteristics of water stable isotopes
4.3.1 Isotopes in precipitation
During the monitoring period, values of δ18O and δD in all precipitation events collected for this study varied from −6.8‰ (01-07-2009) to –21.2 ‰ (11-09-2009) and from −32.7 (2009–07-01) to −155‰ (2009–09-11), respectively. These values were at the range (δ18O: +10~-50‰; δD: +50~-350‰) of the global stable isotopes composition of precipitation (Araguas et al. Citation2000). The precipitation weighted mean of δ18O and δD were −12.3‰ and −79‰ during May to September. The δ18O and δD of precipitation was depleted in colder months and relatively enriched in warmer months ().
Table 2. Monthly weighted mean of stable isotopes in precipitation in LGC.
4.3.2 Isotopes in glacial ice/snow cover
Melting of glacial ice/snow cover is the main source of meltwater in this area. Based on the analyses on the samples of glacial ice/snowcover at 4350 m a.s.l. of Glacier No. 12, the δ18O/δD in glacial ice/snowcover showed an increasing trend from −18.4‰/−145‰ at the beginning of the sampling period and reached the maximum value (−13.7‰/−106‰) at the end of July, a difference of 4.7‰/39‰. After that, the δ18O decreased gradually with time (). The mean δ18O in glacial ice was −16.5‰/−123‰.
Figure 4. The seasonal variation of δ18O in glacial ice, meltwater and streamwater.
4.3.3 Isotopes in groundwater
As for groundwater, the δ18O/δD values of spring water showed little seasonal variability ranging from −11.2 ‰/−87‰ to −10.2‰/−78‰ with an average of −10.4 ‰/−82‰. The isotopic composition of the groundwater was much more enriched than that of the precipitation. Evaporation occurred during the process of melting and infiltration into the subsurface played an important role. The small seasonal variation indicated that the isotopic compositions of groundwater had insignificant correlation with the meltwater and ambient precipitation. That means the process of precipitation and meltwater infiltrating into the subsurface resulted in a smoothing of the seasonal isotopic composition.
4.3.4 Isotopes in meltwater and streamwater
It can be seen that the δ18O in meltwater at the terminus of Glacier No. 12 increases with time but fluctuates during the sampling period (). The δ18O/δD of meltwater ranged from −14.9‰/−116‰ to −11.4‰/−88‰. Over the course of melt, the δ18O/δD value increased by almost 3.5‰/28‰. The arithmetic mean (−13.3%/−104‰) of the measured δ18O/δD value in meltwater was larger than the values of −16.4 ‰/−123‰ measured in the glacial ice/snowcover.
The change trend of δ18O/δD in streamwater at the Hydrological Gauging Station was similar to that in meltwater at the terminus of Glacier No. 12, illustrating that both variations have the same synoptic and climatic background. The overall δ18O/δD composition of the streamwaters ranged between −14.5‰ /−112‰ and −11.3‰/−87‰, a difference of 3.2‰/−25‰, with average of −12.8 ‰/−99‰ which was much nearer to the value of meltwater. The δ18O peaks appeared in July and September while the lowest values were in June. Moreover, the δ18O//δD values in meltwater at the terminus are all smaller than those in streamwater, displaying the different runoff recharges. For the former, the runoff is primarily originated from seasonal snowpack and glacier meltwater in Glacier No. 12, while for the latter, the recharge is not only from the meltwater runoff in Glacier No. 12 but also from other water sources, especially the higher-valued groundwater and precipitation.
4.3.5 Comparison of isotopes in different waters
For the variation of δ18O, δD was similar. Take δ18O as an example. The multi-compare results of δ18O values showed that significant difference existed among precipitation, glacial ice/snow cover, groundwater, meltwater and streamwater. The most significant seasonal variation was observed in precipitation while the least was in spring water. The values of δ18O in precipitation during May to September had great variation and were generally higher compared with the values in glacial ice/snow cover. This resulted from the fact that the glacial ice/snow cover usually formed or accumulated in places above the equilibrium line where the temperature is much lower. Considering the temperature effect and altitudinal effect, the δ18O of precipitation is lower than that of the precipitation at lower altitude. It is obvious that the signatures of different water components were distinct, indicating that the oxygen isotopes of different components were good enough to use in the tracer model.
4.4 Hydrograph separation
Three-component hydrograph separations were conducted using EMMA. Conservative tracers were evaluated using the mixing diagrams of Christophersen et al. (Citation1990) and Hooper et al. (Citation1990). Tracer compositions of streamflow samples were plotted along with the median and quartiles of potential end-members. Tracers were considered acceptable if streamflow samples were bound by potential end-members. A total of 21 mixing diagrams were evaluated including all potential combinations of paired tracers for Ca2+, Mg2+, Na+, K+, HCO3-, Cl-, SO42- and δ18O. Four tracers, SO42-, Cl-, Na+ and δ18O, were found acceptable. The correlation matrix of discharge, chemical components and isotopes is shown in . The three tracers, Cl-, Na+ and 18O, which had the best relation with the discharge were used to separate the hydrograph at the catchment.
Table 3. The correlation matrix of discharge, chemical components and isotopes.
A principal component analysis (PCA) was performed using the correlation matrix of streamflow data to extract eigenvalues and eigenvectors. The first two PCA components explain 93% of the total variance of the streamflow data at the catchment. On the basis of the work by Christophersen and Hooper (Citation1992), three end-members appear to be sufficient to explain the total variance of solute and isotopic content of streamflow using EMMA.
The streamflow data were standardized and projected onto U space defined by the eigenvector, along with all end-members (). Most of the streamwater observations fall into the triangle that is spanned by three end members, i.e. glacial ice/snow cover, precipitation and groundwater. However, there exist some streamwater observations that lie outside of the triangle.
Figure 5. Streamwater observations and medians of end members projected into U space of the streamwater.
The proposed three-component hydrograph separation demonstrates the contribution of meltwater, precipitation and groundwater and is presented in and . The monthly ratio of each component is calculated using the weighted mean of precipitation and the monthly mean of meltwater, groundwater and streamwater. At the Laohugou Glacial Catchment, streamflow was composed of, on average, 69.9% meltwater, 17.3% precipitation and 12.8% groundwater (). According to the monthly hydrograph, the seasonal variation of the runoff component contribution was marked. The monthly contribution of glacial and snow meltwater varied from 57.4% in September to 79.1% in May, and that of precipitation varied from 0 % in May to 34.6% in September. Influenced by both the temperature and precipitation, the proportion of meltwater and precipitation showed no obvious trend during the runoff season.
Table 4. The composition of streamwater at the Laohugou Glacial Catchment.
Figure 6. Results of three-component mixing models for source waters of streamwater.
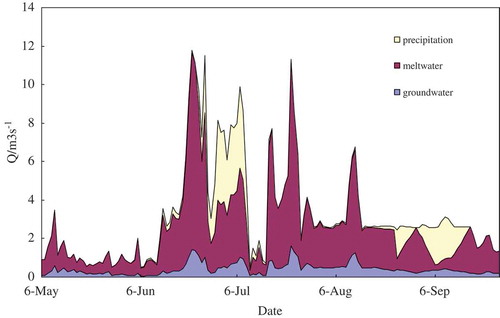
The meltwater contribution was greater on the first part of the hydrograph (May 6 to June 11) with a relatively constant proportion near 80% (). During this period, the daily mean temperature was usually under 0°C. The precipitation, usually called new snow, cannot melt directly and enter into the runoff system within 3 days. On the other hand, the strong wind blew away most of the new snow at the surface of the glacier. This made precipitation have nearly no contribution to the streamwater. On June 10, heavy snow (8.1 mm) occurred. Accompanied with the sharp rising of temperature in the next 9 days, the discharge increased sharply. The precipitation, i.e. the new snow, melted and shared nearly 10% of the discharge. From June 20 to June 28, the daily mean temperature was near 5°C and the melting of a large quantity of glacial ice led to the discharge peak. From June 29 to July 13, the total precipitation was 88.1 mm including 3 lots of heavy rainfall (15.8 mm, June 29; 10.4 mm, July 5; 22.6 mm, July 7). The fraction that is contributed by precipitation increased and reached 40% on average while the fraction of meltwater was 50% on average. The temperature maintained its highest level from July 16 to August 24 and led to the strongest melting of glacial ice. The melting water shared 84% of the streamwater while the groundwater shared 14%. With the decrease in temperature and increase of precipitation from August 25 to September 16, the fraction of precipitation contributing to streamwater increased to 40% while that of meltwater decreased to 47%. From September 17 to September 26, nearly no precipitation occurred during this period. The contribution of precipitation to the streamwater was near 0%. The streamwater was formed by ice meltwater (88%) and groundwater (12%).
5 Discussion
5.1 Uncertainty analysis of hydrograph separation
The recent focus of hydrograph separation has been on uncertainty analysis (e.g. Blume et al. Citation2008, Chaves et al. Citation2008, Barthold et al. Citation2010, Pu et al. Citation2012, Klaus and McDonnell Citation2013). As shown in , there existed some streamwater observations that lay outside of the triangle. This can lead to over- or under-prediction of the contributions of each end member to the streamwater, and should be understood as a source of uncertainty. These types of outliers are typical in EMMA models (Christophersen and Hooper Citation1992, Elsenbeer et al. Citation1995, Chaves et al. Citation2008, Liu et al. Citation2008a, Barthold et al. Citation2010). Barthold et al. (Citation2010) concluded that it resulted from a number of factors including: (1) uncertainty in field sampling or laboratory analyses, (2) lack of temporal invariance of end members or (3) the expression of different end members in the mixture as water source areas change temporally.
Alpine glaciers are complex water storage compartments that to some degree behave isotopically and chemically like a well mixed lake (Moser and Stichler Citation1980). Because the current year’s snowmelt and summer precipitation can be trapped within the glacier in fissures to be frozen during winter, the melting of the glacier can release water that has been added from recent inputs together with water stored for decades to centuries (Cable et al. Citation2008). Therefore, it is difficult to predict how the isotopic and chemical composition of glacier meltwater will differ from the current year’s snowmelt or rainfall. However, if one assumes that the glacier mass is an integrator, then meltwater from the glacier may be attenuated isotopically and chemically relative to seasonal and interannual variations in meteoric waters. For that reason alone, glacier meltwater can be distinguished isotopically and chemically from the current year’s meteoric inputs. The stable isotopic compositions of waters can be affected by evaporation, sublimation, re-melting and exchange with atmospheric vapour. The offset due to these fractionation processes can also be a source of uncertainty because these processes are likely to play a role in glacier melt and accumulation.
Another shortcoming of this study is that the identification of end members is limited to data collected during the runoff period which comprises only 5 months of the year. Even if this is the period with most of the precipitation, we may miss some important components of the system.
Several approaches are available for calculating uncertainty, e.g. Bayesian statistical method (Soulsby et al. Citation2003), Monte Carlo procedure (Joerin et al. Citation2002) and Gaussian error propagation technique (Genereux Citation1998). A classical Gaussian error propagation technique is generally applied to quantify the uncertainty of tracer-based hydrograph separations (e.g. Hooper et al. Citation1990, Uhlenbrook and Hoeg Citation2003). The uncertainty analysis for hydrograph separation models can be estimated using a first-order Taylor series expansion (Hooper et al. Citation1990, Genereux Citation1998):
where w represents the uncertainty in the variable specified in the subscript, y is a function of several variables c1, c2, …cn (i.e. z = f (c1, c2, …cn)). Partial derivatives of each mixing fraction with respect to each of the eight tracer concentrations along with the uncertainty in each tracer concentration would be used as shown in (10) to compute the uncertainty in the mixing fractions, f1, f2 and f3.
As for the separation of this study, the temporal variations of 18O and chemical composition were observed for precipitation, glacial ice/snowcover, groundwater and streamwater. However, each type of water was sampled only in one site. Thus the general spatial heterogeneity of tracer concentrations should be considered estimating w values for the components. The standard deviations of the tracer concentrations were multiplied by appropriate t values from the Student’s t distribution to estimate uncertainty from the variation of tracer concentrations at the level of 95% confidence so that the resultant uncertainty was referred to as a = 0.05 (Genereux Citation1998).
The estimated uncertainties are shown in . It can be seen that the uncertainties in mixing fractions were much smaller to the value of the mixing fractions, indicating the hydrograph separation for the streamwater in this catchment was believable. The hydrograph separation analysis showed successfully that glacier and snowcover meltwater of the streamflow occupied more than 70% of stream flow, whereas precipitation and groundwater averagely shared the rest between them.
It is important to note that the three-component separations were developed for the situation at the particular study site during the runoff period. The assumption that three major source areas have distinct tracer compositions is based on the geomorphological and geological situation.
5.2 Water balance in glacierized catchment
We discussed the contribution of meltwater, precipitation and groundwater to the streamflow above. As shows, the total runoff depth in this glacierized catchment during the runoff season was 1323.1 mm while the three components, namely precipitation, meltwater and groundwater, were 229.0 mm, 925.1 mm and 169.0 mm, respectively.
Table 5. Seasonal balance patterns of precipitation and runoff in LHG catchment.
Runoff was much greater than precipitation in the heavily glacierized catchments. This is because reduction of the mass of glacier ice and snowcover in a catchment will increase the annual river flow. This extra component of river flow has been called the “deglaciation discharge dividend” (Collins Citation2008). The runoff coefficient showed seasonal variation with a mean value of 4.5. The precipitation which fell as snow in winter provided a larger amount of meltwater than the precipitation could in May and led to a high runoff coefficient in May. With the sharp increasing of air temperature in June, melting of snowcover and ice were aggravated. Though the precipitation increased, the runoff coefficient still increased sharply. The sharply increased precipitation resulted in the increased recharge proportion of precipitation to the runoff and decreased runoff coefficient in July. With the sharply decreased precipitation, the runoff coefficient reached its maximum in August. In September, the reduced meltwater which resulted from the decrease of air temperature and the increased precipitation worked together and led to a minimum runoff coefficient.
Most (78%) of the precipitation contributed to the runoff in the runoff season (). Some precipitation was consumed as evaporation or accumulated in the accumulation zone or infiltrated as groundwater. In fact, the groundwater in LGC was mainly fissure water which directly came from precipitation or melting of snowcover. The groundwater had a relatively short path and residence time. So, on an annual or larger time scale, the water that comes from a glacierized catchment is the sum of the precipitation and the melted snow and ice (minus some evaporation and some precipitation accumulated above the equilibrium line).
6 Conclusions
Variations of the stable isotopes and solutes in different water mediums in LGC are analysed to provide the basic isotopic and chemical data for the application of tracers in hydrological investigations.
Geochemical and isotopic tracers and the application of EMMA proved to be useful tools in the process of identifying runoff generating sources at the catchment scale in an alpine catchment. Despite sparse data, findings suggest that meltwater from glacial ice and snowcover are the primary sources of streamwater. That is to say, snow and glacier meltwater was vital to streamflow and should be significantly noted in water resource management and prediction in the glacial region at the northern rim of the Tibetan Plateau under global warming conditions. It is noted that groundwater occupied nearly 14% of the sreamwater. In glacierized catchments, runoff was much greater than precipitation and the variation of runoff coefficient was controlled by the amount of meltwater and precipitation during the runoff season. Most of the precipitation recharged the runoff in the runoff season while accumulation occurred in winter time.
Acknowledgements
We also thank the staff of the Qilianshan Glacier Station for supply of meteorological data and logistical, technical and administrative support.
Disclosure statement
No potential conflict of interest was reported by the authors.
Additional information
Funding
References
- Araguas, L., Froehlich, K., and Rozanski, K., 2000. Deuterium and oxygen-18 isotope composition of precipitation and atmospheric moisture. Hydrological Processes, 14 (8), 1341–1355. doi:10.1002/1099-1085(20000615)
- Barnett, T.P., Adam, J.C., and Lettenmaier, D.P., 2005. Potential impacts of a warming climate on water availability in snow-dominated regions. Nature, 438, 303–309. doi:10.1038/nature04141
- Barthold, F.K., et al., 2010. Identification of geographic runoff sources in a data sparse region: hydrological processes and the limitations of tracer-based approaches. Hydrological Processes, 24, 2313–2327. doi:10.1002/hyp.v24:16
- Blume, T., Zehe, E., and Bronstert, A., 2008. Investigation of runoff generation in a pristine, poorly gauged catchment in the Chilean Andes II: Qualitative and quantitative use of tracers at three spatial scales. Hydrological Processes, 22, 3676–3688. doi:10.1002/hyp.v22:18
- Bradley, R.S., 2006. Threats to water supplies in the Tropical Andes. Science, 312, 1755–1756. doi:10.1126/science.1128087
- Buttle, J.M., 1994. Isotope hydrograph separations and rapid delivery of pre-event water from drainage basins. Progress in Physical Geography, 18, 16–41. doi:10.1177/030913339401800102
- Cable, J.M., et al., 2008. The contribution of glacier meltwater to stream flow in the Wind River Range, WY. Eos Transactions AGU, 89 (53), Fall Meet. Suppl., C23A–0597.
- Casassa, G., et al., 2009. Detection of changes in glacial run-off in alpine basins: examples from North America, the Alps, central Asia and the Andes. Hydrological Processes, 23, 31–41. doi:10.1002/hyp.7194
- Chaves, J., et al., 2008. Land management impacts on runoff sources in small Amazon watersheds. Hydrological Processes, 22, 1766–1775. doi:10.1002/(ISSN)1099-1085
- Christophersen, N. and Hooper, R.P., 1992. Multivariate analysis of stream water chemical data: the use of principal components analysis for the end-member mixing problem. Water Resources Research, 28 (1), 99–107. doi:10.1029/91WR02518
- Christophersen, N., et al., 1990. modelling streamwater chemistry as a mixture of soilwater end-members — a step towards second-generation acidification models. Journal of Hydrology, 116, 307–320. doi:10.1016/0022-1694(90)90130-P
- Collins, D.N., 2008. Climatic warming, glacier recession and runoff from Alpine basins after the Little Ice Age maximum. Annals of Glaciology, 48, 119–124. doi:10.3189/172756408784700761
- Cui, X., Ren, J., and Qin, X., 2011. Climatic and enviromental records within a shallow ice core at the Laohugou Glacier No. 12, Qilian Mountains. Journal of Glaciology and Geocryology, 33 (6), 1251–1258 (in Chinese with English abstract).
- Dansgaard, W., 1964. Stable isotopes in precipitation. Tellus, 16 (4), 436–468. doi:10.1111/tus.1964.16.issue-4
- Dinçer, T., et al., 1970. Snowmelt runoff from measurements of Tritium and Oxygen-18. Water Resources Research, 6, 110–124. doi:10.1029/WR006i001p00110
- Ding, Y., et al., 2006. The retreat of glaciers in response to recent climate warming in western China. Annals of Glaciology, 43 (1), 97–105. doi:10.3189/172756406781812005
- Du, W., et al., 2008. Variation of the Laohugou Glacier No. 12 in the Qilian Mountains. Journal of Glaciology and Geocryology, 30 (3), 373–379 (in Chinese with English abstract).
- Dyurgerov, M.B. and Carter, C.L., 2004. Observational evidence of increases in fresh water inflow to the Arctic Ocean. Arctic, Antarctic, and Alpine Research, 36 (1), 117–122. doi:10.1657/1523-0430(2004)036[0117:OEOIIF]2.0.CO;2
- Elsenbeer, H., Lorieri, D., and Bonell, M., 1995. Mixing model approaches to estimate storm flow sources in an overland flow-dominated tropical rain forest catchment. Water Resources Research, 31, 2267–2278. doi:10.1029/95WR01651
- Gao, M., et al., 2013. Characteristics of melt water discharge in the Glacier No. 1 basin, headwater of Urumqi River. Journal of Hydrology, 489, 180–188. doi:10.1016/j.jhydrol.2013.03.013
- Genereux, D.P., 1998. Quantifying uncertainty in tracer-based hydrograph separations. Water Resources Research, 34 (4), 915–919. doi:10.1029/98WR00010
- Grayson, R.B., et al., 1997. Catchment-wide impacts on water quality: the use of ‘snapshot’ sampling during stable flow. Journal of Hydrology, 199, 121–134. doi:10.1016/S0022-1694(96)03275-1
- Hock, R., Jansson, P., and Braun, L., 2005. Modelling the response of mountain glacier discharge to climate warming. In: U.M. Huber, M.A. Reasoner, and H. Bugmann, eds. Global change and mountain regions—a state of knowlegde overview. Springer: Dordrecht, 243–252.
- Hooper, R.P., 2003. Diagnostic tools for mixing models of stream water chemistry. Water Resources Research, 39, 13.
- Hooper, R.P., Christophersen, N., and Peters, N.E., 1990. Modelling streamwater chemistry as a mixture of soilwater end-members—an application to the Panola Mountain catchment, Georgia, USA. Journal of Hydrology, 116, 321–343. doi:10.1016/0022-1694(90)90131-G
- Hooper, R.P. and Shoemaker, C.A., 1986. A comparison of chemical and isotopic hydrograph separation. Water Resources Research, 22, 1444–1454. doi:10.1029/WR022i010p01444
- Hou, D., et al., 2012. Isotopic,chemical characteristics and transforming relationship between surfacewater and groundwater in Xiaochangma river basin. Journal of Glaciology and Geocryology, 34 (3), 698–705 (in Chinese with English abstract).
- Immerzeel, W.W., Van Beek, L.P., and Bierkens, M.F., 2010. Climate change will affect the Asian water towers. Science, 328, 1382–1385. doi:10.1126/science.1183188
- Joerin, C., et al., 2002. Uncertainty in hydrograph separations based on geochemical mixing models. Journal of Hydrology, 255, 90–106. doi:10.1016/S0022-1694(01)00509-1
- Joreskog, K.G., Klovan, J.E., and Reyment, R.A., 1976. Geological factor analysis. Methods in Geomathematics. Amsteram: Elsevier.
- Joussaume, S., Sadourny, R., and Jouzel, J., 1984. A general circulation model of water isotope cycles in the atmosphere. Nature, 311, 24–29. doi:10.1038/311024a0
- Katsuyama, M., Kabeya, N., and Ohte, N., 2009. Elucidation of the relationship between geographic and time sources of stream water using a tracer approach in a headwater catchment. Water Resources Research, 45, 13.
- Klaus, J. and McDonnell, J.J., 2013. Hydrograph separation using stable isotopes: Review and evaluation. Journal of Hydrology, 505, 47–64. doi:10.1016/j.jhydrol.2013.09.006
- Kundzewicz, Z.W., et al., 2007. Freshwater resources and their management. In: M.L. Parry, et al., eds. Climate change 2007: impacts, adaptation and vulnerability. contribution of working group II to the fourth assessment report of the intergovernmental panel on climate change. Cambridge, UK: Cambridge University Press, 173–210.
- Li, Z., et al., 2010. Changes of climate, glaciers and runoff in China monsoonal temperate glacier region during the last several decades. Quaternary International, 218 (1–2), 13–28. doi:10.1016/j.quaint.2009.05.010
- Liu, F., et al., 2008a. Seasonal and interannual variation of streamflow pathways and biogeochemical implications in semi-arid, forested catchments in Valles Caldera, New Mexico. Ecohydrology, 1, 239–252. doi:10.1002/eco.v1:3
- Liu, F., Williams, M.W., and Caine, N., 2004. Source waters and flow paths in an alpine catchment, Colorado front range, United States. Water Resource Research, 40, W09401. doi:10.1029/2004WR003076
- Liu, S., et al., 2006. Glaciers in response to recent climate warming in Western China. Quat Sciences, 26 (5), 762–771.
- Liu, Y., et al., 2008b. Characteristics of water isotopes and hydrograph separation during the wet season in the Heishui River, China. Journal of Hydrology, 353, 314–321. doi:10.1016/j.jhydrol.2008.02.017
- Liu, Y., et al., 2010. Analysis of the movement features of the Laohugou Glacier No. 12 in the Qilian Mountains. Journal of Glaciology and Geocryology, 32 (3), 475–479 (in Chinese with English abstract).
- McDonnell, J.J., et al., 1990. Deuterium variations in storm rainfall: implications for stream hydrograph separations. Water Resources Research, 26 (3), 455–458. doi:10.1029/WR026i003p00455
- Moser, H. and Stichler, W., 1980. Environmental isotopes in ice and snow. In: M. Baskaran, ed. Handbook of environmental isotope geochemistry, Vol. 1. Amsterdam-Oxford-New York: Elsevier Scientific Publishing Company, 141–178.
- Pu, T., et al., 2012. Characteristics of water stable isotopes and hydrograph separation in Baishui catchment during the wet season in Mt. Yulong region, south western China. Hydrological Processes. doi:10.1002/hyp.9479
- Rock, L. and Mayer, B., 2007. Isotope hydrology of the Oldman River basin, southern Alberta, Canada. Hydrological Processes, 21, 3301–3315. doi:10.1002/(ISSN)1099-1085
- Rodhe, A., 1998. Snowmelt-dominated system. In: C. Kendall and J.J. McDonnell, eds. Isotope tracers in catchment hydrology. Amsterdam: Elsevier, 391–433.
- Song, G., Wang, N., and Jiang, X., 2010. Study on glacial melt-water change of Qiyi Glacier in climate warming of Qilian Mountain. Journal of China Hydrology, 30 (2), 84–88.
- Soulsby, C., et al., 2003. Identifying and assessing uncertainty in hydrological pathways: a novel approach to end member mixing in a Scottish agricultural catchment. Journal of Hydrology, 274, 109–128. doi:10.1016/S0022-1694(02)00398-0
- Stewart, I.T., 2009. Changes in snowpack and snowmelt runoff for key mountain regions. Hydrological Processes, 23, 78–94. doi:10.1002/hyp.v23:1
- Sun, W., et al., 2012. The surface energy budget in the accumulation zone of the Laohugou Glacier No. 12 in the Western Qilian Mountains, China, in summer 2009. Arctic, Antarctic, and Alpine Research, 44 (3), 296–305. doi:10.1657/1938-4246-44.3.296
- Uhlenbrook, S. and Hoeg, S., 2003. Quantifying uncertainties in tracer-based hydrograph separations: a case study for two-, three- and five-component hydrograph separations in a mountainous catchment. Hydrological Processes, 17, 431–453. doi:10.1002/(ISSN)1099-1085
- Xiao, C., et al., 2008. Progress on observation of cryospheric components and climate-related studies in China. Advancement in Atmospheric Sciences, 25 (2), 164–180. doi:10.1007/s00376-008-0164-8
- Yao, T., et al., 2007. Recent glacial retreat and its impact on hydrological processes on the Tibetan Plateau, China, and surrounding regions. Arctic, Antarctic, and Alpine Research, 39, 642–650. doi:10.1657/1523-0430(07-510)[YAO]2.0.CO;2
- Yao, T., et al., 2012. Different glacier status with atmospheric circulations in Tibetan Plateau and surroundings. Nature. doi:10.1038/NCLIMATE1580
- Yin, G., et al., 2008. Study of the hydrology of glacial runoff in Hailuogou Valley, Gongga Mountain by means of isotopic tracing. Journal of Glaciology and Geocryology, 30 (3), 365–372 (in Chinese with English abstract).
- Zhang, Y., Song, X., and Wu, Y., 2009. Use of oxygen-18 isotope to quantify flows in the upriver and middle reaches of the Heihe River, Northwestern China. Environmental Geology, 58, 645–653. doi:10.1007/s00254-008-1539-y