
ABSTRACT
Several satellite-based precipitation estimates are becoming available at a global scale, providing new possibilities for water resources modelling, particularly in data-sparse regions and developing countries. This work provides a first validation of five different satellite-based precipitation products (TRMM-3B42 v6 and v7, RFE 2.0, PERSIANN-CDR, CMORPH1.0 version 0.x) in the 1785 km2 Makhazine catchment (Morocco). Precipitation products are first compared against ground observations. Ten raingauges and four different interpolation methods (inverse distance, nearest neighbour, ordinary kriging and residual kriging with altitude) were used to compute a set of interpolated precipitation reference fields. Second, a parsimonious conceptual hydrological model is considered, with a simulation approach based on the random generation of model parameters drawn from existing parameter set libraries, to compare the different precipitation inputs. The results indicate that (1) all four interpolation methods, except the nearest neighbour approach, give similar and valid precipitation estimates at the catchment scale; (2) among the different satellite-based precipitation estimates verified, the TRMM-3B42 v7 product is the closest to observed precipitation, and (3) despite poor performance at the daily time step when used in the hydrological model, TRMM-3B42 v7 estimates are found adequate to reproduce monthly dynamics of discharge in the catchment. The results provide valuable perspectives for water resources modelling of data-scarce catchments with satellite-based rainfall data in this region.
Editor M.C. Acreman; Associate editor N. Verhoest
1 Introduction
The northern part of the Maghreb region is the rainiest area of North Africa, where most of the dams and reservoirs for irrigation and water supply are located. Since the density of climate monitoring networks in this area is low, rainfall derived from satellite-based information could be extremely useful for better management of water resources, particularly in ungauged catchments. In recent years, several satellite-based products for rainfall have become available (Kidd and Levizzani Citation2011), which mitigate the lack of ground measurements. Several validation studies of these products have been conducted in various regions of the world (Hughes Citation2006, Ward et al. Citation2011, Bastola and Delclaux Citation2012, Li et al. Citation2012, Thiemig et al. Citation2012, Gosset et al. Citation2013, Xue et al. Citation2013), demonstrating the potential of this new source of data. Yet only a few studies have considered the use of satellite-based precipitation data in the Mediterranean region (Mehta and Yang Citation2008, Immerzeel et al. Citation2009, Nastos et al. Citation2013). In particular, Ezzine et al. (Citation2014) and Milewski et al. (Citation2015) have shown that TRMM 3B43 v7 was able to reproduce adequately the monthly precipitation patterns in Morocco, but no studies to our knowledge have evaluated this new source of precipitation data for hydrological modelling in North African catchments. It must be noted that rainfall characteristics, in particular the spatial distribution of rainfall and its intensity, are known to have a great influence on hydrological modelling (Andreassian et al. Citation2001) and a large part of the rainfall–runoff modelling errors can be explained by uncertainties in rainfall estimates. Therefore it is crucial to test the sensitivity of hydrological models to different rainfall inputs, in order to assess their sensitivity and robustness prior to their use in ungauged catchments.
A very important point is the validation of interpolation methods for ground observations. The most common approach is to apply a cross-validation (jack-knife) method by removing each station in turn and estimating precipitation at the location of the removed station with the remaining stations using spatial interpolation techniques (Wackernagel Citation1995, Goovaerts Citation2000). However, having only a sparse network, the results are to a large extent dependent on the number and location of raingauges; for instance, there could be a strong bias if most of the stations are located in low elevation areas. For this reason, many authors performed, in addition to the pure statistical validation, a validation using hydrological models, which provides integration of precipitation over space and time through the reproduction of discharge (Gourley and Vieux Citation2005, Pan et al. Citation2010, Stisen and Sandholt Citation2010, Bitew and Gebremichael Citation2011, Heistermann and Kneis Citation2011, Li et al. Citation2012, Wagner et al. Citation2012, Duethmann et al. Citation2013, Gosset et al. Citation2013, Thiemig et al. Citation2013, Xue et al. Citation2013). The type of hydrological models considered for that purpose range from conceptual models (Heistermann and Kneis Citation2011, Gosset et al. Citation2013), through distributed physically-based models (Bitew and Gebremichael Citation2011, Thiemig et al. Citation2013) to complex and highly parameterized land-surface models (Pan et al. Citation2010).
Different model calibration approaches for the hydrological evaluation of precipitation estimates can be applied. The first one relies on model calibration for each rainfall input (Stisen and Sandholt Citation2010, Bitew and Gebremichael Citation2011, Thiemig et al. Citation2013). However, the calibrated model parameters may compensate for the bias in the different precipitation datasets, therefore making the comparison difficult. To circumvent this problem Duethmann et al. (Citation2013) proposed calibrating the precipitation bias together with the model parameters by applying a constant bias to the whole range of precipitation intensities. This, however, may not be representative of the actual bias in the precipitation inputs. Indeed, Thiemig et al. (Citation2013) found that a quantile-based bias correction for satellite-based precipitation was more efficient than monthly bias correction factors. Also, including the precipitation bias in the calibration of the hydrological model parameters may introduce a compensation effect on the other parameters and produce equifinality issues (Beven Citation2006). Therefore, Gourley and Vieux (Citation2005) as well as Heistermann and Kneis (Citation2011) proposed an alternative approach based on Monte-Carlo simulations in order to obtain not a single optimal parameter set but an ensemble of suitable parameter sets for a given precipitation input. With this approach they obtained a distribution of the hydrological goodness-of-fit statistic for each precipitation input. However, Heistermann and Kneis (Citation2011) observed a potential decrease of the discriminant power of this method, either if the precipitation input is free of random errors, or if the parameters of the hydrological model appear in linear equations.
The objective of this study is to evaluate satellite-based rainfall estimates for a test catchment located in Morocco (North Africa) in order to support water resources management activities in this region. Different spatial interpolation techniques are first compared to produce a ground reference that is then compared with the different satellite-based precipitation products. The comparison is based on the seasonal cycle and precipitation amounts at different time steps. The validation is also carried out using a hydrological model, to evaluate the potential of these satellite-based rainfall products for use in hydrological applications such as water resources modelling in this region.
2 Data and methods
2.1 Study area and observed data
The Makhazine dam is the sixth largest dam in Morocco and has a catchment area of 1785 km2. The catchment has already been used as pilot site in previous studies (Tramblay et al. Citation2012, Citation2013), due to the relatively high density of raingauge stations available for this region (10 stations; ). We consider this catchment as representative of the other dam catchments present in this area in terms of water resources management requirements due to similar morphological, hydrological and meteorological characteristics.
Figure 1. Map of the Makhazine catchment (North Morocco, Maghreb region) with the locations of the raingauges (circles).
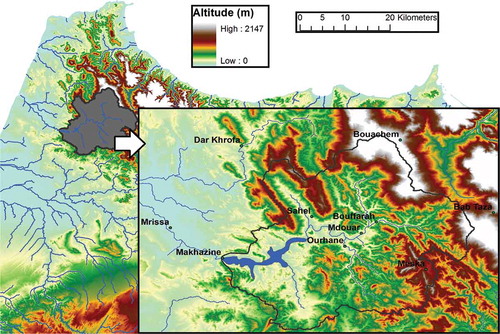
There are 10 precipitation stations () in the catchment area and one gauging station at the dam inlet (Makhazine station) with daily records for the time periods 1980–2011 and 1984–2011. Overall, the missing data remain limited, with less than 5% of missing days in the whole record. However the data end in 2007 for the Meska station and in 2009 for the Nakhla station. In addition, daily temperature is retrieved from NCEP (National Centre for Environmental Prediction) reanalysis and interpolated from inverse distance of the four nearest grid cells; while the potential evapotranspiration (PET) is computed with the Oudin et al. (Citation2005) formula, requiring only air temperature and latitude.
Table 1. List of raingauge stations in the Makhazine catchment.
2.2 Satellite-based rainfall estimates
The selection of satellite-based precipitation products is based on previous studies, in particular from Thiemig et al. (Citation2012), who validated several precipitation products over several catchments located in Africa (Zambezi, Volta, Juba-Shabelle and Baro-Akobo). lists the chosen products and provides a brief description; for further information the reader is referred to the key references as outlined in the table. This study aims primarily at the support of hydrological modelling activities in Morocco to better manage water resources. As such it is not aimed at operational day to day activities, but rather at the decadal, monthly and seasonal scale, for which some delay in the release of SRFE is not important. Note that none of the ground stations located in the Makhazine catchment are part of the GTS or GPCC databases. Hence, both datasets, satellite-based precipitation estimates and ground-station measurements, are entirely independent of each other.
Table 2. Description of the different satellite rainfall products.
2.3 Spatial interpolation of ground-observed precipitation measurements
In order to compare the different satellite-based precipitation estimates, there is first a need for a ground reference. Due to the density of available raingauges and the presence of missing data in the records, the definition of this ground reference can be a crucial and challenging step. Even though the network density is relatively good for North Africa, it is still sparse by comparison with Europe or North America, meaning that the distance between stations can be large. In addition, there are some missing values in the data records, so the available network changes depending on the time step. Therefore, methods such as climatological variograms cannot be employed. Instead, spatial interpolation must be performed at each time step.
To perform the interpolation at the catchment scale, the precipitation station data are first interpolated to a regular grid of points with a 1 km resolution within the catchment and then the precipitation interpolated at these points is averaged. The interpolation of the raingauge data over the catchment is performed using different methods, including deterministic methods such as inverse distance (ID) and nearest neighbour (NN) interpolation as well as geostatistical methods such as ordinary kriging (OK; Wackernagel Citation1995) and residual kriging (RK; Hengl et al. Citation2007, Wagner et al. Citation2012). The variograms required for the OK method are fitted with a spherical variogram model for each time step, when rain is measured for at least four stations, otherwise IDW interpolation is performed. The spherical variogram model is convenient for precipitation, which is not a spatially continuous field like temperature, since it provides a value of the decorrelation distance (Lebel et al. Citation1987). In order to take the influence of elevation into account (Goovaerts Citation2000) the RK method is implemented in addition to OK. It is mathematically equivalent to universal kriging or kriging with external drift methods, but RK allows the separate interpretation of the two interpolated components and use of a broader range of regression techniques. The RK approach combines a regression model between precipitation and altitude with the spatial interpolation of the residuals of the regression. At each time step, for each location i the estimate of precipitation z can be computed as:
where m(i) is the regression model estimate and e(i) the spatially interpolated residual of the regression. An ordinary least square (OLS) regression cannot be used here since the constraint of heteroscedasticity of the residuals would not be fulfilled: the altitude at each point is very likely to exhibit spatial correlation (Hengl et al. Citation2007). Therefore, the regression coefficients here are estimated by generalized least squares (GLS), to avoid the heteroscedasticity constraint of OLS (Hengl et al. Citation2007). For each time step, if the correlation between precipitation, measured in at least four different stations, and altitude is significant and positive at the 90% confidence level, RK interpolation is performed. The residuals of the model are estimated by simple kriging, the variogram for the residuals is estimated for each time step in a similar way as for the OK interpolation method explained above. Otherwise, if the number of stations is too low or if the correlation is not significant, IDW interpolation is performed.
The different interpolation methods tested (ID, NN, OK, RK) are validated by a jack-knife (leave-one-out) resampling method, each raingauge is in turn removed and the daily precipitation estimated with the remaining stations using the different methods. A root mean squared error (RMSE) is computed between the observed and simulated values.
2.4 Hydrological modelling
The GR4J model developed by Perrin et al. (Citation2003) was used to simulate discharge from the Makhazine catchment. The choice of a conceptual model was driven by the availability of data as well as by the consideration that many water resource managers (such as basin agencies in Morocco) rely mostly on this type of model. The model inputs are mean areal rainfall and PET over the catchment. The model uses two stores and two unit hydrographs. The model includes four parameters: X1, the maximum capacity of the production store (mm); X2, the groundwater exchange coefficient (mm); X3, the one-day-ahead maximum capacity of the routing store (mm); and X4, the time base of unit hydrograph UH1 (days). A warm-up period of 365 days is considered for the correct initialization of the initial conditions.
To reduce equifinality issues (Beven Citation2006) and the possible compensation between parameters when the model is driven with different rainfall inputs, a similar method to the GLUE method (Beven and Binley Citation1992, Seibert and Beven Citation2009), which considers ensembles of acceptable parameter sets obtained by Monte Carlo simulations, is considered here. Gourley and Vieux (Citation2005) as well as Heistermann and Kneis (Citation2011) previously used such a framework by randomly sampling the parameter space considering uniform distributions with maximum and minimum values set from the literature. However, random sampling of uniform distributions can be inefficient for exploring high probability density regions of the parameter space, thus requiring a very high number of simulations to reach an acceptable solution (Kuczera and Parent Citation1998).
Here we introduce a variant of the approach, by replacing uniform distributions by empirical cumulative distribution functions of parameter values obtained by calibration over a large set of catchments worldwide. In the present study, a large number of parameter sets (100 000) for the GR4J model are generated using Latin hypercube (LH) sampling (McKay et al. Citation1979). The number of simulations is chosen to ensure the stability of the results in between different LH sampling runs. The main advantage of LH over the Monte Carlo sampling technique is a better random sample stratification, to ensure that all the portions of the parameter space are sampled. Therefore, LH sampling leads to the same results as Monte Carlo sampling but with a smaller number of iterations required to reach the same coverage of the whole parameter space (McKay et al. Citation1979). Here the parameters are drawn randomly from the empirical distributions () of the GR4J model parameters calibrated in over 1000 catchments located in France, USA and Australia by Le Moine et al. (Citation2007) and Perrin et al. (Citation2008). This way, the generated ensemble of random parameters is representative of the real variability observed in the model parameters for different catchments.
Figure 2. Cumulative distribution function of the GR4J parameters (X1, X2, X3, X4; for explanation of model parameters see Section 2.4) from the database of 900 catchments of Perrin et al. (Citation2008).
In order to measure the efficiency of the different generated parameter sets to reproduce the observed discharge, the multi-objective Kling-Gupta efficiency (KGE) criterion introduced by Gupta et al. (Citation2009) and Kling et al. (Citation2012) is applied. As noted by Gupta et al. (Citation2009), if using solely the Nash-Sutcliffe criterion for calibration in basins with high runoff variability, the bias component would have a smaller contribution in the optimization of the Nash-Sutcliffe, possibly leading to model simulations having large volume errors. The KGE combines linear correlation, bias and variability measures between observed (o) and simulated (s) discharge; the higher the KGE value the better the agreement between the simulations and observations:
with:
where r is the Pearson product-moment correlation coefficient, μ is the mean discharge (m3/s), CV is the coefficient of variation and σ is the standard deviation of the discharge. The terms KGE′, r, β and γ are dimensionless and their optimum value is 1. In the present study, the best 100 solutions according to the KGE are selected. The goal here is not to fully quantify the uncertainty stemming from the hydrological model, as in the GLUE method (Beven and Binley Citation1992, Stedinger et al. Citation2008), but rather to evaluate whether taking an ensemble of suitable model parameters would produce different results than choosing the highest KGE value only, in the comparison of the different rainfall inputs.
3 Results
3.1 Validation of spatial interpolation methods for precipitation
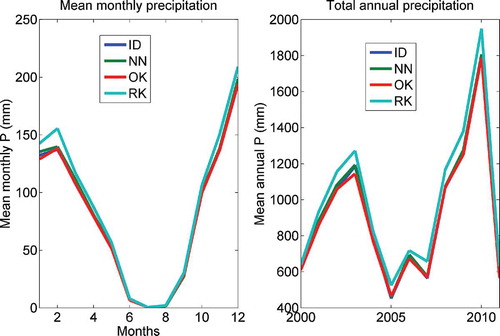
The different interpolated datasets of precipitation (OK, NN, ID, RK) produce very similar values for mean monthly or annual precipitation totals (), except for the RK method, which tends to produce larger amounts. The RK method relies on the daily correlation between precipitation and altitude recorded at each station. Some correlations between daily precipitation and altitude are detected, mainly during the extended winter season (from October to March), with an average correlation coefficient equal to 0.41. However, the number of significant correlations remains small, corresponding to 11% of wet days at the 90% confidence level, and 16% of wet days at the 80% confidence level.
Figure 3. Mean monthly areal precipitation (left) and annual precipitation totals for the catchment, computed from the different interpolated datasets of precipitation.
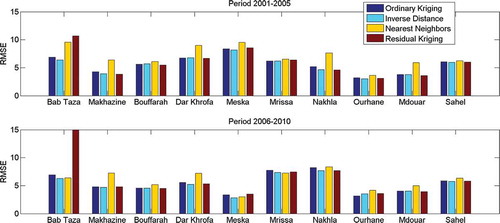
The different methods considered for the spatial interpolation (ID, NN, OK, RK) are compared using a jack-knife resampling method. The jack-knife validation results in terms of RMSE are shown on for two time periods, 2001–2005 and 2006–2010. The summer months of June, July and August are excluded since they are almost completely dry. The OK, RK and ID methods give very similar results while the NN methods yield almost systematically higher RMSE, indicating a lower skill. The ID and RK methods tend to provide slightly better results than OK, except for the Bab Taza station. The validation results of RK are not satisfactory for this station for the period 2006–2010 in particular, with RMSE exceeding 32 mm. It is the station with the highest altitude (808 m a.s.l.). After 2007 there are no data available for the Meska station (543 m a.s.l.), therefore stations close to Bab Taza and of similar altitude, such as Meska, are no longer available and the regression is performed only with stations at much lower altitudes. This highlights the uncertainties related to this type of validation with a limited number of stations: the absence of surrounding stations with a comparable elevation can cause a strong extrapolation from the regression between altitude and precipitation. Consequently, this extrapolation could produce a large uncertainty. In addition, since some stations are located outside the catchment, the leave-one-out validation does not give relevant information about the interpolation quality over the catchment of interest. Therefore, in addition to the statistical validation of interpolation methods, there is a need to perform validation through a hydrological model, since it provides spatial and temporal integration of information over a catchment.
Figure 4. Cross-validation results for the daily precipitation interpolation methods.
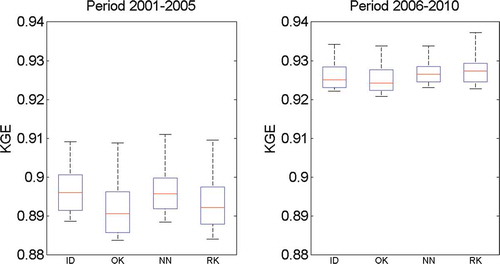
To perform the hydrological validation, the GR4J model is run with the different interpolated precipitation datasets (ID, OK, NN, RK), for the periods 2001–2005 and 2006–2010 (2000 and 2005 are warm-up years to initialize the reservoir states). As shown in , the ranking of the best performing rainfall inputs could vary when considering the best KGE value or the median of the 100 best performing simulations with different parameter sets. As an illustration, during the period 2001–2005, the best rainfall input is NN if considering the highest KGE value, while the best rainfall input if considering the median KGE value over the 100 best simulations is ID. Similarly, the ranking is also different between the two periods considered; the RK method gave the lowest KGE values during 2001–2005 but the highest KGE values for 2006–2010. However, as shown in , the parameter sets obtained with the different rainfall inputs are very similar. The ranges of parameters obtained by simulation for the catchment appear realistic given its physical characteristics and the range of parameters, shown on . In particular, the X4 parameter is less than 2 days, representing the time of concentration, and the X2 parameter is very small since mostly impermeable soils are found in the catchment.
Table 3. Mean and standard deviation of GR4J model parameters and mean KGE for the 100 best simulations obtained with the different interpolated precipitation datasets.
Table 4. Mean and standard deviation of GR4J model parameters and mean KGE for the 100 best simulations obtained TRMM-3B42 v7 precipitation.
Figure 5. Boxplots of the 100 best simulations, in terms of KGE values, of the GR4J model driven by the four different interpolated precipitation datasets (ID, OK, NN, RK). The boxes have lines at the lower quartile, median and upper quartile values; the whiskers extend from each end to the most extreme values.
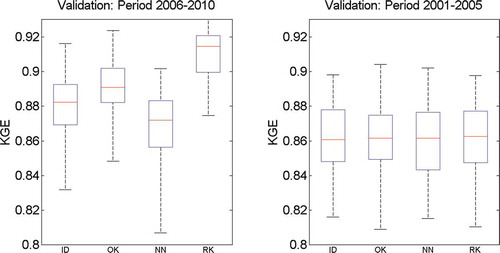
The 100 best parameter sets obtained with each rainfall input during the periods 2001–2005 and 2006–2010 are then used in validation for 2006–2010 and 2001–2005, respectively. Results displayed on show again that, if retaining only the best simulation, the ID, OK and RK methods provide similar results. The worst results for both validation periods are obtained with NN interpolated rainfall. The best results based on the median of the 100 best KGE values are obtained with the ID and OK methods in 2006–2010, and the OK and RK methods in 2001–2005. Overall, it can be concluded from these experiments that the ID, OK and RK interpolation methods tested provide equivalent results.
Figure 6. Boxplots of validation results for the 100 best parameters sets obtained during the period 2001–2005 (2006–2010) on the period 2006–2010 (2001–2005).
3.2 Comparison of ground-based and satellite-based precipitation estimates
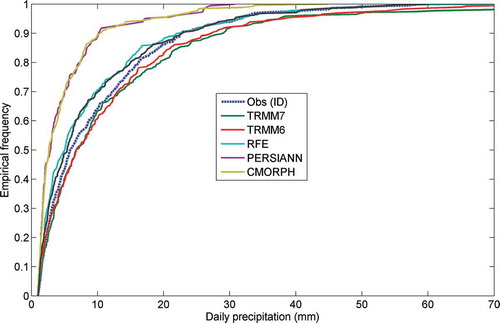
The features common to all the satellite-based precipitation products are the underestimation of both, monthly or annual precipitation () and the frequency of wet days (). While TRMM-3B42 v7 data are the closest to the observed precipitation (), PERSIANN-CDR and CMORPH1.0 have the highest bias. The CDF plots () of daily precipitation, excluding summer months (JJA), show that, for low to medium precipitation intensities up to the 70th percentile, the TRMM-3B42 v6 and v7 follow the observed distribution quite closely. However, for higher intensities, above the 80th and in particular the 90th percentile, there are departures from the observed distribution with TRMM-3B42 v6 and v7. On the other hand, for high precipitation values exceeding the 90th percentile, the RFE 2.0 product is able to reproduce the observed distribution: the two distributions are not statistically different according the Cramér-von Mises test (Darling Citation1957) at the 5% confidence level. It can be seen that the bias is not systematic, a constant bias correction (Duethmann et al. Citation2013) would not be satisfactory, and more advanced methods such as quantile mapping (Thiemig et al. Citation2013) should be preferred.
Figure 7. Comparison of mean monthly precipitation (left) and annual precipitation (right) totals for the Makhazine catchment from observed precipitation (inverse distance interpolation) and the different satellite rainfall products during the common period.
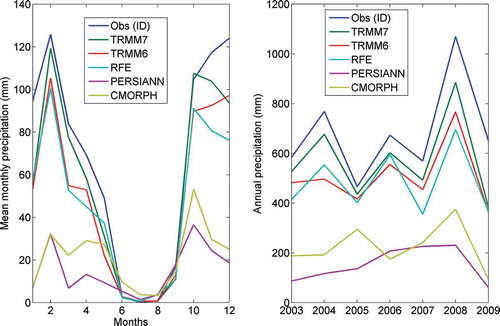
Figure 8. Ratio of wet days (P > 0) in observed or satellite precipitation data.
Figure 9. Cumulative distribution function of the wet days in observed or satellite precipitation data during the common period for all datasets 2003–2009 (JJA excluded).
3.3 Hydrological validation of satellite-based precipitation estimates
Since the focus is the evaluation of satellite rainfall data for use in ungauged basins, the GR4J model is forced by daily TRMM-3B42 v7 data, the best precipitation product identified in the previous section for the two periods considered previously, 2001–2005 and 2006–2010. Both periods are used in turn for calibration and validation using the method described in Section 2.4. An alternative approach could be to bias correct the precipitation inputs prior to their use in the hydrological model (Stisen and Sandholt Citation2010, Thiemig et al. Citation2013); however, this would not be feasible in the case of catchments without precipitation data. The mean KGE value over the 100 best simulations is 0.71 for 2001–2005 and 0.73 for 2006–2010. The performances in validation are quite degraded, with a mean KGE equal to 0.59 and 0.45 for the respective time periods, but with a large range between 0.71 and 0.09. These modest performances in validation could limit the model predictive capability. At the daily time step the modest performance may be caused by the differences in the way the satellite data represent the rainfall inputs between the two periods, in term of magnitude, sequence of events, spatial distribution, and also the differences in the way the hydrological model is able to reproduce discharge between the two periods.
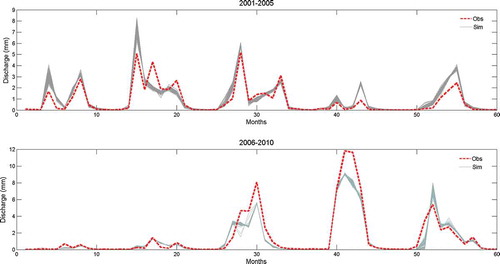
When computing the KGE values on mean monthly discharge, the model efficiency is greater and the spread of the 100 best KGE is much smaller, ranging from 0.89 to 0.92 in calibration and 0.69 to 0.86 in validation. Therefore the use of TRMM-3B42 v7 data could be suitable at the monthly time step for catchments located in northern Morocco, as observed previously by other studies in other regions (Li et al. Citation2012). The simulated monthly discharge in validation using the parameter sets corresponding to the 100 best KGE values in calibration are plotted on . There is good reproduction of the inter-annual variability, with an average bias on discharge of 18%, still much higher than with observed rainfall data since the bias is equal to 5% for monthly discharge simulated with observed rainfall data. With TRMM-3B42 v7 data, the bias could be of different magnitude depending on the year: the model tends to over- or underestimate discharge for high flow conditions but the low flow periods are correctly reproduced. When comparing the 100 best parameter sets obtained with GR4J driven by observed precipitation or TRMM-3B42 v7 data, the set of parameters obtained with TRMM-3B42 v7 data does not differ strongly from the parameter set obtained with gauge precipitation, as shown by the mean and standard deviations of the parameters in . The difference between the mean and standard deviations of the parameters obtained with observed or TRMM-3B42 v7 data is of the same order of magnitude as the change in parameter values when considering two different time periods (2001–2005 and 2006–2010) with a given precipitation input (). It is also worth noticing that with the model driven by either observed or TRMM-3B42 v7 precipitation data, the X2 parameter representing groundwater exchanges remains close to zero, which is physically realistic given the predominance of impermeable soils in this catchment (Tramblay et al. Citation2012).
Figure 10. Validation results of the monthly simulated discharge by the GR4J model forced by TRMM-3B42 v7 data. For the 2001–2005 period (upper panel), the model is run with the 100 best parameter sets obtained during 2006–2010 and for 2006–2010 (lower panel) the 100 parameters sets selected are those obtained during 2001–2005.
4 Conclusions
This study provides the first evaluation of satellite-based estimates of precipitation for hydrological modelling in a Maghreb country. The catchment chosen for this study is located in Northern Morocco, the rainiest region of North Africa where several major dams are essential for water supply. Prior to the comparison of the satellite-based precipitation estimates, different interpolation methods were tested to compute the ground-reference areal precipitation over the catchment with the existing raingauge network. The four different interpolation methods compared were: inverse distance, nearest neighbours, ordinary kriging and residual kriging with altitude as a covariate. Except for the nearest neighbours approach, which gave the worst results in validation, the three other methods provided very similar areal rainfall estimates for the catchment of interest.
In addition to the statistical evaluation of the different precipitation sources (ground and satellite based), a conceptual hydrological model (GR4J) was used to check how accurately the discharge can be reproduced with these different precipitation estimates. A simple conceptual model was retained since this type of model is widely used by water resources and dam management agencies in this region. To overcome the limitations related to the calibration of such a conceptual model, in particular the possible compensation effects between model parameters that could bias the results; a simulation approach over the model parameter space was considered instead of traditional calibration. The proposed approach relied on simulating a large number of model parameters drawn from an existing database of model parameter sets obtained over a large sample of catchments.
The five different satellite precipitation products showed very strong differences in their ability to reproduce the observed precipitation patterns. TRMM-3B42 v7 best reproduced the observed precipitation (monthly and annual totals) in the catchment of interest, followed by its precursor TRMM-3B42 v6, and also RFE 2.0. When TRMM-3B42 v7 data were used as input to the hydrological model, satisfactory results for discharge simulations were obtained at the monthly time step. Therefore TRMM-3B42 v7 data can be a useful alternative to ground-based precipitation records to set up models for water resources management, at least at the monthly time step. This result is of particular relevance in the Maghreb region where most of the catchments, and in particular several dam catchments, are ungauged. Indeed, for many dams located in Maghreb countries, time series of discharge exist for reservoir operations, but the raingauge network is very sparse or nonexistent.
There is a need to evaluate these satellite-based estimates of precipitation for different catchments located in Maghreb countries, to analyse whether the adequacy of these products can be different depending on the climate, topographic and land-use characteristics of the basins. In particular, these products should be tested in mountainous areas, which provide the major contribution to surface water resources, such as the Rif and Atlas ranges in Morocco providing most of the surface water to the Loukkos, Sebou, Tensift and Oum Rbia basins. These mountainous catchments remain a great modelling challenge since they combine difficulties stemming from the spatial variability induced by topography and elevation, snow processes and also the scarcity of data.
Acknowledgements
The observed data were provided by the department of Water Research and Planning (DRPE) of Morocco and the Hydraulic Basin Agency of Loukkos-Tétouan (ABHL).
Disclosure statement
No potential conflict of interest was reported by the authors.
Related Research Data
References
- Andreassian, V., et al., 2001. Impact of imperfect rainfall knowledge on the efficiency and the parameters of watershed models. Journal of Hydrology, 250, 206–223. doi:10.1016/S0022-1694(01)00437-1
- Ashouri, H., et al., 2015. PERSIANN-CDR: daily precipitation climate data record from multi-satellite observations for hydrological and climate studies. Bulletin of the American Meteorological Society, 96, 69–83. doi:10.1175/BAMS-D-13-00068.1
- Bastola, S. and Delclaux, F., 2012. Temporal extension of meteorological records for hydrological modelling of Lake Chad Basin (Africa) using satellite rainfall data and reanalysis datasets. Meteorological Applications, 19, 54–70. doi:10.1002/met.257
- Beven, K.J., 2006. A manifesto for the equifinality thesis. Journal of Hydrology, 320, 18–36. doi:10.1016/j.jhydrol.2005.07.007
- Beven, K.J. and Binley, A.M., 1992. The future of distributed models: model calibration and uncertainty prediction. Hydrological Processes, 6, 279–298. doi:10.1002/(ISSN)1099-1085
- Bitew, M.M. and Gebremichael, M., 2011. Evaluation of satellite rainfall products through hydrologic simulation in a fully distributed hydrologic model. Water Resources Research, 47, W06526. doi:10.1029/2010WR009917
- Darling, D.A., 1957. The Kolmogorov–Smirnov, Cramér–von Mises tests. Annals of Mathematical Statistics, 28, 823–838. doi:10.1214/aoms/1177706788
- Duethmann, D., et al., 2013. Evaluation of areal precipitation estimates based on downscaled reanalysis and station data by hydrological modelling. Hydrology and Earth System Sciences, 17, 2415–2434. doi:10.5194/hess-17-2415-2013
- Ezzine, H., Bouziane, A., and Ouazar, D.:., 2014. Seasonal comparisons of meteorological and agricultural drought indices in Morocco using open short time-series data, International. International Journal of Applied Earth Observation and Geoinformation, 26, 36–48. doi:10.1016/j.jag.2013.05.005
- Goovaerts, P., 2000. Geostatistical approaches for incorporating elevation into the spatial interpolation of rainfall. Journal of Hydrology, 228, 113–129. doi:10.1016/S0022-1694(00)00144-X
- Gosset, M., et al., 2013. Evaluation of several rainfall products used for hydrological applications over West Africa using two high-resolution gauge networks. Quarterly Journal of the Royal Meteorological Society, 139, 923–940. doi:10.1002/qj.2130
- Gourley, J.J. and Vieux, B.E., 2005. A method for evaluating the accuracy of quantitative precipitation estimates from a hydrologic modeling perspective. Journal of Hydrometeorology, 6 (2), 115–133. doi:10.1175/JHM408.1
- Gupta, H.V., et al., 2009. Decomposition of the mean squared error and NSE performance criteria: implications for improving hydrological modelling. Journal of Hydrology, 377 (1–2), 80–91. doi:10.1016/j.jhydrol.2009.08.003
- Heistermann, M. and Kneis, D., 2011. Benchmarking quantitative precipitation estimation by conceptual rainfall–runoff modeling. Water Resources Research, 47, W06514. doi:10.1029/2010WR009153
- Hengl, T., Heuvelink, G.B.M., and Rossiter, D.G., 2007. About regression–kriging: from equations to case studies. Computers and Geosciences, 33, 1301–1315. doi:10.1016/j.cageo.2007.05.001
- Huffman, G.J., et al., 2007. The TRMM Multisatellite Precipitation Analysis (TMPA):quasi-global, multiyear, combined-sensor precipitation estimates at fine scales. Journal of Hydrometeorology, 8 (1), 38–55. doi:10.1175/JHM560.1
- Hughes, D.A., 2006. Comparison of satellite rainfall data with observations from gauging station networks. Journal of Hydrology, 327, 399–410. doi:10.1016/j.jhydrol.2005.11.041
- Immerzeel, W.W., Rutten, M.M., and Droogers, P., 2009. Spatial downscaling of TRMM precipitation using vegetative response on the Iberian Peninsula. Remote Sensing of Environment, 113, 362–370. doi:10.1016/j.rse.2008.10.004
- Joyce, R.J., et al., 2004. CMORPH: a method that produces global precipitation estimates from passive microwave and infrared data at high spatial and temporal resolution. Journal of Hydrometeorology, 5 (3), 487–503. doi:10.1175/1525-7541(2004)005<0487:CAMTPG>2.0.CO;2
- Kidd, C. and Levizzani, V., 2011. Status of satellite precipitation retrievals. Hydrology and Earth System Sciences, 15, 1109–1116. doi:10.5194/hess-15-1109-2011
- Kling, H., Fuchs, M., and Paulin, M., 2012. Runoff conditions in the upper Danube basin under an ensemble of climate change scenarios. Journal of Hydrology, 424-425, 264–277. doi:10.1016/j.jhydrol.2012.01.011
- Kuczera, G. and Parent, E., 1998. Monte Carlo assessment of parameter uncertainty in conceptual catchment models: the metropolis algorithm. Journal of Hydrology, 211, 69–85. doi:10.1016/S0022-1694(98)00198-X
- Le Moine, N., et al., 2007. How can rainfall–runoff models handle intercatchment groundwater flows? Theoretical study based on 1040 French catchments. Water Resources Research, 43, W06428. doi:10.1029/2006WR005608
- Lebel, T., et al., 1987. On the accuracy of areal rainfall estimation. Water Resources Research, 23, 2123–2134. doi:10.1029/WR023i011p02123
- Li, X.-H., Zhang, Q., and Xu, C.-Y., 2012. Suitability of the TRMM satellite rainfalls in driving a distributed hydrological model for water balance computations in Xinjiang catchment, Poyang lake basin. Journal of Hydrology, 426–427 (2012), 28–38. doi:10.1016/j.jhydrol.2012.01.013
- McKay, M.D., Conover, W.J., and Beckman, R.J., 1979. A comparison of three methods for selecting values of input variables in the analysis of output from a computer code. Technometrics, 211, 239–245.
- Mehta, A.V. and Yang, S., 2008. Precipitation climatology over Mediterranean Basin from ten years of TRMM measurements. Advances in Geosciences, 17, 87–91. doi:10.5194/adgeo-17-87-2008
- Milewski, A., Elkadiri, R., and Durham, M., 2015. Assessment and comparison of TMPA satellite precipitation products in varying climatic and topographic regimes in Morocco. Remote Sensing, 7, 5697–5717. doi:10.3390/rs70505697
- Nastos, P.T., Kapsomenakis, J., and Douvis, K.C., 2013. Analysis of precipitation extremes based on satellite and high-resolution gridded data set over Mediterranean basin. Atmospheric Research, 131 (2013), 46–59. doi:10.1016/j.atmosres.2013.04.009
- Oudin, L., et al., 2005. Which potential evapotranspiration input for a lumped rainfall–runoff model? Part 2 – Towards a simple and efficient potential evapotranspiration model for rainfall–runoff modelling. Journal of Hydrology, 303, 290–306. doi:10.1016/j.jhydrol.2004.08.026
- Pan, M., Li, H., and Wood, E., 2010. Assessing the skill of satellite‐based precipitation estimates in hydrologic applications. Water Resources Research, 46, W09535. doi:10.1029/2009WR008290
- Perrin, C., et al., 2008. Discrete parameterization of hydrological models: evaluating the use of parameter sets libraries over 900 catchments. Water Resources Research, 44, W08447. doi:10.1029/2007WR006579
- Perrin, C., Michel, C., and Andreassian, V., 2003. Improvement of a parsimonious model for streamflow simulation. Journal of Hydrology, 279, 275–289. doi:10.1016/S0022-1694(03)00225-7
- Seibert, J. and Beven, K.J., 2009. Gauging the ungauged basin: how many discharge measurements are needed? Hydrology and Earth System Sciences, 13, 883–892. doi:10.5194/hess-13-883-2009
- Stedinger, J.R., et al., 2008. Appraisal of the generalized likelihood uncertainty estimation (GLUE) method. Water Resources Research, 44, W00B06. doi:10.1029/2008WR006822
- Stisen, S. and Sandholt, I., 2010. Evaluation of remote-sensing-based rainfall products through predictive capability in hydrological runoff modelling. Hydrological Processes, 24, 879–891. doi:10.1002/hyp.v24:7
- Thiemig, V., et al., 2013. Hydrological evaluation of satellite-based rainfall estimates over the Volta and Baro-Akobo Basin. Journal of Hydrology, 499, 324–338. doi:10.1016/j.jhydrol.2013.07.012
- Thiemig, V., et al., 2012. Validation of satellite-based precipitation products over sparsely gauged African river Basins. Journal Hydrometeor, 13, 1760–1783. doi:10.1175/JHM-D-12-032.1
- Tramblay, Y., et al., 2012. Estimation of antecedent wetness conditions for flood modelling in Northern Morocco. Hydrology and Earth System Sciences, 16, 4375–4386. doi:10.5194/hess-16-4375-2012
- Tramblay, Y., et al., 2013. High-resolution Med-CORDEX regional climate model simulations for hydrological impact studies: a first evaluation of the ALADIN-Climate model in Morocco. Hydrology and Earth System Sciences, 17, 3721–3739. doi:10.5194/hess-17-3721-2013
- Wackernagel, H., 1995. Multivariate Geostatistics. Berlin: Springer-Verlag.
- Wagner, P.D., et al., 2012. Comparison and evaluation of spatial interpolation schemes for daily rainfall in data scarce regions. Journal of Hydrology, 464–465, 388–400. doi:10.1016/j.jhydrol.2012.07.026
- Ward, E., et al., 2011. Evaluation of precipitation products over complex mountainous terrain: a water resources perspective. Advances in Water Resources, 34, 1222–1231. doi:10.1016/j.advwatres.2011.05.007
- Xie, P. and Arkin, P.A., 1996. Analyses of global monthly precipitation using gauge observations, satellite estimates, and numerical model predictions. Journal of Climate, 9, 840–858. doi:10.1175/1520-0442(1996)009<0840:AOGMPU>2.0.CO;2
- Xue, X., et al., 2013. Statistical and hydrological evaluation of TRMM-based multi-satellite precipitation analysis over the Wangchu basin of Bhutan: are the latest satellite precipitation products 3B42V7 ready for use in ungauged basins? Journal of Hydrology, 499, 91–99. doi:10.1016/j.jhydrol.2013.06.042