
ABSTRACT
Climate change may have significant consequences for water resources availability and management at the basin scale. This is particularly true for areas already suffering from water stress, such as the Mediterranean area. This work focused on studying these impacts in the Llobregat basin supplying the Barcelona region. Several climate projections, adapted to the spatiotemporal resolution of the study, were combined with a daily hydrological model to estimate future water availability. Depending on the scenario and the time period, different assessment indicators such as reliability and resilience showed a future decrease in water resources (up to 40%), with drought periods becoming more frequent. An additional uncertainty analysis showed the high variability of the results (annual water availability ranging from 147 hm3/year to 274 hm3/year), thus making accurate projections difficult. Finally, the study illustrates how climate change could be taken into account to provide adaptive measures for the future.
Editor M.C. Acreman; Associate editor J. Thompson
1 Introduction
Human-related changes, grouped under the expression “Global Change”, could result in significant impacts on quantity and quality management of water resources in the coming decades. The climate component appears to be a key factor in future water availability. The conclusions of the Intergovernmental Panel on Climate Change are unequivocal: climate change is underway and its effects within the coming half-century are at least partially inevitable (IPCC Citation2014). The rise of global surface temperature and changes in spatial and temporal patterns of precipitation will involve greater weather extremes, including higher intensity rainfall events or decreased streamflow conditions.
As a consequence, climate change could impact several hydrological regimes and water resources management throughout the world (van Dam Citation1999, Brekke et al. Citation2009, Schnorbus et al. Citation2014). Several studies have illustrated these impacts on the hydrological cycle at the basin scale, e.g. for the River Seine (Ducharne et al. Citation2010), the River Rhine (Lenderink et al. Citation2007) or smaller basins (Velázquez et al. Citation2013, Seiller and Anctil Citation2014). Studies usually project a marked depletion of water resources, with the decrease in annual mean river discharge reaching 30% at the end of the 21st century.
These consequences are also particularly true for basins in Mediterranean countries, where water availability is a limiting factor for socio-economic development (Cudennec et al. Citation2007). At the scale of the Mediterranean area, it is probable that the rise in the average annual temperature will be slightly higher than that of the world as a whole (Giorgi and Lionello Citation2008, Hallegatte Citation2009, Cabello et al. Citation2011): the average increase is estimated to be between about 2°C and 6.5°C by the end of the century. There will also be a reduction of the regional average precipitation, within the range of −5% to −30%, depending on the IPCC scenario and the season.
As a consequence, climate change could severely impact water resources (Garcia-Ruiz et al. Citation2011, Senatore et al. Citation2011) and exacerbate water availability issues that the Mediterranean basin has already faced in past decades, due to a combination of climatological, hydrological and infrastructural factors. Here, precipitation can be subject to high inter-annual and seasonal variability and coincidence of a dry period with the warmest temperatures during the summer months (Bonaccorso et al. Citation2003, Piccarreta et al. Citation2004, Vicente-Serrano Citation2006, Nicault et al. Citation2008). Moreover, these regions are also subject to intense rain events characterized by several hundreds of mm of rainfall in a few hours, which may cause flash floods (Younis et al. Citation2008, Gaume et al. Citation2009). Consequently, water is relatively scarce throughout most of the year and mainly dependent on runoff from mountainous areas (Viviroli and Weingartner Citation2004, de Jong et al. Citation2009). The irregular spatial distribution of precipitation also leads to notable disparities in water availability between different territories, aggravating the situation concerning water management. Moreover, the presence of impervious soils and the lack of aquifers increase the need for storing water when and where it is available.
In this context, the rising demand for water leads to the development of expensive and complex infrastructure needed to store seasonal or annual water surpluses in reservoirs, which are later transferred to high-demand areas, and to the intensification of the use of groundwater and its reserves (Ibanez and Prat Citation2003, Lopez-Moreno Citation2008). Unfortunately, current water management systems appear neither adapted nor flexible to changing situations. Large infrastructure developments during the 20th century were designed and constructed on the basis that water resources would be relatively stable over time, without a long-term perspective that takes into account future changes. For instance, some dams initially built to match water demand and supply appear no longer relevant due to increasing demands coupled with large variations in precipitation and intensification of drought periods. As a consequence, water scarcity has become particularly intense where the expansion of irrigated areas and urbanization have already caused increasing water supply difficulties.
Some supply systems are already vulnerable to climate conditions. For example in Spain, for the last 10 years, droughts have been generalized and water reserves have remained close to their warning limits of capacity over a large part of the territory (Morán-Tejeda et al. Citation2010). In 2007–2008, a severe drought affected Catalonia. The volume of water stored in the reservoirs, critical for the water supply to more than 3 million inhabitants, was close to the 15% threshold below which the water is considered unusable. Under pressure, local politicians organized radical solutions, such as water importation by means of tankers from Tarragona (southern Catalonia, Spain) and Marseille (southern France), to contribute to the water supply of the city of Barcelona, at a cost of 22 million euros. Since that time, many plans have been considered to improve the water autonomy of Catalonia, such as a seawater desalination plant (already constructed and in standby), and possible water transfer from the River Rhone or the River Segre.
This paper is focused on the impact of climate change on water resources availability in one of the key basins of Catalonia: the Llobregat basin. It is a highly populated and urbanized catchment, which supplies the Barcelona region. This work particularly aims to study: (i) how water availability could be modified regarding climate change in the 21st century; (ii) how significant is the uncertainty related to these estimations; and (iii) which measures could be taken to mitigate climate change regarding these projections and the related uncertainty.
Although necessary, the integration of future changes in long-term planning is very complex due to the difficulty in making accurate projections of water availability. Many sources of uncertainty appear during the modelling process that can affect the conclusions and weaken the recommended standards. Essentially, they can be regrouped into two categories (Boé et al. Citation2009): (i) those related to future climate projections (gas emission scenarios, global climate modelling and downscaling); (ii) those related to hydrological modelling (structure and parameterization).
Several works have already studied the impact of these uncertainties on future water resources estimations. They usually adopt a “top-down” approach involving the propagation of future climate scenarios through hydrological model(s) to derive an estimate of future impact on water resources (see Wilby and Dessai Citation2010, Bastola et al. Citation2011, for instance). Usually, an ensemble of climate simulations feeds an ensemble of hydrological models of various structural complexities. The combination of climate and hydrological models generates a hydro-climatic ensemble that is analysed to quantify the total related uncertainty.
Recent studies have suggested that global circulation models (GCM) uncertainty is the largest (dominant) source of uncertainty (Wilby et al. Citation2006, Prudhomme and Davies Citation2008, Kay et al. Citation2009). It is due to imperfections in the models, essentially because anthropogenic greenhouse gas emission as well as some climate change effects and feedbacks cannot be predicted in a deterministic way (Foley Citation2010). Consequently, these works recommend the use of several GCM/regional climate models (RCM) outputs to generate impact ensembles and adopt a more cautious approach (Prudhomme et al. Citation2010). Uncertainty related to hydrological models or their parameterization often appears to be of secondary importance, but it can also be very significant (Vaze et al. Citation2010, Velázquez et al. Citation2013). The non-stationarity in climate–runoff relationships and dominant hydrological processes can affect the reliability of a model calibrated on historical climatological data. For these reasons, some precautions regarding the choice of model and its calibration should be taken. The use of several hydrological models is also recommended (see Gosling et al. Citation2011, Poulin et al. Citation2011, for instance).
Based on these considerations, a “top-down” approach has been established to produce hydro-climatic ensembles. Hydrological simulations using small spatial scale climatic projections have been used to estimate future water availability. These have been coupled with an uncertainty analysis focussed on both GCM and hydrological model errors. In order to limit these errors, the materials (climatic data and hydrological model) used for this work have previously proven their relevance in the studied area. Nevertheless, this work related to future water availability is the first conducted on the Llobregat basin, which is a particularly strategic basin regarding the Barcelona metropolitan area. It is part of the WATER CHANGEFootnote1 project (Life+ funding) which aims to develop a methodology to evaluate global change impacts on water resources quantity and quality and define adaptation strategies based on results from different scenarios and cost-benefit analysis.
The paper is structured as follows: the next section presents the scope of study in more detail, including a description of the study area, the Llobregat basin, and the available hydro-meteorological data. Section 3 describes the different climate scenarios used to estimate future climate change and how they are adapted to the Llobregat basin. Results obtained in terms of water availability are presented in Section 4. The uncertainty analysis studies the influence of each source of uncertainty on the future water resources projections in Section 5. Finally, Section 6 summarizes the main results and concludes with possible future improvements and applications of this study in water management.
2 Case study
2.1 The Llobregat basin
The Llobregat River headwaters rise in the Pre-Pyrenees Mountains (2050 m), and the river outflows to the Mediterranean Sea just west of the city of Barcelona (). The river is 175 km long and covers a catchment of 5000 km2. Most of the population is concentrated near the coast. The mountainous northern part and the central part of the basin are covered by forests of Aleppo pines and farmland. The downstream part of the basin is more urbanized and the vegetation is limited mainly to scrubland and crops (see Arozarena Villar et al. Citation2006 for a detailed description of the land cover). In the central area the main activities are rainfed agriculture and animal raising on intensive farms, while intensively irrigated areas are found in the lower part, constrained by the urban and service areas.
Figure 1. The Llobregat basin disaggregated into sub-basins and the meteo-hydrographical network. Average monthly volumes (computed for the 1980–2010 time period) reaching the three dams are indicated.
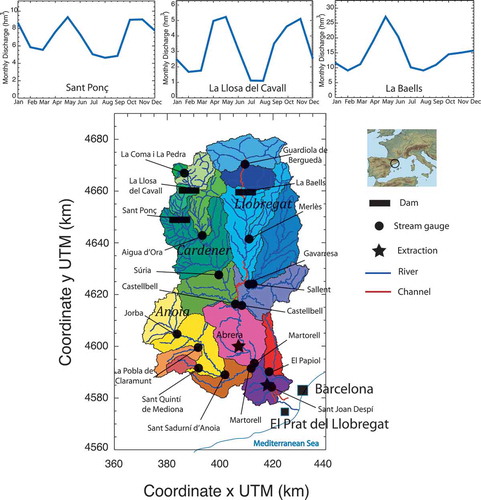
Three large dams (total capacity of 219 hm3) in the upper area regulate the river flow in downstream. The river’s regime is characterized by high water levels in spring, with a maximum in May, and other more variable maxima in autumn in October–November, which often cause flash floods and other floods. The minima are in January because of snow retention in the upstream area, which is dominated by highlands of over 2000 m, and especially in August, due to the dry summer.
Average annual river flow is about 700 hm3/year, representing approximately 20% of the total rainfall. Due to the strong temporal variability of the hydrological flows, only a fraction can be used to satisfy the water demand, explicitly the flow controlled by the dams and the river baseflow downstream. The hydrological system includes five major aquifers. Two of them are located in the headwaters of the Llobregat and its tributaries (Cardener and Anoia), and the other three are alluvial aquifers (Abrera, Sant Andreu de la Barc, and Lower Llobregat), connected to the downstream part of the river. Alternative water resources are also used to improve the system, including the desalination plant situated in El Prat de Llobregat (in service since 2009) and reclaimed water from the wastewater treatment plant also in El Prat de Llobregat.
The Llobregat basin is also a highly populated catchment, where water resources are used for various purposes: drinking water production (around 350 hm3/year for the conurbation of Barcelona of more than 3 million inhabitants), agricultural irrigation (around 32 hm3/year), industry, and in-river hydro-electric energy production from urban distribution networks and private wells or direct river abstraction. Water from the Llobregat basin is conveyed to the whole Metropolitan Region of Barcelona via the water transport system of the Ter–Llobregat and SGAB systems, which also receive water from the Ter River in the north of the area. From a socio-economic point of view, this area and its surroundings are the most vulnerable in Mediterranean Spain.
2.2 Hydro-meteorological data
The Llobregat watershed is covered by quite a dense measuring instrumentation network, except at the highest altitudes. Meteorological and hydrological daily data comprising precipitation, temperature and discharge have been compiled for the 1980–2010 time period from the Spanish Meteorological Agency (AEMET) and the Meteorological Service of Catalonia (SMC). They cover the whole basin with complete time series. Note that these punctual data have been interpolated at the watershed scale using a spline method. Moreover, a historical database of daily precipitation fields is also available (from 1940 to 2010). Based on precipitation patterns computed from weather radar, the database is characterized by high spatial resolution (cells of 3 km) which allows the representation of local variability (Versini et al. Citation2012).
Daily discharge data have also been compiled from the Catalonian water agency (ACA). Time series from 1980 to 2010 have been analysed regarding related precipitation and cleaned by removing outliers for several sub-basins (See ).
3 Climate change scenarios
Different climate scenarios have been applied to represent, as well as possible, precipitation and temperature projections for the 21st century over the Llobregat basin. They combine GCM and a regionalization technique (known as downscaling). Downscaling is used to bridge the gap between the large-scale information provided by GCMs and the small spatial scales required for regional and environmental impact studies. It is usually classified into two categories: statistical downscaling and dynamical downscaling (see Gutmann et al. Citation2012 for a detailed presentation).
Here, two different options have been used: a dynamical downscaling with the MM5 regional climate model (from SMC) and a statistical technique based on an analogue method (from AEMET). These scenarios have been compared and analysed on a historical time period using available observed data. They are presented in detail below.
3.1 Presentation of the different scenarios
3.1.1 SMC scenarios
High-resolution climate data were provided by SMC for the 1971–2100 time period with a resolution of 15 km (Barrera-Escoda and Cunillera Citation2011). The MM5 regional climate model was nested into ECHAM5-MPI/OM atmosphere–ocean coupled GCM outputs in order to generate the regionalized scenarios forced by two of the IPCC Special Report on Emission Scenarios (SRES) based on CO2 emissions: A2 and B1. The A2 scenario assumes a high anthropogenic impact on climate whereas in B1 the impact is assumed to be more moderate (Nakicenovic et al. Citation2000). In general, SMC scenarios show a reliable distribution of the simulated spatial patterns for annual and semi-annual precipitation compared to observations. They also seem to accurately reproduce the evolution of annual anomalies for Catalonia (Barrera-Escoda and Cunillera 2010a, Citation2010b).
3.1.2 AEMET scenarios
These scenarios come from a statistical downscaling based on the CGCM2 global circulation model output for the A2 and B2 IPCC scenarios (AEMET Citation2008). An analogue method (called the FIC analogues method; see Brunet et al. Citation2007 for details) was developed and applied to rescale these climate scenarios to a higher resolution. It compared predictors at a large scale (geographic flows on surfaces of 1000 and 500 hPa) and punctual observed data (predictands). The relationship linking predictors and predictands defined on the historical time period was transferred and used on the future GCM output in order to estimate future punctual values. This technique was applied for 130 rain gauges and 63 meteorological stations located in Spain.
SMC and AEMET are traditional sources of data for the Catalonian public agency in charge of water management (ACA). They provided climate projections given the opportunity to consider a larger range of possible projections (and associated uncertainty) in terms of SRES scenario (A2 and B1 for SMC, and A2 and B2 for AEMET) and downscaling method (dynamical or statistical downscaling).
3.2 Results on the control period
The results obtained from the different methods on the historical time period (1970–2000) were compared with the observed data for the Llobregat basin. Despite the fact that both methods seemed to reproduce the correct climatological cycle over Catalonia, they failed to reproduce extreme values and seasonality at the basin scale. This is especially true for precipitation: a conspicuous underestimation of intense precipitation for AEMET data and a tendency to overestimate precipitation with a higher proportion of daily precipitation higher than 10 mm for the SMC data. The seasonal cycle in the distribution of precipitation was studied by representing the average monthly precipitation on the historical time period (). Precipitation was poorly represented by all the models. The AEMET model failed to correctly reproduce the dry period in summer and underestimated the precipitation in autumn, whereas SMC respected the seasonal variation but overestimated values from October to April and underestimated them from June to September. This could affect the hydrological results by underestimating the drought period because of the overestimation of stored water in winter or precipitation in summer.
Figure 2. (a) Seasonal precipitation cycle (average monthly accumulation) and (b) seasonal temperature cycle (average monthly value) on the control time period (1970–1990).
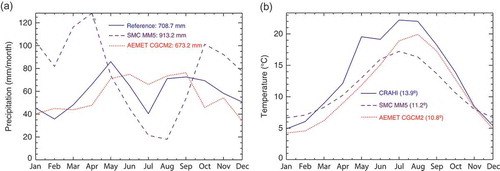
Concerning daily temperature, the seasonal variability (temperature increases and decreases) was correctly reproduced by all the models; the lowest values being in winter and the highest in summer (). Nevertheless, some bias can be noticed; AEMET data tend to shift the temperature peak in August. Moreover, a clear bias is noticed in low temperatures between observed and SMC simulated values for the hottest months. This underestimation may exceed 4°C in July and August. Conversely, temperatures were slightly overestimated in winter (by 1–2°C).
3.3 Bias correction and adaptation to the Llobregat basin
As illustrated by the results obtained from both climate projections (MM5-SMC and CGCM2-AEMET) on the past time period, GCM and RCM outputs may contain biases that prevent an accurate reproduction of observed meteorological conditions. Consequently, some form of bias correction is necessary, especially for precipitation (Maraun et al. Citation2010) but also for temperature.
Several bias correction (BC) techniques exist and were presented in Déqué (Citation2007). They can be regrouped into two general approaches (Muerth et al. Citation2013): (i) extraction of deltas (differences between future and past output of the model) to be applied to past observations; (ii) deriving scaling parameters to adjust both past and future RCM outputs to more closely fit observed climatic conditions. These techniques have commonly been used in climate change impact studies (see Ehret et al. Citation2012 for references) because they are attractive, having ease of application, and the ability to allow future changes in variability and flexibility to correct the GCM outputs for the parameters of interest (Johnson and Sharma Citation2012).
Nevertheless, BC is far from perfect because it is based on numerous assumptions, which are listed and discussed in Ehret et al. (Citation2012). Among these assumptions, three can be put forward: (i) stationarity of the correction (correction parameters derived from past data still hold for future data); (ii) suitability of GCM/RCM to predict the effect of climate change although they require severe corrections; and (iii) the statistical nature of BC that can sacrifice physical coherence during the process. Ehret et al. (Citation2012) argued that bias correction hides rather than reduces uncertainty, and made some proposals to avoid or improve the use of BC.
Based on these considerations, a BC procedure was implemented to adapt projected data to the Llobregat basin. Seasonal variability was corrected for both models, SMC intense precipitation was reduced, whereas temperatures were increased.
In order to separate the impact of bias correction from the downscaling procedure and to properly represent the seasonal variability, a monthly correction was performed, as in Muerth et al. (Citation2013). A multilinear interpolation based on past data relationships was applied to correct future scenarios. The following methodology was applied for both precipitation and temperature fields:
On the historical time period, daily simulated and observed data (averaged over the Llobregat basin) were ordered and compared for each month of the year.
On the future time period, the areal daily data were calculated over the Llobregat basin and corrected using a multilinear interpolation based on past data relationships.
Ten historical precipitation/temperature fields characterized by the closest resulting average values were selected.
The distances between the original future field and the 10 selected historical fields were calculated. The field with the shortest distance was selected. It represented the best field in terms of spatial variability.
Finally, the corrected scenarios should respect the seasonal cycle and also the spatial variability provided by the initial scenario and the accuracy of actual measurements. Assuming the seasonal cycle will not be modified in the future, it should be possible to detect future evolution of climate.
3.4 Results on the future time period
Based on the previous methodology, precipitation and temperature scenarios issued by SMC and AEMET were corrected and adapted to the Llobregat basin. Future seasonal variability of precipitation and temperature are shown in for three different time periods (2011–2040, 2041–2070 and 2071–2100). The data represent areal values for the whole basin. The different 30-year periods have been defined in order to be comparable with the historical period characterized by the same duration.
Figure 3. (a) Seasonal precipitation cycle (average monthly accumulation) and (b) seasonal temperature cycle on the future time period for downscaled precipitation scenarios (2010–2100).
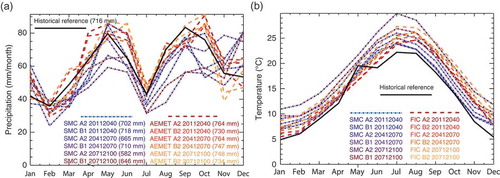
Concerning precipitation, SMC scenarios appear to be more pessimistic than AEMET scenarios and, among them, the worst are those based on the A2 IPCC scenario. They forecast a general decrease in precipitation, especially during wet periods (spring and autumn). AEMET scenarios are quite similar to the reference one and reproduced very few future changes. Nevertheless, both types of scenario showed the same tendency for average total precipitation to decrease during the 21st century.
The seasonal variability of temperature showed a general increase of temperature throughout the year for every scenario. Whatever the future time period and the IPCC scenario, the average temperature will increase by 2–8°C during the 21st century. The worst case is represented by the A2 scenario for the 2071–2100 period, with a temperature increase reaching 8°C in summer.
4 Water availability simulation
4.1 Presentation of the hydrological model
The HBV rainfall–runoff model (Bergström Citation1992) was used to simulate future water availability in the Llobregat basin. In different versions, the HBV model has been applied in more than 40 countries all over the world (Zhang and Lindström Citation1997, Lidén and Harlin Citation2000, Jin et al. Citation2009). It has already been used in several climate change studies to estimate future discharge modifications (Merritt et al. Citation2006, Jiang et al. Citation2007, Leander and Buishand Citation2007, Akhtar et al. Citation2008, Steele-Dunne et al. Citation2008). The HBV model is commonly used as a semi-distributed model by dividing the catchment into sub-watersheds and running on daily rainfall and air temperature values. At the sub-basin scale, the HBV model is divided into several routines depending on the process to be represented: direct runoff, soil moisture, upper and lower reservoir filling and emptying, and flow transfer.
4.2 Calibration on historical data
In order to simulate the water available for water supply, the HBV model was applied specifically to the sub-basins located upstream of the three dams. These sub-basins (La Llosa del Cavall, Sant Ponç, Aigua d’Ora, Guardiola de Berguedà, La Baells, Merlès, Gavarresa; see ) are called contributor basins. They are the basins that are integrated in the management model used by the ACA to simulate natural contributions to the Llobregat system. A set of parameters was adjusted for each of these sub-basins comparing daily simulated and observed discharges (when they were available).
Hydrological model calibration is a key issue in climate change impact studies. The underlying assumption of this approach is the stability of the dominant hydrological processes under a changed climatic condition (Vaze et al. Citation2010). The commonly used procedure (split-sample test with calibration and validation of a set of parameters on two historical time periods) may face to two significant issues: (i) the equifinality issue (multiple sets produce acceptable simulations), and (ii) the non-stationarity issue (difficulty to identify model parameters that are suitable for both current and future conditions). The first point is studied in Section 5.3. Concerning the second point, it is clear that calibration on present conditions may become invalid for the evaluation of climate change impacts (Mauser and Bach, Citation2009).
To study the effect of a change in climate, Klemes (Citation1986) suggested using a differential split-sample test with the definition of two periods with different values of the climate parameters of interest. This procedure was applied on the available data with the definition of two climatologically different sub-periods. The first one (1980–2000, used for calibration) was considered as a wet (normal) period with an average annual amount of precipitation of 690 mm on the Llobregat basin and four occurrences of a dry year (<600 mm). The second sub-period (2001–2010, used for validation) was supposed to reflect climate change with average annual precipitation of 560 mm and six occurrences of a dry year.
The optimization criterion (f0) used to evaluate the performance of the model combines the Nash-Sutcliffe (NS) efficiency (Nash and Sutcliffe Citation1970) and absolute error between observed and simulated volumes:
where Qsim(t) represents the simulated discharges, Qobs(t) the observed discharges, the average observed discharge, and n the number of days of the calibration period for which observations are available.
Details of the calibration results are given in . Absolute errors between observed and simulated volumes calculated for both periods (around 5%) illustrate the ability of the model to reproduce water availability correctly. Although NS efficiencies were quite low (but similar to those obtained in Velázquez et al. Citation2013), the simulated discharges match well with the observed ones at the daily time scale. The differences between observations and simulations are usually due to an underestimation of peak discharge. From a water management point of view this is not a major issue. It has to be noted that the drought period of 2007–2008 was particularly well reproduced. Some tests have already been conducted to verify stationarity (calibration on 1990–2010 and validation on 1980–1989) and have provided similar results.
Table 1. Results of the calibration for the gauged sub-basins. The Nash-Sutcliffe efficiency is reported as the absolute volume error (Error V) by comparing observed and simulated time series on the calibration period (left) and the validation period (right).
4.3 Simulation of future water availability
Future water availability (WA) was computed by applying the HBV model for the different climate scenarios, the future precipitation and temperature considered as inputs, and the different time periods.
First, the main tendencies were calculated for each configuration, including average precipitation, temperature, and mean, minimum and maximum annual water availability for the contributor basins (accumulated simulated volume). These results are summarized in .
Table 2. Main results of future water availability (WA) (expressed in %) simulations: mean, minimum and maximum values, annual reliability and resilience for SMC and AEMET climate scenarios for the contributor sub-basins. The reference values were computed for the historical period (1980–2000). The bold value of +42% resulted from an extreme event (precipitation of 150 mm over the basins).
Although total precipitation seems to be less affected by climate change in the upstream sub-basins, the results follow the general trends defined over the entire Llobregat basin and presented in the previous section. Concerning SMC scenarios, no modification in precipitation and an increase in temperature were noticed for the first part of the 21st century. In terms of water availability, the A2 scenario was always worse than B1, with a very strong intensification of climate change during the last period and a decrease of up to 40% in the worst case. With few exceptions (an extreme episode occurring during the second future period for which daily rainfall reaches 150 mm over every contributor basin), minimum and especially maximum water availability tended to decrease with time. Future drought and wet periods seemed to be drier.
Conversely, AEMET scenarios showed a slight increase of precipitation compared to the historical reference. Combined with a temperature (and evapotranspiration) increase, they yielded a general water availability decrease (up to 13% for the B2 scenario). This almost invariance of average precipitation led to limited variations of water availability, with minimum values higher and maximum values lower, closer to the mean values.
In a second step, some indicators were computed to assess how the Llobregat basin will be able to supply sufficient water in the future. First, a “reliability” indicator was calculated, which represents the ability of the system to perform and maintain its functions in routine circumstances (business as usual), as well as hostile or unexpected circumstances. Here, the reliability of the system is defined as the number of values in a satisfactory state divided by the total number of values in the time series (see Equation (2)). In this study a value was considered satisfactory if annual water availability was over the 250 hm3 threshold representing a state of drought. It was considered unsatisfactory when annual water availability failed to reach this value:
Second, a “resilience” indicator was calculated to evaluate the capacity of the system to respond to a perturbation or disturbance by resisting damage or recovering quickly. In this context, resilience is defined as the probability that when a system fails the next state will be satisfactory. The resilience cannot be defined if the system never reaches an unsatisfactory state. Here, the resilience was calculated as follows:
Compared with previous results, those obtained for AEMET and SMC scenarios were significantly different. Because of the absence of significant variations, water availability values computed from AEMET scenarios were quite optimistic and similar to the historical situation. The reliability indicator was almost equal to or higher than the past value (65%), limiting the number of droughts in the future. Similarly, the resilience indicator illustrated a moderate capacity for recovery (around 50%), equal to the past one. It illustrated that, for 50% of the time, an annual drought situation is followed by another one. Water availability values computed from SMC scenarios were more pessimistic. Both reliability and resilience indicators showed significant decreases with time whatever the considered emission scenarios. From year 2041, reliability decreased below 60%, reaching 26% in the worst case, indicating enhancement of drought and deficit periods. Resilience above 30% shows that such a perturbation is usually followed by another similar situation in more than two out of three times, which may cause long dry periods of several years.
To study this kind of situation, 3-year water availability accumulations (total amount of water volume computed on 3-year time windows) were computed for each 30-year time period. The evolution of these 3-year accumulations is represented in . On the past period, the lowest 3-year accumulation was 450 hm3. This occurred in 2007–2008 during the intense period of drought that severely affected Catalonia. In coordination with the management services, the value of 700 hm3 was used as the critical reference to evaluate the severity of future droughts.
Figure 4. Three-year accumulation computed by the HBV model for SMC and AEMET climate scenarios.
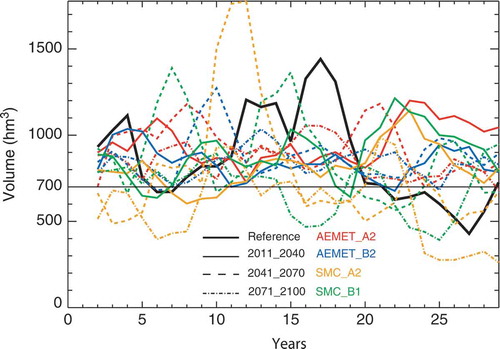
The 3-year accumulations of water availability for the first future period (2011–2040) based on SMC scenarios were similar to the situation that occurred during the last 30 years. The occurrence of values lower than 700 hm3 was very close, with four or five drought years over this period, depending on the IPCC scenario. This phenomenon increased during the 21st century, with around 10 dry situations per 30-year period, but reaching 20 for the most pessimistic situation (A2 scenario for the 2071–2100 time period). The results showed that drought periods could be more frequent but also more intense in the future.
As AEMET precipitation and temperature scenarios are less variable from one year to another, the 3-year accumulations variation was less pronounced. Whatever the time period or the IPCC scenario, the number of drought situations varied between 0 and 2 over the 30-year periods.
5 Uncertainty analysis
As presented above, computed results have a large uncertainty due to different sources of error that appear during the modelling process. These numerous sources of uncertainty can be regrouped into two categories: those related to future climate calculations and those related to hydrological modelling.
5.1 Methodology
The methodology chosen to estimate and represent the remaining sources of uncertainty was based on an “uncertainty cascade” (Wilby and Harris Citation2006). During the different steps of the modelling process, some sets of equiprobable inputs were used to produce an ensemble of several water availability time series. It was assumed that each member of the ensemble represents a possible state of the considered variable by taking into account the uncertainty from corrected climate scenarios and hydrological modelling.
Here, the following sources of uncertainty have been considered:
'Related to future climate scenarios: in order to take into account gas emission scenarios, global climate modelling and downscaling uncertainties, several ensembles have been created. As climate projections provided by AEMET and SMC calculated from gas emission scenarios (IPCC) are very different depending on the selected hypothesis and model, four different climate scenario configurations were used: SMC-A2, SMC-B1, AEMET-A2 and AEMET-B2. The uncertainty related to the bias-correction method proposed here to correct and adapt climate scenarios to the Llobregat basin was also considered. Ten historical fields were selected (for which the distance between the projected and corrected maps was the lowest) from the historical database to represent future climate. As these selected analogues are characterized by some very similar distances from the original fields (in terms of average values, not spatial distribution), it was assumed that they all have the same probability of occurrence.
Hydrological modelling: Here only the uncertainty due to model parameterization was considered. Different approaches have been proposed to quantify the uncertainty of model parameter estimation (Matott and Purucker Citation2009), including Bayesian methods (Kuczera et al. Citation2006) and simulation-based approaches (Vrugt et al. Citation2003). A common principle of these methods is the equifinality assumption, in which it is assumed that there are multiple sets of model parameters that produce acceptable simulations of the observed discharges, based on the resulting objective function. Equifinality is the basis of the generalized likelihood uncertainty estimation method (GLUE), a Monte Carlo-based method that allows uncertainty analysis of model parameter estimation (Beven and Binley Citation1992).
In order to implement the GLUE methodology, a total of 5000 parameter sets were produced from uniform distributions for each parameter. The NS efficiency was selected as a likelihood function for the evaluation of the simulation results. For each sub-basin where the method was applied, the best NS efficiency was selected. A threshold was defined for the selection of acceptable parameter sets. It represented a 5% decrease of the best NS efficiency values. As a consequence, the parameter sets producing values lower than this threshold in the NS efficiency values were rejected and excluded from the acceptable parameter sets. The number, M, of acceptable parameter sets selected was between 9 and 15, depending on the basin.
Model accuracy and structure (its ability to represent past and future hydrological processes) were not considered. This point is discussed in Section 6. The uncertainty due to hydro-meteorological (precipitation, temperature, discharge) measurements used to calibrate the models was also not taken into consideration.
The uncertainty impact on the water availability simulations and sensibility to each source of uncertainty was assessed using a dispersion function (Disp):
where min(WA), max(WA) and mean(WA) are the minimum, maximum and mean values of average annual water availability for the 10 ensemble members.
5.2 Future climate scenario uncertainty
The water availability results from these 10 modified climate scenarios are summarized in . They were calculated using the calibrated parameters defined in Section 4.2. Dispersion for both AEMET and SMC scenarios was similar from one time period to another: between 10% and 20% for SMC, and close to 10% for AEMET. This difference is quite similar to the difference between historical and projected water availability whatever climate scenario is chosen (see ). That means that the step of climate scenario correction represents a significant source of uncertainty in the water availability simulation. The difference between the AEMET and SMC scenarios comes from the initial variation in climate scenarios, the data provided by the SMC being the most fluctuating.
Table 3. Annual water availability computed for the ensemble of modified climate scenarios.
5.3 Hydrological model uncertainty
Similarly, as in the previous section, the dispersion indicator was computed for the ensemble of simulated water availability computed from the acceptable parameter sets. Results are presented in . The dispersion and the uncertainty caused by the hydrological model parameterization were higher than those computed from downscaled climate scenarios: dispersion varied between 16% and 24%, depending on the scenario and the time period. Although the choice of future climate scenarios remains the highest source of uncertainty, these results confirmed that hydrological model parameterization represents a significant source of uncertainty. Due to equifinality, several parameter sets led to similar results in terms of NS efficiency on the historical period. Applied to the future scenarios, they caused large variability between the different simulations.
Table 4. Water availability computed for the ensemble of HBV parameters.
5.4 Combination
The different ensembles defined above (climate scenario configurations, downscaled fields, model parameters) were combined to study the propagation of uncertainty during the modelling process. An ensemble of N climate members (N = 10 in this case) and M acceptable parameter sets, depending on the sub-basin, were used to simulate N × M time series of discharge.
Water availability was computed for each member of this ensemble by combining HBV parameters and climate scenarios. The results are summarized in . Regarding the results obtained in the two previous sections, the dispersion indicator seemed to be quite linear, the total dispersion being very similar to the sum of the dispersion values obtained for both climate scenarios and HBV model uncertainties. This dispersion can reach almost 40% for the SMC scenarios and around 30% for the AEMET scenarios. These results illustrate that deterministic projections of WA are characterized by an error, which is higher than the climate change consequences calculated in Section 4.3, in most cases.
Table 5. Water availability computed for the ensemble of climate scenarios and HBV parameters.
6 Discussion and conclusion
The impact of climate change on water availability was studied for the Llobregat basin, for which water resources management is a critical issue since it has been frequently affected by severe droughts in the recent past. Climate change, which may amplify the current situation, has to be taken into account to assess and improve water management in the future.
For this reason, future water availability was estimated by combining climate change scenarios and hydrological modelling. These different climate projections were provided by the Spanish and Catalonian weather agencies (AEMET and SMC) and based on greenhouse gas emission hypotheses. They both combine a global circulation model, a downscaling technique and a bias-correction method to obtain climate data adapted to the spatiotemporal scale of the study.
Resulting water availability simulations were assessed by indicators such as reliability and resilience. These projections appeared to vary significantly from one scenario to another and from one time period to another. Those based on AEMET climate scenarios led to a future situation similar to the current one, characterized by a moderately worse context (decrease of annual volume of about 10%) but with less pronounced extremes. Water availability projections based on SMC scenarios were more pessimistic (decrease of annual volume reaching 40%) with an increase in deficit situations that could be more frequent and more intense (every 2 years during the 21st century for the worst case).
In parallel, an uncertainty analysis was conducted regarding the different internal sources of error appearing during the whole modelling process. Climate scenario bias-correction methods and hydrological model uncertainties were represented using an ensemble method. Both sources of uncertainty appeared to have significant impacts on water availability projections. The combination of both sources of uncertainty gave an error reaching approximately 15%.
Considering the whole set of simulations, by combining the different climate scenarios provided by AEMET and SMC with the ensembles resulting from the uncertainty analysis, the water availability projections varied significantly (an average annual WA ranging from 147 hm3/year to 274 hm3/year). The large spectrum of results, from maintaining the current situation to a very pessimistic scenario (WA divided by 2) in which the drought periods are doubled, complicates their use in terms of decision making.
These interesting results provided by the chosen modelling approach were based on a number of implicit hypotheses and limitations:
Climate model downscaled scenarios: As suggested by Ehret et al. (Citation2012), some precautions were taken to apply bias correction in the production of downscaled climate scenarios adapted to impact studies. First, a multimodel ensembles approach was adopted, as two different GCMs were used, including a nested approach (use of RCM to downscale GCM output, MM5). Second, a monthly correction was performed to separate the impact of bias correction from downscaling procedure. Although bias correction does not represent the main source of uncertainty (regarding climate and hydrological models), some critical points still remain. For instance, the assumption that the correction parameters computed in the past period will remain the same for future periods is a questionable hypothesis and should be studied. The use of bias correction could be avoided if some significant improvements were made in climate projections from global and regional models, and also from downscaling methods. In particular, the explicit representation of convection (representing a key factor for precipitation in the Mediterranean area) should enhance model accuracy.
Hydrological model structure: Only uncertainty related to model parameterization was considered in this study. It was assumed that the HBV model was able to reproduce correctly present and future water processes in the Llobregat basin. As this was indeed true regarding past data (HBV has already been used in other studies on this site; see Velasco et al. Citation2013), and satisfactory results were obtained regarding water availability on past data, it may not be the case in the future. As mentioned by Teng et al. (Citation2012), hydrological modelling results could be different if potential changes in the climate–runoff relationship and land–vegetation–atmosphere feedback were modelled. As it was assumed that land use in the Llobregat contributor basins will not be modified in the future (Cabello et al. Citation2011), a conceptual model was chosen. As Jones et al. (Citation2006) suggested, conceptual and physically-based models have different roles in impact assessment: the former can be used to rapidly assess the impact of different climate scenarios, while the latter can assess the joint impacts of land use and climate change. Nevertheless, the approach used to simulate evapotranspiration (here the Thornthwaite formulation) could be greatly influenced by a changing climate and thus be an additional source of uncertainty. Consequently, as low-flow simulation is an important challenge and needs to be improved, it could be interesting to use an additional hydrological model in the future to compare its results to those obtained with the HBV model.
Despite the limitations mentioned above, this study supports some interesting elements of water resources management. Awareness of the possible impacts of future changes could help stakeholders in defining more resilient measures, and therefore avoiding or minimizing adverse social, economic and environmental consequences. If these projections are not accurate enough to justify investment in important infrastructure, they could at least help in anticipating and implementing small permanent measures (modernization of irrigation, construction of water reclamation plants, rules for sustainable construction, etc.) or punctual measures (awareness-raising campaigns, reduction of non-essential uses, improved interlinking of water networks, potential water markets, point operation of desalination plants, etc.).
When developing sustainable long-term planning of water resources in the direction that the Water Framework Directive specifies, it becomes necessary to consider Global Change. This was one of the objectives of the WATER CHANGE project, combining climate change with other human-related changes. It aimed to develop a methodology and a tool to assess the Global Change impacts on water resources, thus helping river basin agencies and water companies in their long-term planning and in the definition of adaptation measures. The outcomes of this project enabled the definition and testing of different sets of adaptation measures for the basin, which can be further evaluated through cost-benefit analysis. The integration of the results contributes to efficient decision making on how to adapt to Global Change impacts.
Disclosure statement
No potential conflict of interest was reported by the authors.
Notes
Related Research Data
References
- AEMET, 2008. Generación de escenarios regionalizados de cambio climático para España. Madrid: Agencia Española de Meteorología.
- Akhtar, M., Ahmad, N., and Booij, M.J., 2008. The impact of climate change on the water resources of Hindukush-Karakorum-Himalaya region under different glacier coverage scenarios. Journal of Hydrology, 355 (1–4), 148–163. doi:10.1016/j.jhydrol.2008.03.015
- Arozarena Villar, A., et al., 2006. Mapa de Ocupación del Suelo en España. Corine Land Cover-Proyecto I&CLC2000. Spain: Centro Nacional de Información Geográfica.
- Barrera-Escoda, A., and Cunillera, J., 2011. Climate change projections for Catalonia (NE Iberian Peninsula). Part I: Regional climate modeling, Tethys, 8, 77–89.
- Barrera-Escoda, A. and Cunillera, J., 2010b. Study of the precipitation evolution in Catalonia using a mesoscale model (1971–2000). Advances in Geosciences, 26, 1–6. doi:10.5194/adgeo-26-1-2010
- Barrera-Escoda, A. and Cunillera, J., 2011. Climate change projections for Catalonia (NE Iberian Peninsula). Part I: regional climate modeling. Tethys Journal of Mediterranean Meteorology and Climatology, 8, 75–87. doi:10.3369/tethys.2011.8.08
- Bastola, S., Murphy, C., and Sweeney, J., 2011. The role of hydrological modelling uncertainties in climate change impact assessments of Irish river catchments. Advances in Water Resources, 34 (5), 562–576. doi:10.1016/j.advwatres.2011.01.008
- Bergström, S., 1992. The HBV model - its structure and applications. Report Hydrology no. 4. Norrköping: SMHI.
- Beven, K. and Binley, A., 1992. The future of distributed models: model calibration and uncertainty prediction. Hydrological Processes, 6 (3), 279–298. doi:10.1002/(ISSN)1099-1085
- Boé, J., et al., 2009. Projected changes in components of the hydrological cycle in French river basins during the 21st century. Water Resources Researcher, 45, 1–15. doi:10.1029/2008WR007437
- Bonaccorso, B., et al., 2003. Spatial variability of drought: an analysis of the SPI in Sicily. Water Resources Management, 17 (4), 273–296. doi:10.1023/A:1024716530289
- Brekke, L.D., et al., 2009. Climate change and water resources management - a federal perspective. U.S. Geological Survey, 76 pp.
- Brunet, M., et al., 2007. Generación de escenarios regionalizados de cambio climático para España. Madrid, Spain: Agencia Estatal de Meteorología (AEMET).
- Cabello, A., et al., 2011. Assessment of future scenarios of climate and land-use changes in the IMPRINTS test-bed areas. Environmental Science & Policy, 14 (7), 884–897. doi:10.1016/j.envsci.2011.03.003
- Cudennec, C., Leduc, C., and Koutsoyiannis, D., 2007. Dryland hydrology in Mediterranean regions - a review. Hydrological Sciences Journal, 52 (6), 1077–1087. doi:10.1623/hysj.52.6.1077
- de Jong, C., Lawler, D., and Essery, R., 2009. Mountain hydroclimatology and snow seasonality - perspectives on climate impacts, snow seasonality and hydrological change in mountain environments. Hydrological Processes, 23 (7), 955–961. doi:10.1002/hyp.v23:7
- Déqué, M., 2007. Frequency of precipitation and temperature extremes over France in an anthropogenic scenario: model results and statistical correction according to observed values. Global Planet Change, 57, 16–26. doi:10.1016/j.gloplacha.2006.11.030
- Ducharne, A., et al., 2010. Climate change impacts on water resources and hydrological extremes in northern France. In: J. Carrera, ed. Paper presented at the XVIII international conference on water resources, CMWR 2010, 21–24 June 2010 Barcelona.
- Ehret, U., et al., 2012. Should we apply bias correction to global and regional climate model data? Hydrology and Earth System Sciences, 16 (9), 3391–3404. doi:10.5194/hess-16-3391-2012
- Foley, A.M., 2010. Uncertainty in regional climate modelling: a review. Progress in Physical Geography, 34, 647–670. doi:10.1177/0309133310375654
- Garcia-Ruiz, J.M., et al., 2011. Mediterranean water resources in a global change scenario. Earth-Science Reviews, 105 (3–4), 121–139. doi:10.1016/j.earscirev.2011.01.006
- Gaume, E., et al., 2009. A compilation of data on European flash floods. Journal of Hydrology, 367 (1–2), 70–78. doi:10.1016/j.jhydrol.2008.12.028
- Giorgi, F. and Lionello, P., 2008. Climate change projections for the Mediterranean region. Global and Planetary Change, 63 (2–3), 90–104. doi:10.1016/j.gloplacha.2007.09.005
- Gosling, S.N., et al., 2011. A comparative analysis of projected impacts of climate change on river runoff from global and catchment-scale hydrological models. Hydrology and Earth Systems Sciences, 15, 279–294. doi:10.5194/hess-15-279-2011
- Gutmann, E.D., et al., 2012. A comparison of statistical and dynamical downscaling of winter precipitation over complex terrain. Journal of Climate, 25 (1), 262–281. doi:10.1175/2011jcli4109.1
- Hallegatte, S.P., 2009. Strategies to adapt to an uncertain climate change. Global Environmental Change, 19 (2), 240–247. doi:10.1016/j.gloenvcha.2008.12.003
- Ibanez, C. and Prat, N., 2003. The environmental impact of the Spanish national hydrological plan on the lower Ebro river and delta. International Journal of Water Resources Development, 19 (3), 485–500. doi:10.1080/0790062032000122934
- IPCC, 2014. Climate change 2014: synthesis report. Contribution of working groups I, II and III to the fifth assessment report of the intergovernmental panel on climate change [Core Writing Team, R.K. Pachauri and L.A. Meyer (eds.)]. Geneva, Switzerland: IPCC, 151 pp
- Jiang, T., et al., 2007. Comparison of hydrological impacts of climate change simulated by six hydrological models in the Dongjiang Basin, South China. Journal of Hydrology, 336 (3–4), 316–333. doi:10.1016/j.jhydrol.2007.01.010
- Jin, X., et al., 2009. Regionalization study of a conceptual hydrological model in Dongjiang basin, south China. Quaternary International, 208 (1–2), 129–137. doi:10.1016/j.quaint.2008.08.006
- Johnson, F. and Sharma, A., 2012. A nesting model for bias correction of variability at multiple time scales in general circulation model precipitation simulations. Water Resources Researcher, 48. doi:10.1029/2011WR010464
- Jones, R.N., et al., 2006. Estimating the sensitivity of mean annual runoff to climate change using selected hydrological models. Advances in Water Resources, 29, 1419–142. doi:10.1016/j.advwatres.2005.11.001
- Kay, A.L., et al., 2009. Comparison of uncertainty sources for climate change impacts: flood frequency in England. Climatic Change, 92 (1–2), 41–63. doi:10.1007/s10584-008-9471-4
- Kleme, V., 1986. Operational testing of hydrological simulation models. Hydrological Sciences Journal, 31 (1), 13–24.
- Kuczera, G., et al., 2006. Towards a Bayesian total error analysis of conceptual rainfall-runoff models: characterising model error using storm-dependent parameters. Journal of Hydrology, 331 (1–2), 161–177. doi:10.1016/j.jhydrol.2006.05.010
- Leander, R. and Buishand, T.A., 2007. Resampling of regional climate model output for the simulation of extreme river flows. Journal of Hydrology, 332 (3–4), 487–496. doi:10.1016/j.jhydrol.2006.08.006
- Lenderink, G., Buishand, A., and Van Deursen, W., 2007. Estimates of future discharges of the river Rhine using two scenario methodologies: direct versus delta approach. Hydrology and Earth System Sciences, 11 (3), 1145–1159. doi:10.5194/hess-11-1145-2007
- Lidén, R. and Harlin, J., 2000. Analysis of conceptual rainfall-runoff modelling performance in different climates. Journal of Hydrology, 238 (3–4), 231–247. doi:10.1016/S0022-1694(00)00330-9
- Lopez-Moreno, J.I., 2008. Estimacion de perdidas de agua por evaporacion en embalses del Pirineo. Cuadernos de Investigacion Geografica, 34, 61–81. doi:10.18172/cig.1207
- Maraun, D., et al., 2010. Precipitation downscaling under climate change: recent developments to bridge the gap between dynamical models and the end user. Reviews Geophysics, 48. doi:10.1029/2009RG000314
- Matott, L.S. and Purucker, B.J., 2009. Evaluating uncertainty in integrated environmental models: a review of concepts and tools. Water Resources Research, 45, W06421. doi:10.1029/2008WR007301
- Mauser, W., and Bach, H., 2009. PROMET – Large scale distributed hydrological modelling to study the impact of climate change on the water flows of mountain watersheds. Journal of Hydrology, 376, 362–377.
- Merritt, W.S., et al., 2006. Hydrologic response to scenarios of climate change in sub watersheds of the Okanagan basin, British Columbia. Journal of Hydrology, 326 (1–4), 79–108. doi:10.1016/j.jhydrol.2005.10.025
- Morán-Tejeda, E., Ceballos-Barbancho, A., and Llorente-Pinto, J.M., 2010. Hydrological response of Mediterranean headwaters to climate oscillations and land-cover changes: the mountains of Duero River basin (Central Spain). Global and Planetary Change, 72, 39–49. doi:10.1016/j.gloplacha.2010.03.003
- Muerth, M.J., et al., 2013. On the need for bias correction in regional climate scenarios to assess climate change impacts on river runoff. Hydrology and Earth System Sciences, 17, 1189–1204. doi:10.5194/hess-17-1189-2013
- Nakicenovic, N., et al., 2000. IPCC Special report on emissions scenarios. WMO-UNEP, 27 pp. ISBN: 92-9169-113-5.
- Nash, J.E. and Sutcliffe, J.V., 1970. River flow forecasting through conceptual models part I - A discussion of principles. Journal of Hydrology, 10 (3), 282–290. doi:10.1016/0022-1694(70)90255-6
- Nicault, A., et al., 2008. Mediterranean drought fluctuation during the last 500 years based on tree-ring data. Climate Dynamics, 31 (2–3), 227–245. doi:10.1007/s00382-007-0349-3
- Piccarreta, M., Capolongo, D., and Boenzi, F., 2004. Trend analysis of precipitation and drought in Basilicata from 1923 to 2000 within a southern Italy context. International Journal of Climatology, 24 (7), 907–922. doi:10.1002/(ISSN)1097-0088
- Poulin, A., et al., 2011. Uncertainty of hydrological modelling in climate change impact studies in a Canadian, snow-dominated river basin. Journal of Hydrology, 409, 626–636. doi:10.1016/j.jhydrol.2011.08.057
- Prudhomme, C. and Davies, H.N., 2008. Assessing uncertainties in climate change impact analyses on the river flow regimes in the UK. Part 2: future climate. Climatic Change, 93, 197–222. doi:10.1007/s10584-008-9461-6
- Prudhomme, C., et al., 2010. Scenario neutral approach to climate change impact studies: application to flood risk. Journal of Hydrology, 390, 198–209. doi:10.1016/j.jhydrol.2010.06.043
- Schnorbus, M., Werner, A., and Bennett, K., 2014. Impacts of climate change in three hydrologic regimes in British Columbia, Canada. Hydrological Processes, 28 (3), 1170–1189. doi:10.1002/hyp.v28.3
- Seiller, G. and Anctil, F., 2014. Climate change impacts on the hydrologic regime of a Canadian river: comparing uncertainties arising from climate natural variability and lumped hydrological model structures. Hydrology and Earth System Sciences, 18, 2033–2047. doi:10.5194/hess-18-2033-2014
- Senatore, A., et al., 2011. Regional climate change projections and hydrological impact analysis for a Mediterranean basin in Southern Italy. Journal of Hydrology, 399 (1–2), 70–92. doi:10.1016/j.jhydrol.2010.12.035
- Steele-Dunne, S., et al., 2008. The impacts of climate change on hydrology in Ireland. Journal of Hydrology, 356 (1–2), 28–45. doi:10.1016/j.jhydrol.2008.03.025
- Teng, J., et al., 2012. Estimating the relative uncertainties sourced from GCMs and hydrological models in modeling climate change impact on runoff. Journal of Hydrometeorology, 13 (1), 122–139. doi:10.1175/JHM-D-11-058.1
- van Dam, J.C., 1999. Impacts of climatechange and climate variability on hydrological regimes. Cambridge (UK): Cambridge University Press, 160 pp.
- Vaze, J., et al., 2010. Climate nonstationarity – validity of calibrated rainfall-runoff models for use in climate change studies. Journal of Hydrology, 394, 447–457. doi:10.1016/j.jhydrol.2010.09.018
- Velasco, M., et al., 2013. Assessment of flash floods taking into account climate change scenarios in the Llobregat River basin. Natural Hazards Earth Systems Sciences, 13, 3145–3156. doi:10.5194/nhess-13-3145-2013
- Velázquez, J.-A., et al., 2013. An ensemble approach to assess hydrological models’ contribution to uncertainties in the analysis of climate change impact on water resources. Hydrol Earth Systems Sciences, 17 (2), 565–578. doi:10.5194/hess-17-565-2013
- Versini, P.-A., Berrenguer, M., Sempere-Torres, D., 2012. Reconstruction of historical precipitation based on radar fields: application on Catalonia region (Spain). In: EGU Conference, 22–27 April 2012 Vienne.
- Vicente-Serrano, S.M., 2006. Spatial and temporal analysis of droughts in the Iberian Peninsula (1910–2000). Hydrological Sciences Journal, 51 (1), 83–97. doi:10.1623/hysj.51.1.83
- Viviroli, D. and Weingartner, R., 2004. The hydrological significance of mountains: from regional to global scale. Hydrology and Earth System Sciences, 8 (6), 1017–1030. doi:10.5194/hess-8-1017-2004
- Vrugt, J.A., et al., 2003. A shuffled complex evolution metropolis algorithm for optimization and uncertainty assessment of hydrologic model parameters. Water Resources Research, 39 (8), 1201. doi:10.1029/2002wr001642
- Wilby, R.L. and Dessai, S., 2010. Robust adaptation to climate change. Weather, 65 (7), 180–185. doi:10.1002/wea.v65:7
- Wilby, R.L. and Harris, I., 2006. A framework for assessing uncertainties in climate change impacts: low-flow scenarios for the River Thames, UK. Water Resources Research, 42 (2), W02419. doi:10.1029/2005wr004065
- Wilby, R.L., et al., 2006. Integrated modelling of climate change impacts on water resources and quality in a lowland catchment: river Kennet, UK. Journal of Hydrology, 330, 204–220. doi:10.1016/j.jhydrol.2006.04.033
- Younis, J., Anquetin, S., and Thielen, J., 2008. The benefit of high-resolution operational weather forecasts for flash-flood warning. Hydrology and Earth System Sciences Discussions, 5, 345–377. doi:10.5194/hessd-5-345-2008
- Zhang, X. and Lindström, G., 1997. Development of an automatic calibration scheme for the HBV hydrological model. Hydrological Processes, 11 (12), 1671–1682. doi:10.1002/(ISSN)1099-1085