
ABSTRACT
Groundwater is used by 3 million inhabitants in the coastal urban city of Douala, Cameroon, but comprehensive data are too sparse for it to be managed in a sustainable manner. Hence this study aimed to (1) assess the potability of the groundwater; (2) evaluate the spatial variation of groundwater composition; and (3) assess the interaction and recharge mechanisms of different water bodies. Hydrogeochemical tools and methods revealed the following results in the Wouri and Nkappa formations of the Douala basin, which is beneath Douala city: 30% of water samples from hand-dug wells in the shallow Pleistocene alluvium aquifer were saline and highly mineralized. However, water from boreholes in the deeper (49–92 m depth) Palaeocene aquifer was saline-free, less mineralized and potable. Water in the shallow aquifer (0.5–22 m depth) was of Na+-K+-Cl−-NO3− type and not potable due to point source pollution, whereas Ca+-HCO3− unpolluted water dominates in the deeper aquifer. Water in the deep and shallow aquifers indicates the results of preferential flow pass and evaporative recharge, respectively. Possible hydrogeochemical processes include point source pollution, reverse ion exchange, remote recharge areas and mixing of waters with different chemical signatures.
EDITOR D. Koutsoyiannis ASSOCIATE EDITOR M.D. Fidelibus
1 Introduction
1.1 Background and objectives
In developing countries, cities that are located along the coast are subject to rapid industrialization, fast population growth and intense human activities. In the coastal city of Douala, Cameroon (), those activities affect the quality and quantity of pristine freshwater resources in shallow wells (sealed and unsealed hand-dug wells with depth to water of 0.5–22 m), boreholes (drilled, sealed, pumped wells with historical records that show depth to water level values of 45–92 m) springs, rainfall and rivers, all of which are commonly exploited for various domestic, agricultural and industrial uses (e.g. Don Citation1998). The high demand for freshwater sources, and the fast depletion and deterioration of surface water quantity and quality, respectively, have resulted in tremendous pressure on groundwater resources, which remain an alternative source of water for human needs. As stated by Sun et al. (Citation1989), “Unlike the energy crisis, water crisis is life threatening. Unlike oil, freshwater has no viable substitute. Its depletion in quantity and quality has profound socio-economic and ecological effects. Without water, ecosystems are destroyed, economic activities halt and people die.” To secure availability and sustainable management of groundwater resources, it is imperative to document and disseminate current comprehensive information on the resources. Such information provides frontline understanding in time and space on the following concepts: modelling of groundwater (e.g. Bredehoeff Citation2005) on a regional scale (e.g. Fisher Citation2005); factors that control the groundwater chemistry to support appropriate decision making (e.g. Hancock et al. Citation2005, Fantong et al. Citation2010); freshwater−saline water−effluent interaction in coastal cities (e.g. Post Citation2005); description of aquifer lithology (e.g. de Marsily et al. Citation2005); use of hydrogeochemical graphs such as Stiff and Piper diagrams (e.g. Glynn and Plummer Citation2005); delta space (e.g. Craig Citation1961); microbial content (e.g. Godfrey and Smith Citation2005); elucidation of evolution in groundwater quality; tracing of groundwater origin and flow (e.g. Ako et al. Citation2013, Scalon et al. Citation2006, Fantong et al. Citation2009); and assessment of hydrobiological characteristics.
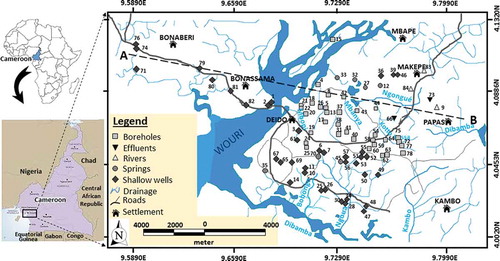
Figure 1. Location of study area in Cameroon. Sample collection sites and the river flow system are also shown. The line A−B is the transect along which boreholes were selected to construct vertical schematic lithology sections in the formations (Wouri, Matanda, Souelaba, and Nkappa) drilled for water exploitation.
To date, efforts have been made to assess the aforementioned concepts in the coastal city of Douala (), which is constructed on the Douala coastal sedimentary basin (e.g. Dumort Citation1968), as reported in the following studies: controls on groundwater chemistry in the northeastern part of Douala city (Eneke et al. Citation2010, Citation2011, Citation2015); water supply, sanitation and health risks in the southeast of Douala (Ndjama et al. Citation2008); occurrence of water-borne diseases in the Douala 4th District (Ako et al. Citation2009); bacterial indicators of pollution of the Douala Lagoon (Akoachere et al. Citation2008); hydrogeological determinants of the complex aquifer system in the Douala sedimentary basin (Ketchemen Citation2011); and stable environmental isotope ratio in rainwater of Douala (IAEA Citation2007, Ketchemen Citation2011). However, the results from these studies still leave the following research gaps: (a) the data generated are limited in space; (b) the variation in lithology of the multi-aquifer system that is exploited for domestic, agricultural and industrial uses remains unknown; (c) the distribution of water type (facies) based on variation of aquifer depth is totally absent; and (d) so far, no comprehensive data have been published in the study area on the application of stable environmental isotopes to elucidate the groundwater origin and evolution. Such knowledge gaps may contribute to the incomprehensible characteristics of groundwater resources in space and time, thus rendering every effort to manage the water resources difficult. The difficulty in managing the resources is reflected in the frequent occurrence of water-related problems, such as water-borne diseases, water pollution and flooding (Global Water Partnership Citation2009).
Accordingly, this study uses physico-chemical parameters, such as major ion concentrations, stable environmental isotopes of oxygen and hydrogen, and litho logs to (1) assess the suitability of groundwater resources for drinking within the entire coastal city of Douala; (2) evaluate the distribution of groundwater facies based on the shallow and deep aquifer(s) that are bored by shallow hand-dug wells and boreholes, respectively; (3) elucidate the interaction between water from boreholes, shallow wells, seawater, springs, rivers and rainfall in the coastal city of Douala; and (4) identify groundwater recharge mechanisms.
2 Environmental setting
2.1 Location, drainage, relief and climate of the study area
Douala is a coastal megacity that covers a surface area of 286 km2, which extends across 03°59′49″−04°05′30″N latitude and 09°35′26″−09°46′39″E longitude (as shown in ). The rivers that flow through the city are the Mbanya, Kotto Bassa, Mbopi, Bobongo, Ngoua, Kambo and Ngongué. The Mbanya, Kotto Bassa, Mbopi and Ngongué rivers flow into the Wouri River, while the Ngoua, Bobongo and Kambo rivers flow into the Dibamba River. Due to the relief, which varies monotonously from the highest point of c. 100 m a.s.l. in the northeast to the lowest point of c. 3 m a.s.l. in the west, both the Wouri and the Dibamba dendritic drainage basins discharge water into the Atlantic Ocean. The climatic regime is bimodal with a dry season for about 6 months (October−March), and a rainy season that also lasts for 6 months (April−September). During the dry season, the Harmattan wind blows from the Sahara in the north, causing low humidity and high atmospheric temperatures; while in the rainy season, moisture-laden winds that blow from the Gulf of Guinea in the south bring high humidity and rain that sometimes generates floods. Furthermore, during high tides, the Dibamba and Wouri rivers that flow into the ocean are vulnerable to bank overflow and seawater intrusion; while at low tides, the upstream channels of those rivers run dry. Thirty years (1980−2011) of meteorological data from the national archive in Douala show that during the rainy season the average annual rainfall in the study area is 4000 mm/year, and the average monthly temperature is 33°C (Ketchemen Citation2011).
2.2 Geological and hydrogeological settings
2.2.1 Geology
The city of Douala is constructed on a 5 km-thick sequence of unconsolidated to semi-consolidated sedimentary rocks that range in age from Pleistocene (the Wouri Formation) to Aptian (the Moundeck Formation) (Regnoult Citation1986). To the west are the Atlantic Ocean and Mount Cameroon, and to the south and north are outcrops of the Precambrian granitic basement, which is succeeded unconformably by Cretaceous sediments that lie beneath a much younger Tertiary sediment (). Based on lithological units, the vertical successions from the youngest to the oldest were renamed as the Wouri, Matanda, Souellaba, Nkappa, Logbaba and Moundeck formations (). The youngest formation (Wouri) comprises coarse-grained sand and gravel that intercalate with clay. The sand-sized sediments are angular in shape and show cross-bedding structures, which intercalate with ferruginous clay. In addition, exposures of “hard pan” (lateritic surfaces), which indicate a continental environment, are common. In the Wouri Formation, the dominant minerals are quartz and clay, with subordinate indices of ilmenite, magnetite, muscovite, hypersthenes, sillimanite, epidote and sphene (Regnoult Citation1986).
Figure 2. Spatial variation in geological formations in the study area.
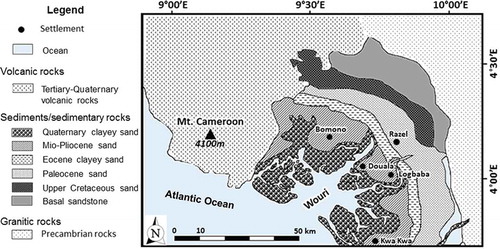
Figure 3. (a) Vertical variation in lithology showing the incidence of aquiferous units in the sedimentary basin of Douala. (b) Vertical variation of epochs in the Douala basin, showing vertical displacement and variation in lithological thickness across the fault plane. The lithology of each epoch is defined in (a).
The Matanda Formation is made up of cross-bedded Lower Miocene shale that is succeeded by coarse-grained Upper Miocene sand. The sand intercalates with Tertiary basaltic rocks that represent some of the Mount Cameroon lava flows (). The Souellaba Formation is characterized by marls, sandy shale, calcareous sandstone and ferruginous limestone, while the lithologies of the Nkappa Formation consist of shales that are rich in channel-filled sand. At the base of the Nkappa Formation are conglomerates, which are succeeded by cross-bedded sandstones. The Logbaba Formation is essentially made up of shale that intercalates with gravelly sand and fossiliferous limestone. The oldest formation (Moundeck) is Albo-Aptian in age and varies from top to bottom in transgressive continental shale through medium sized sand, and finally to basal conglomerate that lies unconformably on the Precambrian crystalline basement. It is worth mentioning here that in Regnoult (Citation1986) the lithological stratification that is shown on has no vertical scale, but shows that the thickness of sediments in the Douala basin is about 5 km, and the stratigraphy of the formations is displaced by a fault that caused uplift in the northeast and downthrow in the southwest. The vertical displacements caused by the epochs of Pleistocene, Mio-Pliocene, Oligocene, Eocene and Palaeocene correspond to the Wouri, Matanda, Souelaba and Nkappa formations, respectively, reducing in thickness from approx. 3 km in the southwest to less than 1 km in the northeast.
2.2.2 Hydrogeology
Regnoult (Citation1986) reports that the Douala basin () is made up of four principal aquifers: the Pleistocene and Pliocene alluvia of the Wouri Formation, the Palaeocene sand of the Nkappa Formation, and the Cretaceous basal sandstone of the Moundeck Formation.
The shallow aquifers of the Pleistocene and Pliocene alluvia are the most exploited (about 13 000 m3/day) for domestic uses (Mafany Citation1999). During high tides, brackish water from the Wouri estuary intrudes into the immature Pleistocene and Pliocene alluvia (Mafany Citation1999), which in this study correspond to the shallow aquifer that is exploited by either open or sealed hand-dug wells. These shallow aquifers, whose water turns brackish and saline during high tides, are exploited for domestic uses through hand-dug wells. In contrast, the Palaeocene sand of the Nkappa Formation corresponds to the deep aquifer that is exploited for both domestic and industrial uses through boreholes. This aquifer is thought to be free from seawater intrusion because it is capped by impermeable marine shale. The oldest aquiferous formation within the study area is the permeable basal sandstone of the Moundeck Formation, which has high yields of groundwater wherever it outcrops. Out of the four aquiferous formations, three (Pleistocene alluvium, Pliocene alluvium and Palaeocene sand) were sampled where the city of Douala is constructed (i.e. the northeastern part of the Douala basin). The Douala sedimentary basin has the following hydrogeological characteristics: the static level of water in the shallow aquifer fluctuates between 2 and 22 m a.s.l., with some areas showing drops in water level from 4 to 16 m, as a result of over-exploitation; in the boreholes, saturated aquifer thickness varies from 8 to 24 m, the storage coefficient varies from 2.4 × 10⁻⁵ to 7.4 × 10⁻⁵ m−1, transmissivity ranges from 1.1 × 10⁻² to 2 × 10⁻³ m2/s, hydraulic conductivity changes from 1.1 × 10⁻⁴ to 1 × 10⁻³ m/s, and specific yield from 2.2 to 4.9. It is worth noting that, for the boreholes, data on the hydraulic heads were obtained from historical records of drillings for water wells: the wells were cased within the upper sandy layers of the Wouri Formation (Pleistocene and Pliocene alluvia) and screened within the lower Palaeocene sandy horizon of the Nkappa Formation.
The groundwater flow regime is multidirectional from southeast to northwest, northwest to west and from northeast to southwest (Mafany Citation1999). In the northern part of the study area, the average groundwater level in the shallow wells fluctuates between 0.3 and 2.1 m in the wet and the dry seasons, respectively (Eneke et al. Citation2010).
3 Method of study
3.1 Field work and sampling
Prior to the sampling campaign, 1:25 000 topographic and land-use maps of Douala were used to select sample collection sites for random sampling, and the geographical locations of the selected sites were predetermined with the use of GoogleEarthTM. The sampling campaign took place in August 2011, when 83 water samples were randomly collected. Of the 83 samples, 37 were from open wells (unsealed shallow hand-dug wells) within the shallow aquifer, 33 were from sealed wells that tap from the shallow aquifer (shallow hand-dug wells that are sealed and water is exploited by a manual pump) and the deeper aquifer via boreholes (drilled wells that ranged in depth from 45 to 100 m for water exploitation that are sealed and have water pumping facilities), 3 from streams, 3 from industrial effluent (which is discharged from soap, brewery and paint producing plants that dispose of their liquid waste indiscriminately in their neighbourhoods), and 7 from local springs. All the samples were collected from both the shallow aquifer that constitutes the Pleistocene and Pliocene alluvia (Wouri Formation) and the deeper aquifer that constitutes the Palaeocene sand (Nkappa Formation). The boreholes were sunk through non-aquiferous horizons of the Matanda and Souellaba formations before tapping water from the Palaeocene sand of the Nkappa Formation. The geographical locations and altitudes of the selected sample sites shown in were obtained in the field using a Garmin Vista CX GPS. During the sampling exercise, water was drawn from the open hand-dug wells using buckets tied with ropes, while sealed wells and boreholes were pumped for 5−15 min before sampling. Water samples from streams were collected from depths of approx. 15 cm at points that were away from the banks of the streams. Local springs were sampled at oozing points (which are discharge areas of the springs), and industrial effluents were collected from gutters that channel the effluent from industries to the surrounding vicinity. At each sampling site, the water to be sampled was initially collected in a bucket (collector) that was thoroughly rinsed. After that, four plastic bottles of 100 mL capacity each were rinsed three times with water from the source to be sampled and filled up. Out of the four samples, the one that contained water samples for isotope (18O, 2H) analysis was sealed tightly to avoid evaporation that could cause evaporative enrichment of the isotope prior to analysis. Drops of nitric acid (HNO3) were added to another bottle containing water samples for major cation (Na+, K+ Ca2+, Mg2+) analysis. The third bottle contained non-acidified water and was used for major anion (Cl−, SO42−, NO3−) analysis, and the fourth bottle was filled with a sample (non-acidified) for alkalinity (HCO3−) measurement. Parameters such as temperature, electrical conductivity (EC) and pH were measured in situ using a portable electrical conductivity meter (pH/EC water proof HANNA, Dist 5), and a portable pH meter (Shindengen, ISFET pH meter KS723), respectively. The pH meter was calibrated with pH 4.0 and 6.8 buffer solutions. Dissolved oxygen (DO) was measured using a FUSO DO-5509 dissolved oxygen meter, and ambient temperature was measured using a custom CT-45° WR thermometer. Each sample was collected in the sample bottles after EC, pH and temperature values were stabilized at the water source. The water samples that were collected for analysis of the various parameters, except for alkalinity and stable environmental isotopes, were filtered through a 0.45 μm cellulose filter. At each sampling point, notes were taken on surrounding land use and on types of rock outcrops and exposures.
3.2 Laboratory analyses
By using the standard titration procedure (e.g. Fantong et al. Citation2009), the measurement of alkalinity for each water sample was performed within 8–10 h of sample collection in order to avoid oxidation of sulphides and ferrous ions, and precipitation of mineral phases.
From July to August 2012, laboratory analyses were done at the Laboratoire de Géochimie des Eaux (LAGE) of the Institute of Mining and Geological Research, Nkolbisson, Cameroon (IRGM-Nkolbisson). Major cations (Na+, K+, Ca2+ and Mg2+) were determined with non-suppressed ion chromatography (DIONEX, ICS 90). Major anions (Cl−, SO42− and NO3−) were analysed with suppressed ion chromatography (DIONEX, ICS-1100). To avoid blockage of the IC analytical column, all samples were filtered with a 0.2 μm cellulose filter.
Prior to analysis, the samples were diluted with deionized water and the dilution factor was determined based on the measured EC values (in µS/cm). Samples with EC > 200 were diluted 10 times, samples with EC between 100 and 199 were diluted 5 times, and samples with EC < 100 were not diluted. The dilution of a sample was performed when the EC exceeded the working capacity of the separation column chosen and also to minimize sample matrix effect.
The oxygen and hydrogen isotopic ratios of 34 samples (14 boreholes, 15 shallow wells, 3 springs and 2 rivers) that were collected in the rainy season (see ) were measured following the procedures described by Brand et al. (Citation2009) and Lis et al. (Citation2008) with a Picarro cavity ring-down spectrometer (CRDS, Model L2120-i). Before automatically running the queue, five vials of samples were arranged in between de-ionized water and standards (DOW, SLAP and VSMOW) supplied by the International Atomic Energy Agency (IAEA) via Picarro. Inter-laboratory calibration of our isotope results was done by using results from Lake Nyos water at 0 m that was collected in March 2012. The sample was analysed using the same Picarro-CRDS model at the laboratories of Tokai University, Japan, and IRGM-Nkolbisson. The results (in ‰ VSMOW) from the inter-laboratory analyses were as follows: from Tokai University: δ18O = –3.1, δD = –13.4, and from IRGM-Nkolbisson: δ18O = –3.0, δD = –13.6. The reproducibility of the isotope ratios from both laboratories indicates the reliability of the isotope data generated during this investigation. The obtained stable isotope ratios were given in the conventional delta expression (δ, ‰) relative to Vienna Standard Mean Ocean Water (VSMOW) and analytical precisions were ±1‰ for δD and ±1.5‰ for δ18O.
Table 1. Field and laboratory data for water sources that were sampled in the rainy season.
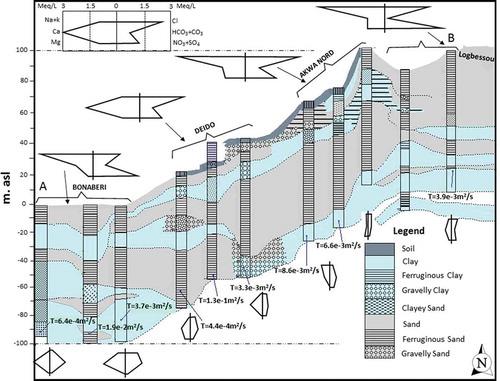
Given that all the samples were collected from the Wouri and Nkappa formations in the northeast of the Douala basin, historical information and lithological logs for the boreholes that were sampled within those formations were obtained from GEOFOR (a drilling company based in the Douala municipality). The boreholes that occurred along the A–B transect () were laterally correlated () to obtain spatial lithological variation and other hydrogeological information in the study area.
Figure 4. Vertical lithological section along the A−B transect (see ); Stiff diagrams refer to water sampled in the boreholes intercepted by the section. T: transmissivity.
4 Results and interpretation
4.1 EC, DO, pH and temperature
Chemical compositions and isotopic ratios of water samples from boreholes, industrial effluents, springs, shallow wells and rivers that were collected during the rainy season of the year 2011 are presented in . With the exception of the samples from industrial effluents, the reliability of the IC analytical technique for major ions was examined using the charge balance equation from measured cations and anions (Appelo and Postma Citation1993). The obtained values were in the range ±10%, as shown in . The values of physico-chemical parameters for world coastal rain (CR), river water (RW) and seawater (SS) and for the investigated samples are also shown in .
4.2 Chemical compositions and facies of water
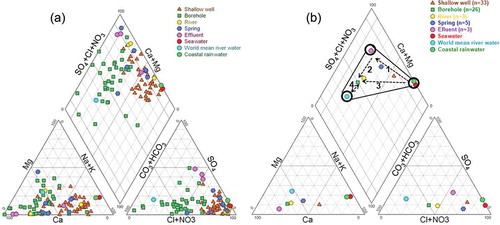
Stiff (hexa) diagrams, whose shapes and sizes were used to determine the facies of water and degree of mineralization, were drawn and distributed on the two-dimensional aquifer system shown in . The shape of the Stiff diagrams suggests that water in the shallow wells is rich in the cations Na+ and K+ and in the anions Cl− and NO3−, whereas water in the boreholes is rich in Ca+ and HCO3−. The size of the diagrams also indicates that water in the shallow wells is more mineralized than water in the boreholes. The variations in the shapes and sizes of the Stiff diagrams depend on water interaction processes and/or pollution factors that differently affect the study area. The chemistry of the observed water resources can also be determined using the Piper diagram (Piper Citation1944), as shown in . confirms the indications from the Stiff diagrams that the boreholes contain water that evolves between Ca-HCO3 and Ca+Mg-SO4 types, and that the shallow wells, rivers, springs and effluent waters evolve between Na+K-Cl and Ca+Mg-NO3 types. The mean chemical compositions of the global coastal rainwater, world river water and seawater are included for comparison. The comparison indicates that the mean values for water from the shallow aquifers in Douala are susceptible to enrichment by saline water and anthropogenic pollution as they plot close to the seawater and along the Ca+Mg-SO4+Cl zone (Appelo and Postma Citation1993). In contrast, water samples from the boreholes showed a freshwater signature as they plot towards the Ca-HCO3 zone, which also includes the world mean rivers. Plots of the mean values of chemical composition on the Piper diagram () suggest that the springs, shallow wells and boreholes represent ternary proportional mixtures from three end members, effluent, seawater and world mean river water (WMRW), as follows: (a) springs represent a mixture of about 40% seawater (saline water), 10% freshwater and 50% water from municipal discharge (effluents); (b) shallow wells represent a mixture of approx. 80% saline water, 10% freshwater and 10% water from industrial effluents; and (c) water in the boreholes represents a mixture of about 90% freshwater, 7% saline water and 3% water from industrial effluents.
Figure 5. (a) Piper diagram describing the chemical composition of water samples for shallow wells, boreholes, streams, local springs and effluent. Samples of seawater (Hem Citation1970), world mean river water (WMRW) and mean coastal rain water are also plotted for comparison. (b) Plots of mean concentrations (n: number of samples used to calculate mean) of major ions on the Piper diagram showing four evolution paths for water resources in the study area.
4.3 Hydrogen and oxygen isotope ratios
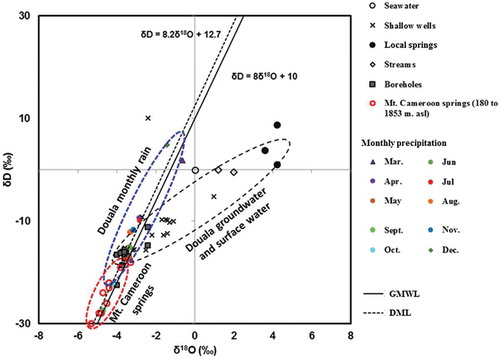
Hydrogen and oxygen isotope ratios in the sample waters are also shown in and graphically presented in . The δD values ranged from –22.5 to –11.2‰ in boreholes, –15.5 to –9.7‰ in shallow wells, 1.0–8.7‰ in springs, and –0.5 to 0.1‰ in streams. Oxygen isotope (δ18O) values ranged from –4.0 to –2.4‰ in boreholes, –3.6 to 0.9‰ in shallow wells, 3.6–4.2‰ in springs, and 1.21–2.0‰ in streams. The global meteoric water line (GMWL) of Craig (Citation1961), which is defined by the line δD = 8δ18O + 10, and the Douala meteoric water line (DML) of Ketchemen (Citation2011), which was established with four years (2006–2009 inclusive) of GNIP data and is defined by the line δD = 8.2δ18O + 12.7, are used as references. The distribution of isotope data from water resources in Douala (this study), monthly rainfall in Douala (Ketchemen Citation2011), and Mount Cameroon springs from 180 to 1853 m a.s.l. (Ako et al. Citation2013) are shown in delta space. The distribution of the data on suggests that water in boreholes that drain from the Palaeocene sand represents almost pristine rainwater with very little or no evaporation. Waters from the shallow aquifer of the Pleistocene and Pliocene alluvia rest on an evaporation line, which shows a trend that they are subject to evaporation compared to rainwater, but at a lower rate compared to river and local spring waters. Such a pattern suggests a hypothesis that the mechanism of preferential flow pass (e.g. Tsujimura et al. Citation2007, Asai et al. Citation2010) is the mechanism that recharges the water in the boreholes, while prior evaporation recharge occurs for water in shallow wells and springs (Edmunds et al. Citation2002a, Tsujimura et al. Citation2007, Fantong et al. Citation2010). The suggestion of the preferential flow pass hypothesis stems from the occurrence of effective porosity in the sand-rich sediment, which favours rapid infiltration of rainwater into the deeper aquifer in parts of the study area that are free of perched aquifers. The weighted monthly data of samples of rainwater from 2006 to 2009 in Douala plot close to and parallel with the GMWL and the DML. This indicates that the process of rain formation in Douala occurs under equilibrium conditions (Dansgaard Citation1964). The slopes also suggest that falling raindrops are not significantly affected by evaporation (Rozanski et al. Citation1993). The difference in d-intercepts of the GMWL and the DML may be attributed to changing conditions in the source of atmospheric moisture (e.g. Gonfiantini et al. Citation2001) and local climatic effects such as re-evaporation. The samples from the Mount Cameroon springs were more depleted in isotope values than those from the water resources in the low-lying Douala city. This pattern supports an effect of altitude (Ako et al. Citation2013), which has also been reported in northern Cameroon (Fantong et al. Citation2010), northwest Cameroon (Wirmvem et al. Citation2014) and in the Lake Nyos catchment, Cameroon (Kamtchueng et al. Citation2015).
Figure 6. Plot of selected observed water samples, weighted mean monthly rain, and Mount Cameroon springs (MCS) on the δD versus δ18O space. The data plotted are the global meteoric water line (GMWL) and the Douala meteoric line (DML). Sources of data for DML, MCS and seawater are Ketchemen (Citation2011), Ako et al. (Citation2013) and Hem (Citation1970), respectively.
5 Discussion
5.1 Source and spatial variation of major ions
The chemical composition of freshwater was used by Gibbs (Citation1970) to identify major geochemical sources and processes controlling dissolved ions in water based on their total dissolved solids (TDS) values and their Na+/(Na+ + Ca2+) ratios. The Gibbs diagram () shows data points for the sample sites distributed into two categories. The first category consists of sample water from boreholes and springs, which are circumscribed by a “boomerang” (). This suggests that incongruent weathering of silicate minerals (Faure Citation1991) is a dominant contributing source of dissolved inorganic ions by the process shown in the following reaction:
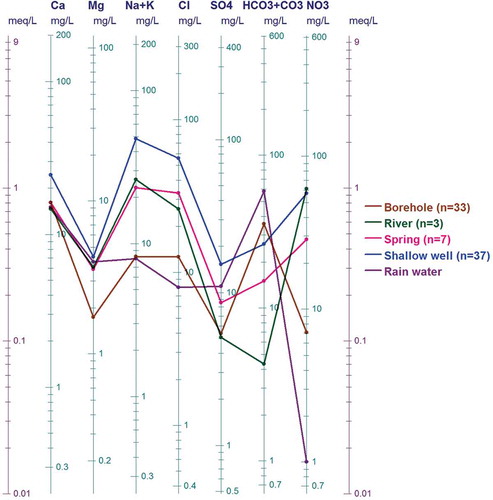
The second category is dominated by water samples from shallow wells, rivers and effluents that plot outside the “boomerang”. The processes that contribute to the occurrence of ions in the second category could be, among other factors, dominated by saline sources and anthropogenic input that increase the concentration of sodium. To verify the saline sources, a plot of the ratios of Cl/HCO3 versus Cl concentration (as employed in Korean coastal aquifers by e.g. Lee and Song Citation2006, and also by Todd Citation1980 and Revelle Citation1941, to identify the possibility of mixing between saline water and continental fresh groundwater) is also used in this study. The plot in indicates that 30% of water samples from shallow wells were slightly affected by saline water, with no effect on water in the boreholes. The logarithmic scale nomograph proposed by Schoeller (Citation1935) is a means of depicting a group of analyses that has the advantage of showing relationships between milligrams per litre and milliequivalents per litre for different ions. It also classes waters of similar composition as near parallel lines. The mean of data for the water observed in this study was plotted on such a nomograph () to compare, depict and confirm the differences in dissolved ions, salinity and TDS in the observed water sources. shows that, with the exception of HCO3−, the dissolved ion concentrations vary in descending order from shallow wells to rivers, local springs and boreholes, thus supporting the observation that saline water (salinity) might have affected shallow wells, rivers and springs more than boreholes, as seen in . Such a trend may be due to one or more of the following:
During high tides, seawater from the Atlantic Ocean flows inland through the channels of the Dibamba and Wouri rivers. The waters that flow within the channels and those that overflow their banks undergo lateral (bank) and vertical infiltration, respectively. These phenomena recharge the shallow permeable and unconfined Pleistocene sandy aquifer of the Wouri Formation as indicated by higher TDS in its water ().
Inhabitants of the city of Douala use chloride-rich detergent to disinfect water in open wells. Such a practice renders the shallow wells vulnerable to chloride (salinity) enrichment. These saline sources have no effect on the deeper (borehole) aquifer, which is protected by overlying clay beds.
Figure 7. (a) Plot of data from observed samples on a Gibbs diagram. (b) Plot of Cl/HCO3 ratios versus Cl concentrations showing that about 30% of the shallow wells are slightly affected by saline water; groundwater from boreholes does not show saline water influence.
Figure 8. Schoeller diagram showing that surface water (in shallow wells, springs and rivers) contains more dissolved ions than groundwater in the boreholes.
There are several possible explanations for the low mineralization of water in the deeper Palaeocene aquifer: (i) waters were recharged in a period characterized by a climate colder than the present one, as reported by Edmunds et al. (Citation2002a) in the Sahel zone of Africa; thus, such waters should be older than waters from shallow wells; (ii) waters from boreholes result from a preferential flow pass under conditions that favour the piston flow model, as reported by Tsujimura et al. (Citation2007), Asai et al. (Citation2010) and Fantong et al. (Citation2010) in Japan, Mongolia and northern Cameroon, respectively; (iii) the rate of water−rock interaction within the silica-rich aquifer is low; (iv) the boreholes draw water from an aquifer that has a recharge zone different from that of the shallow aquifer: a pollution-prone local recharge zone for the shallow aquifer and a pollution-free distant recharge zone for the deeper aquifer might explain the different concentrations of pollutants in the two aquifers as well; in this case, low to no mixing between these two layers could be expected; and (v) the observations may also be explained on the basis of hydraulics. As the deep part of the Nkappa Formation is mainly confined (clay bed, which separates the shallow and the deep parts) and takes recharge from other areas at higher elevations different from those that recharge the shallow part, groundwater circulating in the deep part (almost confined) may have higher hydraulic heads than shallow groundwater. This pushes filtration through clay beds from deeper parts to shallower parts. This may explain why, even with some probable breaks in the clay beds, groundwater in the deeper parts has low mineralization and it is not affected by percolation from the upper part of the system. These five processes need further investigation in the study area.
5.2 Anthropogenic pollution and potability of the water resources
Chemical parameters such as nitrate (NO3−), chloride (Cl−) and electrical conductivity (EC) have been employed to identify anthropogenic pollution of water (e.g. Edmunds et al. Citation2002b, Fantong et al. Citation2009). The observation that many samples from the shallow wells, streams and springs had Na:Cl ratios that were different from the seawater ratio of 0.86 (e.g. Andrew et al. Citation2004) suggests the occurrence of either ion exchange or pollution. The phenomenon of ion exchange occurs when more saline water is diluted by freshwater (e.g. Ghiglieri et al. Citation2009). To verify the occurrence of pollution, the concentrations (in meq/L) of Cl− versus NO3− were plotted for the observed samples, with the 1:1 line included for comparison (). From the distribution of points on the plot, four subgroups (a, c, d and e), i.e. with the exception of subgroup b, show various intensities of anthropogenic pollution. Subgroup a represents samples from boreholes showing very low concentrations in both parameters, thus an almost total absence of pollution. Subgroup c represents a proportion of samples from shallow wells with pollution that is caused by more chloride than nitrate. Subgroup d represents another proportion of samples from shallow wells, with pollution caused by an almost equal input of nitrate and chloride. Subgroup e represents a mixture of samples from springs and shallow wells, with pollution caused by more nitrate than chloride. It is worth noting that the effluent may constitute another group, which shows negligible variation in chloride, but remarkable variation in nitrate concentration. Those groupings further indicate that the variation of intensity of pollution in different water bodies in the city of Douala is as follows: (i) water in boreholes (tapping water from Palaeocene sand of the Nkappa Formation) is free of pollution by nitrate; (ii) the shallow wells (tapping water from the Pleistocene alluvium of the Wouri Formation) of groups b, c and d are subjected to pollution by chloride, which likely originates from the common practice of using chloride-rich detergent to disinfect water; and (iii) the waters in the shallow wells and from springs in subgroup e are polluted, as indicated by the high concentration and dominance of nitrate, which could be from the oxidation of NH4+ in municipal waste. The variation in chemical parameters of pollutants in the water bodies suggests that point sources may be the dominant origin of water pollution in Douala. Based on Fantong et al. (Citation2009, and references therein) maximum values of 45 mg/L (approx. 0.73 meq/L) for NO3− and 500 μS/cm for EC were used to qualify the suitability of water resources for drinking (). Based on the WHO guidelines, the plots in could be divided into four zones: Zone 1 constitutes plots of water sources (such as the shallow wells) that are unsuitable for drinking based on NO3− concentration; Zone 2, which is void of sample water plots, includes water bodies that are unsuitable based on both NO3− and EC; Zone 3, where almost all the borehole samples plot, together with some shallow well and spring samples, is suitable based on both NO3− and EC; and Zone 4 constitutes sources that are unsuitable based on EC values. The zoning of the different water sources is a succinct indication that more than 50% of the shallow wells, which are cheaper to construct and commonly used by the inhabitants of Douala, are not good sources of water for drinking. In contrast, the boreholes which are costly to construct are good sources of water for drinking. A similar observation has been reported in the nearby coastal aquifer of Calabar in Nigeria by Edet and Okereke (Citation2002). However, the findings of this study disagree with those of Eneke et al. (Citation2011), who reported that some shallow wells (four out of a total of 16), and all (four) boreholes in the northern portion of Douala city contain fresh and chloride-dominant water, respectively. Although the sample points in the northern part of Douala were resampled in this study, and sampling was carried out under the same seasonal (rainy season) conditions, the disagreement may arise from the possibility that, when the water sample collection for the earlier study was carried out, the four shallow wells were still located in a remote area with little or no settlement; furthermore, the four boreholes in that study might have been subjected to anti-bacterial treatment with a chlorinated product.
Figure 9. Chloride versus nitrate plot showing five subgroups (a, b, c d and e) of water pollution.
Figure 10. Bivariate plots of EC versus NO3 for investigated water bodies. The WHO (Citation1989) threshold of 45 mg/L NO3 and 500 μS/cm for EC showed four zones: Zone 1: unsuitable for drinking with respect to nitrate; Zone 2: unsuitable with respect to EC and nitrate; Zone 3: suitable for drinking; and Zone 4: unsuitable with respect to EC.
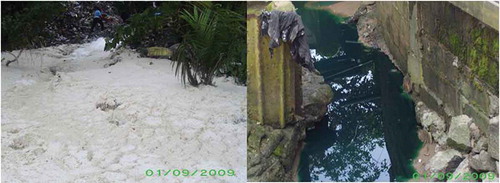
One possible reason for the poor quality of drinking water in the shallow wells is input from the poor disposal and management of industrial and/or municipal effluent in the city (). Based on the premise that point source pollution may be accountable for pollution of water resources in Douala, further investigation with the use of 15N and 18O isotope ratios (e.g. Meljevic Citation2003) to further identify the specific (point) sources of the anthropogenic pollution of water bodies is advocated for the city of Douala.
Figure 11. Discharge of effluent from soap- and paint-producing factories, which are possible sources of water pollution in shallow wells and streams (Photos taken by the authors in September 2010).
6 Conclusions and recommendations
Within the Wouri, Matanda, Souelaba and Nkappa formations in Douala, the aquifer architecture consists of multi-aquifer systems where single units show little or no interconnection and whose waters are intercepted by shallow wells in the shallow Pleistocene alluvium aquifer of the Wouri Formation and boreholes in the deep Palaeocene sandy aquifer of the Nkappa Formation. Facies of water resources in the boreholes were Ca-HCO3 to Ca+Mg-SO4 and Na+K-Cl to Ca+Mg-NO3 types in the shallow wells, with waters from the shallow aquifer showing more mineralization than those from the deeper aquifer. The processes that controlled the chemistry of water in the shallow aquifers were dominantly anthropogenic input, saline water contribution and a local recharge. While in the deep aquifer the processes were probably cation exchange, water–rock interaction, fast preferential flow pass, and a remote (distant) recharge zone, each of which remains a prospect for future investigation. Based on the concentration of NO3−, water from the deeper aquifer (boreholes) was found to be of better quality for drinking than that from the shallow aquifer (hand-dug wells). The absence of nitrates (or values up to 5 mg/L) in water from the boreholes (deeper aquifer) may indicate the natural background and the absence of a pollution source in the recharge zone. To reduce the vulnerability of the 3 million dwellers in Douala to water-borne diseases, more water from the deeper aquifer should be evenly distributed through boreholes.
Acknowledgements
We thank Dr Joseph V. Hell and the entire administrative machinery of the Institute for Mining and Geological Research (IRGM), Yaounde, for financial and logistical support during sampling. We thank all the technicians of the IRGM- Nkolbisson laboratory for their support during the analyses.
Disclosure statement
No potential conflict of interest was reported by the authors.
Additional information
Funding
References
- Ako, A.A., Nkeng, G.E., and Eneke, T.G.E., 2009, Water quality and occurrence of waterborne diseases in the Douala 4th District, Cameroon. Water Science and Technology, 59 (12), 2321–2329.
- Ako, A.A., et al., 2013. Flow dynamics and age of groundwater within a humid equatorial active volcano (Mount Cameroon) deduced by δD, δ18O, 3H and chlorofluorocarbons (CFCs). Journal of Hydrology, 502, 156–176. doi:10.1016/j.jhydrol.2013.08.032
- Akoachere, J.F.T.K., et al., 2008, Bacterial indicators of pollution of the douala logoon, cameroon:public health implications. African Health Science, 8 (2), 85–89.
- Andrew, J.E., et al., 2004. An introduction to environmental chemistry. 2 nd edn. Oxford: Blackwell Publishing, p. 296.
- Appelo, C.A.J. and Postma, D., 1993. Geochemistry, groundwater, and pollution. Rotterdam: Balkema, 536.
- Asai, K., Satake, H., and Tsujimura, M., 2010. Isotopic approach to understanding the groundwater flow system within the andesitic strato-volcano in a temperate humid region: case study of Ontake volcano, Central Japan. Hydrological Processes, 23, 559–571. doi:10.1002/hyp.7185
- Brand, W.A., et al., 2009. Cavity ring-down spectroscopy versus high-temperature conversion isotope ratio mass spectrometry; a case study on δ2H and δ18O of pure water samples and alcohol/water mixtures. Rapid Communication in Mass Spectrometer, 23, 1879–1884. doi:10.1002/rcm.4083
- Bredehoeff, J., 2005. The conceptualization model problem-Surprise. Hydrogeoology Journal, 13, 37–46. doi:10.1007/s10040-004-0430-5
- Craig, H., 1961. Isotopic variation in meteoric waters. Science, 133, 1702–1703.
- Dansgaard, W., 1964. Stable isotope in precipitation. Tellus, 16, 436–468. doi:10.1111/j.2153-3490.1964.tb00181.x
- de Marsily, G., et al., 2005. Dealing with spatial Heterogeneity. Hydrogeology Journal, 13, 161–183. doi:10.1007/s10040-004-0432-3
- Don, H., 1998. Coastal waters of the world: trends, threats, and strategies. Washington D.C: Island Press.
- Dumort, J.C., 1968. Notice explicative sur la feuille de Douala Ouest. Yaounde: Ministere de Mines.
- Edet, A.E. and Okereke, C.S., 2002. Delineation of shallow groundwater aquifers in the coastal plain sands of Calabar area (Southern Nigeria) using surface resistivity and hydrogeological data. Journal of African Earth Sciences, 35, 433–443. doi:10.1016/S0899-5362(02)00148-3
- Edmunds, W.M., Carrillo-Rivera, J.J., and Cardona, A., 2002a. Geochemical evolution of groundwater beneath Mexico city. Journal of Hydrology, 258, 1–24. doi:10.1016/S0022-1694(01)00461-9
- Edmunds, W.M., et al., 2002b. Spatial and temporal distribution of groundwater recharge in Northern Nigeria. Hydrogeology Journal, 10, 205–215. doi:10.1007/s10040-001-0179-z
- Eneke, G.T., et al., 2011, Controls on groundwater chemistry in a highly urbanized coastal area. International Journal of Environmental Research, 5 (2), 475–490.
- Eneke, G.T., et al., 2010. Pollution Characteristics of alluvial ground-Water from springs and borewells in semi urban informal settlements of Douala, Cameroon, Western Africa. Environmental Earth Science, 61, 287–298. doi:10.1007/s12665-009-0342-8
- Eneke, G.T., et al., 2015. Acidification of shallow groundwater in the unconfined sandy aquifer of the city of Douala, Cameroon, Western Africa: implications for groundwater quality and use. Journal of Environmental Earth Sciences. doi:10.1007/S12665-015-4681-3
- Fantong, W.Y., et al., 2010. Hydrochemical and isotopic evidence of recharge, apparent age, and flow direction of groundwater in Mayo Tsanaga River Basin, 527 Cameroon: bearing on contamination. Environmental Earth Science, 60, 107–120. doi:10.1007/s12665-009-0173-7
- Fantong, W.Y., et al., 2009, Hydrogeochemical controls and usability of groundwater in semi-arid Mayo Tsanaga River Basin, Far North Province, Cameroon. Environmental Geology, 58 (6), 1281–1294. doi:10.1007/s00254-008-1629-x
- Faure, G., 1991. Principles and Applications of Inorganic Geochemistry. New York: Macmillan Publishing Company, 626.
- Fisher, A.T., 2005. Marine hydrogeology: recent accomplishments and future opportunities. Hydrogeology Journal, 13, 69–97. doi:10.1007/s10040-004-0400-y
- Ghiglieri, G., et al., 2009. Hydrogeology of the Nurra Region, Sardinia (Italy): basement-cover influences on groundwater occurrence and hydrogeochemistry. Hydrogeology Journal, 17, 447–466. ISSN: 1431-2174. doi:10.1007/s10040-008-0369-z
- Gibbs, R.J., 1970. Mechanisms controlling World water chemistry. Science, 170, 1088–1090. American Association for the Advancement of Science, Washington DC. doi:10.1126/science.170.3962.1088
- Global Water Partnership. 2009. Etat des lieux du Secteur de L’eau au Cameroun: Eau et Environnement (tome 2). Yaoundé, Cameroun: GWP-Cmr, 213.
- Glynn, P.D. and Plummer, L.N., 2005. Geochemistry and the understanding of groundwater systems. Hydrogeology Journal, 13, 263–287. doi:10.1007/s10040-004-0429-y
- Godfrey, S. and Smith, M., 2005. Improved microbial risk assessment of groundwater. Hydrogeology Journal, 13, 321–324. doi:10.1007/s10040-004-0412-7
- Gonfiantini, R., et al., 2001. The altitude effect on the isotopic composition of tropical rains. Chemical Geology, 181, 147–167. doi:10.1016/S0009-2541(01)00279-0
- Hancock, P.J., Boulton, A.J., and Humphrey, W.F., 2005. Aquifers and hyporheic zones: towards an ecological understanding of groundwater. Hydrogeology Journal, 13, 98–111. doi:10.1007/s10040-004-0421-6
- Hem, J.D., 1970. Study and Interpretation of the chemical characteristics of natural water. 2nd edn. Alexandria: US Geological Survey, 363.
- IAEA, 2007. Atlas of isotope hydrology-Africa. Vienna: IAEA publishing. ISBN 978-92-0-1072707-8 Imes JL. 120.
- Kamtchueng, B.T., et al., 2015. A multi-tracer approach for assessing the origin, apparent age and recharge mechanism of shallow groundwater in the Lake Nyos catchment, Northwest, Cameroon. Journal Hydrol, 523, 790–803. doi:10.1016/j.jhydrol.2015.02.008
- Ketchemen, B.T., 2011. Déterminants hydrogéologiques de la complexité du système aquifère du bassin sédimentaire de douala (Cameroun). Thesis (PhD). Dakar, Senegal: University of Cheikh Anta Diop.
- Lee, J.-Y. and Song, H., 2006. Evaluation of groundwater quality in coastal areas: implications for sustainable agriculture. Environmental Geology, 52, 1231–1242. doi:10.1007/s00254-006-0560-2
- Lis, G., Wassenaar, L.L., and Hendry, M.J., 2008. High precision laser spectrometry D/H and 18O/16O measurements of microliter natural water samples. Analytical Chemistry, 80, 287–293. doi:10.1021/ac701716q
- Mafany, G.T., 1999. Impact of the geology and seawater intrusion on groundwater quality in Douala. Thesis (M.Sc.). University of Buea, 252
- Meljevic, 2003. Application of environmental isotopes in evaluation of pollutants. Critical Review of Anaytical Chemistry, 33, 307–310. doi:10.1080/714037682
- Ndjama, J., et al., 2008, Water supply, sanitation and health risks in Douala, Cameroon. African Journal of Environmental Sciences and Technology, 2, 422–429.
- Piper, A.M., 1944. A graphic procedure in the geochemical interpretation of water analyses. American Geophys Union Transactions, 25, 914–923. doi:10.1029/TR025i006p00914
- Post, V.E.A., 2005. Fresh and saline groundwater interaction in coastal aquifers: is our technology ready for the problems ahead? Hydrogeology Journal, 13, 120–123. doi:10.1007/s10040-004-0417-2
- Regnoult, J.M., 1986. Synthese geologigue du Cameroon. Yaounde: Ministere des Mines et Energie, 119.
- Revelle, R., 1941. Criteria for recognizing seawater in groundwater. Transactions Amer Geophysical Union, 22, 593–598. doi:10.1029/TR022i003p00593
- Rozanski, K., Ara Araguás-Araguás, L., and Gonfiantini, R., 1993. Isotope patterns in modern global precipitation. In: P.K. Swart, et al., eds. Climate change in continental isotopic records. Geography Monograph Series 78. Washington, DC: AGU, 1–36.
- Scalon, B.R., et al., 2006. Global synthesis of groundwater recharge in semi-arid and arid regions. Hydrol Process, 20, 3335–3370. doi:10.1002/hyp.6335
- Schoeller, H., 1935, Utilitie de la notion des exchanges de bases pour la comparison des eaux souterraines: France, Societe Geologique. Comptes Rendus Sommaire Et Bulletin, Series 5, 5, 651–657.
- Sun, P., et al., 1989. Land and water resource management in Asia. An EDI policy seminar report. No. 20. Washington, D.C. USA: The World Bank, 54.
- Todd, K.D., 1980. Groundwater Hydrology. Canada: John Wiley and Sons, 535.
- Tsujimura, M., et al., 2007. Stable isotopic and geochemical characteristics of groundwater in Kherlin River Basin, a semi-arid region in Eastern Mongolia. Journal of Hydrology, 333, 47–57. doi:10.1016/j.jhydrol.2006.07.026
- WHO (World Health Organization), 1989. Health guidelines for the use of wastewater in agriculture and aquaculture. Report of WHO scientific group-Technical report series 778, Geneva: WHO. 74.
- Wirmvem, M.J., et al., 2014. Monthly δ18O, δD and Cl- characteristics of precipitation in the Ndop plain, Northwest Cameroon: baseline data. Quatern International, 338, 35–41. doi:10.1016/j.quaint.2013.07.009