
ABSTRACT
Quantifying the relative contributions of different factors to runoff change is helpful for basin management, especially in the context of climate change and anthropogenic activities. The effect of snow change on runoff is seldom evaluated. We attribute the runoff change in the Heihe Upstream Basin (HUB), an alpine basin in China, using two approaches: a snowmelt-based water balance model and the Budyko framework. Results from these approaches show good consistency. Precipitation accounts for 58% of the increasing runoff. The contribution of land-cover change seems unremarkable for the HUB as a whole, where land-cover change has a major effect on runoff in each sub-basin, but its positive effect on increasing runoff in sub-basins 1 and 3 is offset by the negative effect in sub-basin 2. Snow change plays an essential role in each sub-basin, with a contribution rate of around 30%. The impact of potential evapotranspiration is almost negligible.
EDITOR D. Koutsoyiannis
ASSOCIATE EDITOR S. Huang
1 Introduction
Climate change and anthropogenic activities have exerted considerable impacts on the hydrological cycle globally during recent decades (Milly et al. Citation2005, Sterling et al. Citation2013). However, region-specific impacts of climate change and human activities on the hydrological cycle vary from basin to basin (Piao et al. Citation2007, Arnell and Gosling Citation2013). Therefore, to address regional water resources assessment and management, it is important to investigate the influence of local climate change scenarios, as well as land-use and land-cover changes such as deforestation, cultivation and urbanization. Furthermore, catchment managers are particularly interested in quantifying the relative contributions of climate change and human activities to the observed changes in annual runoff.
In general, several approaches, including the statistical elasticity method (Sankarasubramanian et al. Citation2001, Zhao et al. Citation2015), the distributed hydrological model (Cong et al. Citation2009, Tan et al. Citation2015) and the lumped hydrological model (Donohue et al. Citation2011), have been successfully introduced to investigate the effects of hydrological variables on change in runoff. The statistical elasticity method is based on the implicit assumptions that climate lies within the range of historical observations and hydrological response will follow a similar pattern in the future (Gardner Citation2009). This method has limitations in that it offers little physical interpretation and it is difficult to evaluate the direct effect of land-cover change. The distributed hydrological model simulates “natural runoff” with climatic forcings and land-cover scenarios, and compares this with the “actual runoff” to access the effects of climate change and human activities on runoff generation. Model calibration and validation require a large set of parameters, which usually cannot be met, especially in basins that lack sufficient observational data. The lumped model, especially the Budyko framework, based on basin water–energy balance, remains a staple position in accessing hydrological response to environmental changes for its combination of comprehensiveness and effectiveness (Wang et al. Citation2016). In most of these studies, analytical expressions for estimating the effects of perturbations in precipitation, potential evaporation and curve shape parameter, which is thought to be the basin characteristic mainly affected by land cover in runoff change, are developed. Combinations of three or two of these approaches are also adopted to give a more reasonable assessment of runoff change.
Substantial efforts have been made to partition the impacts of different factors on runoff variation all over the world. However, attribution results show enormous discrepancies among various catchments. There is no consistent conclusion as to whether climate change makes a larger contribution to runoff change than land-cover change, even in similar areas. A study on the Loess Plateau showed that the land-cover change (62%) contribution to runoff reduction was much greater than climate change (38%) on average (Liang et al. Citation2015). Another discussion for a tributary of the Jinghe River, located on the Loess Plateau, presented the opposite conclusion that climate variability played a preponderant role in decreasing runoff and soil water content (Li et al. Citation2009). Thus, it is necessary and valuable to conduct an attribution analysis for a certain catchment that is also the basis for simulating the hydrological response to future climate and land-cover changes (Chen et al. Citation2015).
To date, most studies have focused on the effects of precipitation (water supply) and temperature (water demand) on runoff change, because temperature rise is the most remarkable feature and precipitation is the most essential driving factor of runoff generation. In the context of climate change, precipitation alterations occur not only in amount, but also in distribution (Feng et al. Citation2013) and state (Barnett et al. Citation2005). Furthermore, according to data analysis or model investigations, the seasonality (Feng et al. Citation2012) and fraction of precipitation falling as snow (Berghuijs et al. Citation2014) both have non-negligible effects on mean annual runoff. Therefore, the observed runoff change should also be attributed partly to variations of these factors. Nevertheless, to our knowledge, little work has been conducted so far to investigate the effects of these changing factors on runoff. Especially in alpine catchments, ignoring the effect of alteration of precipitation state on runoff may result in inaccurate runoff change attribution analysis (Bavay et al. Citation2013, Zhang et al. 2015b).
Northwest China, as an arid and cold region, has experienced significant climate change, including alterations of precipitation state and human activities during the past 50 years (Shi et al. Citation2007, Cheng et al. Citation2014). Hence, the basin hydrological cycle has changed in the area. Furthermore, this area shows a sensitive hydrological response to climate variability and human activities and is vulnerable to water shortage crises (Li et al. 2013b). For a diversity of regions, as mentioned above, understanding the impact of environmental changes on runoff regime in a specific basin is helpful in water resources utility and strategy. As far as we know, this is the first attempt to undertake a trend analysis of hydrological variables and attribute runoff change to climate change and human activities in the Heihe Upstream Basin (hereafter HUB), considering particularly the change in snow.
Accordingly, this paper compares results from the Budyko framework and a dynamic hydrological model (snowmelt-based water balance model) to assess the runoff change under the changing environment in the HUB, with the effect of change in snow on runoff taken into consideration. To make the results comparable with those from other traditional analyses considering the effects of total precipitation on runoff change, the contribution of total precipitation change to runoff change is still calculated, as in traditional analyses. Meanwhile, the snowfall effect on runoff is evaluated, which quantifies the impact of different states of precipitation on runoff change. It helps to understand that a normal analysis evaluating only the effect of total precipitation amount change on runoff is not enough. The objectives of this paper are as follows: (1) to analyse the trends of hydrological variables and step change points of runoff records in the HUB for the past 50 years; and (2) to attribute the change in runoff to environmental variations, including snow change, and justify the two attribution methods.
2 Data and methodology
2.1 Heihe Upstream Basin
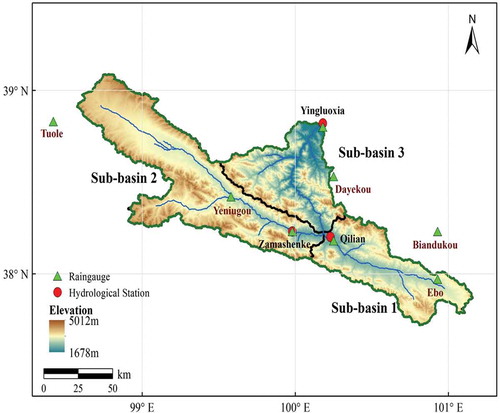
The Heihe River, originating from the Qilian Mountains, is the second largest inland river in China. As shown in , the river starts from two tributaries, the east branch Babao River and the west branch Yeniugou River, then runs through the Yingluoxia hydrological station located at the outlet of the upper reaches and ends in the Badanjilin Desert. The alpine upper reaches studied in this paper, with elevations ranging from 2000 m to 5500 m a.m.s.l., cover an area of 10 009 km2. The runoff generated from the upper reaches makes up nearly 70% of the catchment discharge and plays an essential role in supporting socio-economic development and maintaining the ecosystem of the whole basin (Jia et al. Citation2011, Gao et al. Citation2015). Characterized by a continental alpine semi-humid climate, vegetation coverage and soil texture in the upper reaches vary with the available water and energy, which are determined by site elevation and slope aspect. The HUB is covered mainly by alpine desert glacier, alpine meadow, forest and upland meadow, showing an apparent vertical vegetation distribution pattern (Deng et al. Citation2013).
Figure 1. Location of the HUB and distribution of raingauges and hydrological stations.
2.2 Meteorological and hydrological data
The daily runoff records from Qilian, Zamashenke and Yingluoxia hydrological stations were obtained from the HiWATER project (Li et al. 2013b) to analyse the runoff trend of the HUB and its sub-basins, including the east branch (sub-basin 1), west branch (sub-basin 2) and mountain stream (sub-basin 3). The daily potential evaporation Ep was estimated using the FAO Penman-Monteith equation based on meteorological factors, including air temperature, sunshine hours, relative humidity and wind speed. The precipitation state has not been recorded at the meteorological stations since 1980, so an empirical scheme to discriminate precipitation type was used here. The scheme (Ding et al. Citation2014), derived from more than 400 000 samples across China from 1951 to 1979, is easy and suitable to apply in the alpine areas of China. The daily precipitation obtained from eight raingauge stations, calculated Ep and snowfall were spatially averaged across the study area using the inverse distance weighted method to estimate areal values (New et al. Citation2000). All the above data covered the period from 1960 to 2010. The long-term average actual evaporation, calculated as the difference between precipitation and runoff assuming that the basin storage change is negligible over the whole period, was employed to investigate the steady-state water balance. A summary of the long-term hydrological variable estimates for the HUB is presented in .
Table 1. Information on the HUB and its sub-basins, 1960–2010.
2.3 Trend test and change point identification
To avoid assuming a prior statistical distribution of the data to be tested, two nonparametric tests, the Mann-Kendall (MK) rank test (Mann Citation1945) and the Pettitt change point test (Pettitt Citation1979), were used to detect the trend and locate the shift in the mean of time series, respectively.
The MK test has been widely used in the identification of monotonic trends in time series of hydro-climatic variables (Yue et al. 2002). The MK test is based on the statistic S defined as:
where is the sequential data
, N is the total number of data values in the time series and
The statistic S is documented to follow approximately a normal distribution with mean and variance as follows:
where is the number of ties of extent i. The standardized test statistic Z is computed as:
At pre-assigned significance level , the
, of the MK statistic Z of sample data can be used to reject the null hypothesis of no trend if
.
The Pettitt change point test detects a shift in the mean at an unknown time, and evaluates its significance. Considering the series Xi,the Mann-Whitney statistic Ut,N counts the number of times that an element of the first sample exceeds that of the second sample, where the two samples are separated by xt and can be expressed as:
Under the null hypothesis that the series is absent of a change point, the statistic of the Pettitt test k(t) and its associated probability used in the significance test are:
When p is smaller than the pre-assigned significance level, a significant change point exists, and the series can be divided into two sub-series at the location of change point t. Based on the above trend analysis and change point detection, runoff series can be seen to experience natural and disturbed periods showing significant trends and change points. Accordingly, the effects of environmental change on the difference in runoff between two periods need to be further investigated.
2.4 Attribution of runoff change
Given a catchment without regulation and water diversion, the total change in mean annual runoff between two independent periods due to the combined effects of climate and land cover change can be estimated as:
where is the total change in mean annual runoff, and
and
are observed mean annual runoff during the first and second period, respectively.
More than 90% of the irrigated farmland is in the middle river basin, and the HUB is relatively undisturbed by irrigation activities (Chen et al. Citation2005, Gao et al. Citation2014). Thus, unlike other inland basins in China (Han et al. Citation2011), agricultural irrigation is not taken into consideration when the water balance is evaluated in the HUB. The climatic variability and differences in catchment characteristics between two periods both contribute to total mean annual runoff change. Thus, the total change in mean annual runoff can also be expressed as:
where is the runoff change due to the climate variability between two periods, and
is the runoff change caused by the changes in land-cover vegetation.
To partition runoff impacts induced by climate and vegetation changes in detail, and
need to be further quantified. In this study,
is estimated from the changes in mean annual precipitation, Ep and snowfall using the Budyko framework and a dynamic hydrological model. In the former approach, sensitivity coefficients of climatic factors to runoff change can be derived from the Budyko framework. And in the latter approach, a dynamic hydrological model is calibrated for the first period, and then applied in the second period to estimate
and
by using controlled climatic forcings. More details will be given in the following two sections.
2.5 The Budyko framework
As mentioned above, snowfall has a non-negligible effect on runoff generation in alpine catchments. However, in most Budyko-type equations, snowfall is not considered. The Budyko framework treats the partitioning of precipitation between actual evapotranspiration and runoff as a functional balance of water supply and demand. Many mathematical equations have been developed to represent the Budyko framework (Fu Citation1981, Zhang et al. Citation2001, Yang et al. Citation2008). Among them, the Choudhury equation is usually adopted (Choudhury Citation1999):
where E is the mean annual actual evapotranspiration, P is the mean annual precipitation, Ep is the mean annual potential evapotranspiration, and n is a basin-specific parameter which acts as an indicator of the basin characteristic mainly related to land-cover vegetation (Li et al. 2013a).
Within the Budyko framework, Zhang et al. (2015a) developed an equation to quantify the relationship between snow ratio and annual runoff from the viewpoint of water–energy balance, providing a useful tool to investigate the effect of snow variation on runoff change. The proposed model introduced a snow ratio, the ratio of precipitation falling as snow to total precipitation, into the Budyko-type equation, as given by Equation (9):
where is the snow ratio,
, and
is the annual snowfall. Here, this equation is used to conduct the attribution analysis.
The formulation used here assumes that a basin is experiencing steady conditions and hence the water balance at the long-term time scale, where the change in basin storage is negligible as compared with other variables, is focused on. So, mean annual runoff is calculated as the difference in P and E without consideration of the storage change. Moreover, another assumption that the runoff change is from one steady state to another one without any transient changes is introduced. Equation (9) is differentiated to calculate the change in E due to changes in climate factors (P, Ep, Sn) and basin characteristic (n) to first order, similarly to Roderick and Farquhar (Citation2011):
Change in runoff, dQ, can be expressed as follows:
with the respective coefficients given by:
The precipitation, potential evapotranspiration, snowfall and land-cover vegetation are the dominant controls on mean annual water balance in alpine catchments. The changes in these four factors may be responsible for almost all of the change in annual runoff. The relative contributions of each factor to runoff change normalized by total runoff change between two sub-periods are:
2.6 The dynamic hydrological model
A lumped conceptual hydrological model, the snowmelt-based water balance model (SWBM), is also used to investigate the effects of climate and land-use change on runoff in the HUB. The SWBM can simulate monthly runoff from monthly rainfall (snowfall), temperature and Ep data, and has been successfully applied in semi-arid cold catchments in China (Wang et al. Citation2013). Compared with other conceptual hydrological models, such as the Xinanjiang model (Zhao Citation1992), TOPMODEL (Beven et al. Citation1995) and SIMHYD model (Chiew et al. Citation2002), the SWBM not only needs fewer parameters, but also has the advantage for hydrological simulation in cold areas of considering the processes of snow accumulation and ablation.
As presented in , the SWBM is flexible and straightforward. Monthly rainfall and snowfall are considered as separated inputs, as well as temperature and Ep. Surface flow, groundwater flow and snowmelt flow are calculated. The surface flow is assumed to be proportional to soil moisture storage and rainfall. The groundwater flow is simulated as a linear regression from soil moisture storage and one-time step lag. The HUB is partially covered by seasonal snow, and the snowmelt flow is treated as a function of temperature and snow accumulation. The total runoff is the sum of surface, groundwater and snowmelt flow. These three parts can be expressed in detail as follows:
Figure 2. Stucture of the SWBM.
where ,
and
are surface, groundwater and snowmelt flow in the ith month, respectively;
is soil moisture storage in the ith month; and
is snow accumulation in the ith month. The model inputs of rainfall, snowfall and temperature in month i are represented as
,
and
, respectively. The critical temperatures
and
are set at 4°C and −4°C,respectively, in this study (Wang et al. Citation2013). The parameters
,
,
and
are four model parameters that need to be calibrated, being surface water, groundwater, snowmelt flow coefficient, and maximum basin soil moisture storage, respectively. The former three parameters are dimensionless and range between 0 and 1. The
is the upper limit of soil moisture storage in any month and the excess water is taken as surface flow in the corresponding month.
A one-layer soil evaporation formula is used in this model. The actual evaporation is estimated as a linear function of soil wetness and limited by the potential evaporation and calculated using:
The total simulated runoff () is the sum of the three parts of runoff and soil moisture storage in the ith month and can be expressed, according to the water balance, as:
The generalized pattern search algorithm in MATLAB is used to optimize the above four parameters in the SWBM. The model is calibrated by maximizing the Nash-Sutcliffe efficiency (NSE) of monthly runoff (Nash and Sutcliffe Citation1970). Meanwhile, the relative error (RE) of water balance is introduced to evaluate the model performance. A good simulation has a NSE tending to 1 and RE to 0.
The model calibration and validation are accomplished during the pre-change runoff period, when the land cover is assumed to be stable. With calibrated model parameters, the difference between simulated runoff given corresponding climate condition and observed runoff in the post-change period is treated as the runoff change due to land-cover alteration. Furthermore, from the modelled runoff in the second period, by using one climate variable of the second period while keeping other variables the same as in the first period, the runoff change induced by the corresponding climate variable can be estimated. For example, the snowfall of the second period and precipitation, temperature and Ep of the first period are taken as inputs of the SWBM with the calibrated parameters as mentioned above, and the difference between simulated runoff and observed runoff in the second period is estimated as the runoff change resulting from snowfall and land-cover change. On the basis of the estimated runoff change due to the land-cover change, the effect of the snowfall change on runoff can be isolated. It should be noted that the effects of changes in different variables on runoff change are assumed to be linearly additional.
3 Results and discussion
3.1 Trend analysis of runoff and climate
Due to the shortness of the data series, the effect of long-term persistence in the data on the trend analysis is not considered in this study (Tyralis and Koutsoyiannis Citation2011). A modified trend-free pre-whitening approach for the nonparametric Mann-Kendall (MK) trend test (Yue et al. Citation2002) regarding the effect of first-order autocorrelation is applied to identify the long-term trend of annual runoff, precipitation, snowfall and Ep for the period 1960–2010.
As shown in , the results indicate that, except for sub-basin 2, all catchments experience a notable increasing runoff trend. The increasing rate of runoff depth varies from 0.54 to 1.12 mm/year, which is equivalent to 0.34–0.76% of the mean annual runoff. As for the annual precipitation, the whole upstream basin has a significant increasing trend. An apparent trend also exists in the annual Ep, but the value of the change rate is small. Increasing annual snowfall with a significant change rate is seen in every sub-basin.
Table 2. Trend analysis for annual runoff and climate variables (mm/year) using MK test.
The Pettitt test was employed to identify the change point where a shift in the mean at an unknown time is located at the maximum absolute value of statistic k(t). As shown in , the k(t) of this series indicates a change point around 1980, with the largest significance probability. Furthermore, when the three sub-basins are considered, shows that for sub-basins 1 and 3 change points in annual runoff also exist around 1980, while there is no significant change point for sub-basin 2, which is also consistent with the trend analysis in .
Figure 3. Change point analysis of runoff in the HUB using the Pettitt test. Horizontal dotted lines represent the 95% confidence interval.
According to the annual runoff trend and change point detection, it can be concluded that the HUB experienced two different periods, with the change year around 1980. For simplicity and comparability, the study period for all hydrological variables is spilt into two sub-periods at 1980: 1960–1979 is denoted period-1, while 1980–2010 is denoted period-2. This change of runoff regime is more or less consistent with the situation in which rapid economic development and remarkable land-cover change have taken place in China since 1978, greatly altering the environment and hydrological response.
3.2 Dynamic hydrological simulation
3.2.1 Model calibration and validation
As mentioned in Section 2.6, the model calibration and validation are carried out in the first period to make sure both calibration and validation periods have relatively similar land cover. The first period is divided into 1960–1974 and 1975–1979 for the SWBM calibration and validation, respectively. The model simulates runoff for the HUB and its sub-basins at the monthly scale. The results of model calibration and validation at monthly time steps are shown in . The observed monthly runoff is plotted along the x-axis and the simulated runoff is plotted along the y-axis. The NES and RE values of monthly runoff simulation are also presented.
Figure 4. Comparison of simulated and observed monthly runoff in calibration and validation periods.
The scatter plots indicate that the SWBM performs well in both calibration and validation periods with a high NSE and low RE values for all four basins. The calibration NSE values are 0.87, 0.87, 0.87 and 0.78, and the RE of water balance values are 0.9%, 1.6%, 0.7% and 14.1% for the HUB and its sub-basins 1–3, respectively. The good performance in the validation period suggests the suitability and robustness of the model in the study. The scatter plots in also show the model has good performance in the validation period for all basins. The model evaluation criteria of NSE and RE are 0.78, 0.71, 0.74 and 0.74, and 5.6%, 6.8%, 14.6% and 12.0%, respectively. As expected, in the validation period the model performs a little worse than in the calibration period. However, the NSE values are always higher than 0.75 and RE values are under 15% for all basins. There are some differences in model performance during the calibration and validation periods, but they are acceptable for such small deviations. The results here suggest that there are no systematic errors in simulating monthly runoff in the HUB by using the SWBM.
3.2.2 Influence of climate and land-use change
The calibrated SWBM is used to simulate the monthly runoff with manipulated inputs during the period 1980–2010 for all four basins to estimate the influence of different climate variables and land-cover change on runoff. As described in the methodology, to investigate the effects of land-cover change on runoff, the difference between simulated runoff with calibrated parameters and climate of period-2 and observed runoff is estimated. shows the comparison of the simulated and observed annual runoff time series of period-2 for all basins.
Figure 5. Comparison of simulated and observed annual runoff in period-2 by the SWBM.
The model simulation shows that a significant runoff response to land-cover change can be seen. From , in the HUB and sub-basins 1 and 3, the simulated annual runoff values are almost always lower than the observed ones. The model simulations during period-2 are driven by observed climate and calibrated parameters that suggest the same land cover as period-1, while observed runoff results from actual climate and land cover of period-2. The difference between observed and simulated runoff during period-2 shown in is purely induced by the land-cover change. Thus, runoff increases due to the land-cover change during period-2 in these three basins. In sub-basin 2, the opposite pattern is seen. The different land-cover transformations from period-1 to period-2 result in the opposing effects of land-cover change on runoff among these four basins, which will be discussed in Section 3.4.
To separate and quantify the influence of land cover and each climate variable on runoff change during period-2, the simulated runoff with controlled climate inputs is compared with the observed, as introduced in Section 2.6. The estimated runoff change induced by corresponding climate factors is summarized in .
Table 3. Mean annual runoff change (mm) induced by climate and land-cover change estimated from the SWBM.
The simulated total mean annual runoff change (ΔQsim) is obtained by summing runoff changes due to various factors modelled by the SWBM, assuming that the effects of these factors are independent. Compared with the observed runoff change, the error values are all less than 10%, indicating that the SWBM performs well in evaluating the impacts of climate and land-cover change on runoff.
In the HUB, variations in total precipitation and snowfall contribute most to runoff change, and the induced corresponding runoff change values are 14.3 and 10 mm, respectively. The changes in these two variables account for more than 90% of the total runoff change. The land-cover change does not result in a notable runoff change, with a contribution rate of 11.8%. Consistent with the trend analysis result that Ep has no obvious trend, the effect of Ep change on runoff is negligible, with a contribution rate of 2.2%.
In the sub-basins, different simulated results can be seen, especially in the impact of land-cover change. Other than sub-basins 1 and 3, the land-cover change in sub-basin 2 makes a negative contribution to runoff increase. A runoff decrease of 14.5 mm is attributed to the land-cover change in sub-basin 2, while the simulated total runoff increase is 11.6 mm. In the other two sub-basins, land-cover change leads to runoff increases of 11.1 mm and 22.6 mm, equivalent to 35% and 52% of the total runoff increase, respectively. The reason why opposing effects of land-cover change on runoff exist will be further discussed in Section 3.4, by investigating the detailed land-cover transformation in each sub-basin. Compared with the influence of climate, the land-cover impacts on runoff are remarkable in all three sub-basins, and different from that in the HUB. In sub-basin 3, land-cover change is recognized as the primary factor leading to the positive runoff trend, followed by the snow change whose effect is almost one-third. In both sub-basins 1 and 2, the contributions of land-cover change occupy the second position, and the absolute values are quite close to the precipitation change impact. Similar to the results in the HUB, the runoff reductions due to the Ep increase in all three sub-basins are negligible in the SWBM simulation.
3.3 Attribution of runoff change within the Budyko framework
The Budyko framework introduced in Section 2.5 is used to analyse the attribution of increasing runoff in the HUB and its sub-basins. The basin-specific parameters in Equation (9) are estimated using the average flux (P, E, Ep, Sn) during the whole time period 1960–2010, and then corresponding “response coefficients” are calculated according to Equation (12) for all the catchments, as presented in .
Table 4. Estimates of basin parameters for the HUB and sub-basins.
The default value of n in the Choudhury equation (Choudhury Citation1999) is 1.8, which is much larger than the estimated values. In the high-altitude area, the fraction of precipitation falling as snow in the HUB is likely larger than that in Choudhury’s study, which tends to generate more discharge and less evapotranspiration for given annual precipitation and Ep (Barnett et al. Citation2005). What is more, the steep average slope of the HUB due to dramatically changing topography within the narrow valley also favours a larger runoff to be generated (Yang et al. Citation2009). A smaller n value indicates a higher Q and lower E for the given climate. Thus, a relatively small basin parameter n is reasonable in this study. The response coefficient of precipitation (0.58) is greater than that of Ep (−0.13) in the HUB, which means that a 10 mm increase in precipitation (or Ep) would increase runoff by 5.8 mm (or decrease runoff by 1.3 mm). As expected, changes in runoff are more sensitive to precipitation than Ep in a water-limited catchment, which is in line with Liang et al. (Citation2015).
Simultaneously, the differences in hydrological variables, as well as the estimated basin parameters between the two sub-periods are listed in . It is obvious that runoff and precipitation, as well as snow in period-2, are larger than in period-1. It is interesting to see that the changes in basin parameter n show different patterns, among which that of sub-basin 2 increases and others decrease. The different signs of the change in basin parameters indicate opposite impacts on runoff change.
Table 5. Summary statistics of hydrological variable changes between period-2 (1980–2010) and period-1 (1960–1979) for the HUB and sub-basins.
To quantify the contributions of climate variability and land-cover change to runoff change, the response coefficients and changes in climate factors and basin properties are substituted into Equations (11) and (12). Thus we obtain the estimated runoff changes which resemble the observations, as shown in . The maximum relative error is less than 10% among these four basins. Compared with results from the SWBM, as presented in , runoff change estimation using the Budyko attribution method has similar good performance. However, some uncertainties still exist in the attribution analysis of runoff increase. Recent research by Yang et al. (Citation2014) pointed out that the Budyko attribution method was based on the first-order Taylor expansion and there is a potential error.
Table 6. Mean annual runoff change (mm) induced by climate and land-cover change estimated from the Budyko framework.
As shown in , the relative contributions of each factor defined in Equation (13) are estimated by the SWBM and the Budyko framework. Generally, similar results from the two methods show that, on average, precipitation (58%) contributes most to runoff change, followed by snow (37%) and land-cover change (13%) in the HUB, while the effect of variability in potential evaporation on runoff can be neglected to some extent. The different roles that climate factors play in runoff change attribution coincide with their trend analysis results. The results are also reasonable in that runoff change is mainly induced by variability in precipitation, instead of energy as in arid catchments such as the HUB (Yang et al. Citation2007).
Figure 6. Relative contribution of climate variability and land-cover change from period-1 to period-2 to changes in runoff estimated by the SWBM (left, blue) and Budyko framework (right, red) for the HUB and sub-basins.
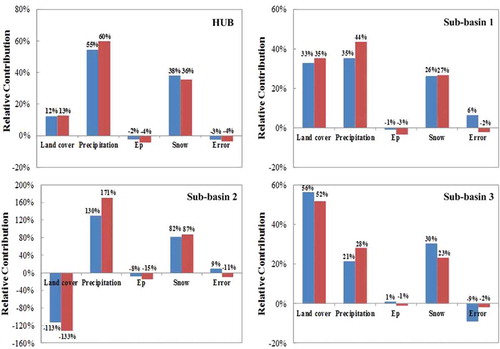
It should be noted that the effect of snow change on runoff is important, with average relative contributions of 27%, 85% and 27% for sub-basins 1, 2 and 3, respectively. The impact of snow change on runoff is almost equivalent to that of precipitation. Using traditional Budyko attribution methods, such as the elasticity approach (Sankarasubramanian et al. Citation2001) or the composition method (Wang and Hejazi Citation2011), the snow effect on basin water balance is not identified. Other than the influence of precipitation and Ep, runoff change is attributed to basin parameter variability, which is regarded as land-cover change. It can be implied from that, in alpine catchments, a large bias may be introduced in attribution analysis using traditional approaches. The conclusion as to whether climate change or human activities such as land-cover change exerts a more important influence on runoff change may be uncertain, and hence may not be useful for water managers and policy makers.
3.4 Change in land cover and its impact on runoff change
The change in basin parameter n calls for more attention as it is tightly linked with human activities. The parameter is a function of soil properties, topography and land-cover vegetation (Yang et al. Citation2009). Assuming that soil texture and topography over catchments change little during several decades, the change of vegetation should be responsible for the change in basin parameter. In addition, by comparing with global observational data, Zhang et al. (Citation2001) concluded that a basin with deep-rooted plants (woody plants) generally has a larger parameter value than one covered by shallow-rooted plants (short grass or cropland), and one with bare soil has the smallest parameter value. In other words, changes in land cover from woody plants to bare soil lead to a reduction in basin evaporation and a corresponding increase in runoff.
An et al. (Citation2013) identified the dynamic evolution of the land cover during the past 30 years in the HUB by using Landsat images. The results showed that the percentage of forest and grassland cover in the 2000s decreased by 5.1% and 4%, respectively, as compared with that in 1980s, while bare land and cultivated land area increased by 6.9% and 2.5%, respectively. This change in land cover, equivalent to a reduction of basin-average plant root depth, leads to a decrease in evaporation, which is consistent with the positive contribution of basin parameter change to the runoff increase.
In sub-basin 2, the dominant contributor of the increasing runoff is precipitation. The interesting finding is that the basin-specific parameter has a negative contribution to the runoff increase, contrary to that in the other sub-basins. Sub-basin 2 is located in the mountainous area of the HUB and most glaciers and snowpack are distributed in the southeast of this sub-basin. With climate warming since the 1980s, the glacier and snowpack area (40 km2) has shrunk by half and turned into bare land or grassland (Hao and Zong Citation2013). This land-cover transformation from snowpack to vegetation has increased the mean annual actual evapotranspiration and therefore contributed negatively to the runoff increase.
Sub-basins 1 and 3 have experienced rapid development in the past three decades, with intensive human activities such as urbanization, overgrazing and deforestation. As a consequence, significant increases in cultivated land, grassland degradation and forest belt retreat have been seen. The majority of forests in the HUB are distributed in the southeast of sub-basin 3, and therefore a large part of the deforestation took place in this sub-basin. The deforested area has been replaced by bare land or meadows, resulting in decreased basin evapotranspiration. Land-cover and land-use changes in sub-basin 3 play a leading role in runoff variation.
3.5 Evaluation of attribution analysis methods
Accurate estimation of the effects of climate and land-cover changes on runoff change is important to basin management. Whether climate or land-cover change contributes more to runoff change will lead to significantly different water policy. Generally speaking, a distributed hydrological model is a better option to conduct this kind of analysis because it is flexible for local characteristics of a specific catchment. When regional analysis involving lots of catchments is performed, a simple lumped hydrological model, such as the Budyko framework, is preferred. However, the traditional Budyko framework does not account for the impact of climatic factors other than total water and energy supply on water balance. Analysis using the traditional Budyko framework attributes the impact to a specific basin characteristic that is usually considered to be the land-cover change effect. Thus, when other specific climatic factors, such as precipitation state or seasonality, affect the basin water balance a lot, the results from the traditional Budyko framework may overestimate the contribution of the land-cover change to runoff change. To obtain a reasonable result, using a modified Budyko framework considering the corresponding climatic factors is an alternative. Using another method with a different mechanism, such as a dynamic hydrological model, for cross validation is an even better option. The modified Budyko framework and dynamic hydrological model can be applied to several representative catchments simultaneously. Once they show similar results, the modified Budyko framework could be suitable for dozens of other catchments in a regional analysis and it could be applied individually for simplicity. Therefore, when attribution analysis of basin runoff change is conducted, the Budyko framework is preferred for its simplicity, especially for lots of catchments. And adopting another kind of hydrological model for cross validation is preferred. This has helped us not only to obtain accurate results, but also to validate the modified Budyko framework.
4 Conclusions
In this paper, the contributions of land-cover change and climate variability, including snow, to runoff change were investigated using a dynamic and conceptual hydrological model for the Heihe Basin, an alpine catchment in northwest China. The results from both models showed good consistency, indicating that both land-cover change and climate variability play major roles in the runoff increase.
Trends in hydrological variables for the HUB and its sub-basins during the past 50 years were analysed. At level of 0.05, a significant increasing trend of annual runoff was detected in all basins except sub-basin 2. By adopting the Pettitt change point test, a shift in the mean annual runoff was observed between 1975 and 1980, with the most significant change point around 1980. Annual runoff of the HUB and three sub-basins was divided into two periods at 1980 to analyse the mean annual runoff change.
In the dynamic hydrological model, the snowmelt-based water balance model was calibrated and validated for the HUB and three sub-basins using meteorological data and observed runoff for the pre-change period. The calibrated model was used to quantify the effects of climate variability and land-cover change on runoff. Meanwhile, the Budyko framework considering the snow effect on water balance was also adopted to understand the runoff trend in these basins. Similar results were obtained from two different hydrological models, which confirmed the accuracy of attribution analysis in this study. In the HUB, increasing precipitation was estimated to account for 56% of the increase in mean annual runoff on average, and the snow change was responsible for 36% of the runoff increase which was usually disregarded in previous studies. In the sub-basins, land-cover change played the major role in runoff change. The positive contribution to runoff increase observed in sub-basins 1 and 3 was caused by urbanization, meadow degeneration and deforestation, while a negative contribution was seen in sub-basin 2 due to a transformation from glacier to meadow/bare land.
During the past 50 years, significant runoff changes due to climate and land-cover variations has taken place in the upper reaches of the Heihe River. Using two different attribution approaches to quantify the effect of environmental variations on runoff change is helpful for basin management in the context of different future climate change and human activities scenarios. However, due to the important role of precipitation variability in runoff changes in arid regions, we need to be aware that accurate estimate of areal precipitation in the attribution of runoff change makes uncertainty analysis very urgent in future work. In addition, quantifying the relationship between land-cover change and basin-specific parameters would also be valuable.
Disclosure statement
No potential conflict of interest was reported by the authors.
Additional information
Funding
References
- An, M., et al., 2013. Quantitative analysis of dynamic change of land use and its influencing factors in upper reaches of the Heihe River. Journal of Glaciology and Geocryology, 35 (2), 355–363 (in Chinese).
- Arnell, N.W. and Gosling, S.N., 2013. The impacts of climate change on river flow regimes at the global scale. Journal of Hydrology, 486, 351–364. doi:10.1016/j.jhydrol.2013.02.010
- Barnett, T.P., Adam, J.C., and Lettenmaier, D.P., 2005. Potential impacts of a warming climate on water availability in snow-dominated regions. Nature, 438 (7066), 303–309. doi:10.1038/nature04141
- Bavay, M., Grünewald, T., and Lehning, M., 2013. Response of snow cover and runoff to climate change in high Alpine catchments of Eastern Switzerland. Advances in Water Resources, 55, 4–16. doi:10.1016/j.advwatres.2012.12.009
- Berghuijs, W.R., Woods, R.A., and Hrachowitz, M., 2014. A precipitation shift from snow towards rain leads to a decrease in streamflow. Nature Climate Change, 4 (7), 583–586. doi:10.1038/nclimate2246
- Beven, K.J., et al., 1995. Topmodel. Computer Models of Watershed Hydrology, 18, 627–668.
- Chen, H., et al., 2015. Simulating the hydrologic impacts of land-cover and climate changes in a semi-arid watershed. Hydrological Sciences Journal, 60 (10), 1739–1758. doi:10.1080/02626667.2014.948445
- Chen, Y., et al., 2005. Water demand management: a case study of the Heihe River Basin in China. Physics and Chemistry of the Earth, Parts A/B/C, 30 (6), 408–419. doi:10.1016/j.pce.2005.06.019
- Cheng, G., et al., 2014. Integrated study of the water–ecosystem–economy in the Heihe River Basin. National Science Review, 1 (3), 413–428. doi:10.1093/nsr/nwu017
- Chiew, F.H.S., Peel, M.C., and Western, A.W., 2002. Application and testing of the simple rainfall-runoff model SIMHYD. In: Mathematical models of small watershed hydrology and applications, 335–367.
- Choudhury, B., 1999. Evaluation of an empirical equation for annual evaporation using field observations and results from a biophysical model. Journal of Hydrology, 216 (1), 99–110. doi:10.1016/S0022-1694(98)00293-5
- Cong, Z., et al., 2009. Hydrological trend analysis in the Yellow River basin using a distributed hydrological model. Water Resources Research, 45 (7). doi:10.1029/2008WR006852
- Deng, S., et al., 2013. Vegetation cover variation in the Qilian Mountains and its response to climate change in 2000–2011. Journal of Mountain Science, 10 (6), 1050–1062. doi:10.1007/s11629-013-2558-z
- Ding, B., et al., 2014. The dependence of precipitation types on surface elevation and meteorological conditions and its parameterization. Journal of Hydrology, 513, 154–163. doi:10.1016/j.jhydrol.2014.03.038
- Donohue, R.J., Roderick, M.L., and McVicar, T.R., 2011. Assessing the differences in sensitivities of runoff to changes in climatic conditions across a large basin. Journal of Hydrology, 406 (3), 234–244. doi:10.1016/j.jhydrol.2011.07.003
- Feng, X., Porporato, A., and Rodriguez-Iturbe, I., 2013. Changes in rainfall seasonality in the tropics. Nature Climate Change, 3 (9), 811–815. doi:10.1038/nclimate1907
- Feng, X., Vico, G., and Porporato, A., 2012. On the effects of seasonality on soil water balance and plant growth. Water Resources Research, 48 (5). doi:10.1029/2011WR011263
- Fu, B., 1981. On the calculation of the evaporation from land surface. Scientia Atmospherica Sinica, 5 (1), 23–31 (in Chinese).
- Gao, B., et al., 2015. Modeling ecohydrological processes and spatial patterns in the Upper Heihe Basin in China. Forests, 7 (1), 10. doi:10.3390/f7010010
- Gao, H., et al., 2014. Testing the realism of a topography driven model (FLEX-Topo) in the nested catchments of the Upper Heihe, China. Hydrology and Earth System Sciences, 18, 1895–1915. doi:10.5194/hess-18-1895-2014
- Gardner, L.R., 2009. Assessing the effect of climate change on mean annual runoff. Journal of Hydrology, 379 (3), 351–359. doi:10.1016/j.jhydrol.2009.10.021
- Han, S., et al., 2011. Irrigation impact on annual water balance of the oases in Tarim Basin, Northwest China. Hydrological Processes, 25 (2), 167–174. doi:10.1002/hyp.7830
- Hao, Z. and Zong, B., 2013. Land use and land cover change analysis in the upper reaches of the Heihe river. China Rural Water and Hydropower, 10, 115–118 (in Chinese).
- Jia, L., et al., 2011. Phenological response of vegetation to upstream river flow in the Heihe Rive basin by time series analysis of MODIS data. Hydrology and Earth System Sciences, 15, 1047–1064. doi:10.5194/hess-15-1047-2011
- Li, D., et al., 2013a. Vegetation control on water and energy balance within the Budyko framework. Water Resources Research, 49 (2), 969–976. doi:10.1002/wrcr.20107
- Li, X., et al., 2013b. Heihe watershed allied telemetry experimental research (HiWATER): scientific objectives and experimental design. Bulletin of the American Meteorological Society, 94 (8), 1145–1160. doi:10.1175/BAMS-D-12-00154.1
- Li, Z., et al., 2009. Impacts of land use change and climate variability on hydrology in an agricultural catchment on the Loess Plateau of China. Journal of Hydrology, 377 (1), 35–42. doi:10.1016/j.jhydrol.2009.08.007
- Liang, W., et al., 2015. Quantifying the impacts of climate change and ecological restoration on streamflow changes based on a Budyko hydrological model in China’s Loess Plateau. Water Resources Research, 51 (8), 6500–6519. doi:10.1002/2014WR016589
- Mann, H.B., 1945. Nonparametric tests against trend. Econometrica: Journal of the Econometric Society, 13, 245–259. doi:10.2307/1907187
- Milly, P.C., Dunne, K.A., and Vecchia, A.V., 2005. Global pattern of trends in streamflow and water availability in a changing climate. Nature, 438 (7066), 347–350. doi:10.1038/nature04312
- Nash, J.E. and Sutcliffe, J.V., 1970. River flow forecasting through conceptual models part I—a discussion of principles. Journal of Hydrology, 10 (3), 282–290. doi:10.1016/0022-1694(70)90255-6
- New, M., Hulme, M., and Jones, P., 2000. Representing twentieth-century space-time climate variability. Part II: development of 1901–96 monthly grids of terrestrial surface climate. Journal of Climate, 13 (13), 2217–2238. doi:10.1175/1520-0442(2000)013<2217:RTCSTC>2.0.CO;2
- Pettitt, A.N., 1979. A non-parametric approach to the change-point problem. Applied Statistics, 28, 126–135. doi:10.2307/2346729
- Piao, S., et al., 2007. Changes in climate and land use have a larger direct impact than rising CO2 on global river runoff trends. Proceedings of the National Academy of Sciences, 104 (39), 15242–15247. doi:10.1073/pnas.0707213104
- Roderick, M.L. and Farquhar, G.D., 2011. A simple framework for relating variations in runoff to variations in climatic conditions and catchment properties. Water Resources Research, 47 (12). doi:10.1029/2010WR009826
- Sankarasubramanian, A., Vogel, R.M., and Limbrunner, J.F., 2001. Climate elasticity of streamflow in the United States. Water Resources Research, 37 (6), 1771–1781. doi:10.1029/2000WR900330
- Shi, Y., et al., 2007. Recent and future climate change in northwest China. Climatic Change, 80 (3–4), 379–393. doi:10.1007/s10584-006-9121-7
- Sterling, S.M., Ducharne, A., and Polcher, J., 2013. The impact of global land-cover change on the terrestrial water cycle. Nature Climate Change, 3 (4), 385–390. doi:10.1038/nclimate1690
- Tan, M.L., et al., 2015. Impacts of land-use and climate variability on hydrological components in the Johor River basin, Malaysia. Hydrological Sciences Journal, 60 (5), 873–889. doi:10.1080/02626667.2014.967246
- Tyralis, H. and Koutsoyiannis, D., 2011. Simultaneous estimation of the parameters of the Hurst–Kolmogorov stochastic process. Stochastic Environmental Research and Risk Assessment, 25 (1), 21–33. doi:10.1007/s00477-010-0408-x
- Wang, C., et al., 2016. Advances in hydrological modelling with the Budyko framework: a review. Progress in Physical Geography, 40, 409–430. doi:10.1177/0309133315620997
- Wang, D. and Hejazi, M., 2011. Quantifying the relative contribution of the climate and direct human impacts on mean annual streamflow in the contiguous United States. Water Resources Research, 47 (10). doi:10.1029/2010WR010283
- Wang, G., et al., 2013. Simulating the impact of climate change on runoff in a typical river catchment of the Loess Plateau, China. Journal of Hydrometeorology, 14 (5), 1553–1561. doi:10.1175/JHM-D-12-081.1
- Yang, D., et al., 2009. Impact of vegetation coverage on regional water balance in the nonhumid regions of China. Water Resources Research, 45 (7). doi:10.1029/2008WR006948
- Yang, D., et al., 2007. Analyzing spatial and temporal variability of annual water-energy balance in nonhumid regions of China using the Budyko hypothesis. Water Resources Research, 43 (4). doi:10.1029/2006WR005224
- Yang, H., Yang, D., and Hu, Q., 2014. An error analysis of the Budyko hypothesis for assessing the contribution of climate change to runoff. Water Resources Research, 50 (12), 9620–9629. doi:10.1002/2014WR015451
- Yang, H., et al., 2008. New analytical derivation of the mean annual water-energy balance equation. Water Resources Research, 44 (3). doi:10.1029/2007WR006135
- Yue, S., Pilon, P., and Cavadias, G., 2002. Power of the Mann–Kendall and Spearman’s rho tests for detecting monotonic trends in hydrological series. Journal of Hydrology, 259 (1), 254–271. doi:10.1016/S0022-1694(01)00594-7
- Zhang, D., et al., 2015a. Effects of snow ratio on annual runoff within the Budyko framework. Hydrology and Earth System Sciences, 19 (4), 1977–1992. doi:10.5194/hess-19-1977-2015
- Zhang, F., et al., 2015b. Snow cover and runoff modelling in a high mountain catchment with scarce data: effects of temperature and precipitation parameters. Hydrological Processes, 29 (1), 52–65. doi:10.1002/hyp.10125
- Zhang, L., Dawes, W.R., and Walker, G.R., 2001. Response of mean annual evapotranspiration to vegetation changes at catchment scale. Water Resources Research, 37 (3), 701–708. doi:10.1029/2000WR900325
- Zhao, C., et al., 2015. Separation of the impacts of climate change and human activity on runoff variations. Hydrological Sciences Journal, 60 (2), 234–246. doi:10.1080/02626667.2013.865029
- Zhao, R., 1992. The Xinanjiang model applied in China. Journal of Hydrology, 135 (1), 371–381. doi:10.1016/0022-1694(92)90096-E