
ABSTRACT
The magnitude, occurrence rate and occurrence timing of floods in the Poyang Lake basin were analysed. The flood series were acquired by annual and seasonal maximum flow (AMF) sampling and peaks-over-threshold (POT) sampling. Nonstationarity and uncertainty were analysed using kernel density estimation and the bootstrap resampling methods. Using the relationships between flood indices and climate indices, i.e. El Niño/Southern Oscillation (ENSO), North Atlantic Oscillation (NAO), Indian Ocean Dipole (IOD) and Pacific Decadal Oscillation (PDO), the potential causes of flooding were investigated. The results indicate that (1) the magnitudes of annual and seasonal AMF- and POT-based sampled floods generally exhibit an increasing tendency; (2) the highest occurrence rates of floods identified were during the 1990s, when the flood-affected crop area, flood-damaged crop area and crop failure area reached the highest levels; and (3) ENSO and IOD are the major climate indices that significantly correlate with the magnitude and frequency of floods of the following year.
EDITOR A. Castellarin ASSOCIATE EDITOR T. Kjeldsen
1 Introduction
Climate warming is believed to accelerate the hydrological cycle at global and continental scales (e.g. Alan et al. Citation2003). Extreme weather, exhibited by more extreme precipitation, lengthening of dry span, higher peak flows and increased intensity of most extreme tropical cyclones, has been observed all over the world since the 1950s (IPCC Citation2013, Kundzewicz et al. Citation2014, Apurv et al. Citation2015) and has increased risks of floods and droughts (Sun et al. Citation2012). The acceleration of the hydrological cycle is reflected mainly in changes in hydrological processes, such as the intensity and frequency of precipitation, river flow, evapotranspiration, soil moisture, and so on (Huntington Citation2006, Gao et al. Citation2007, Yilmaz Citation2015, Liu et al. Citation2017), and also increased occurrences of hydrological extremes (Easterling et al. Citation2000). Burn et al. (Citation2010) indicated that climate change could result in (1) increases or decreases in extreme event magnitudes, (2) changes in the timing of extreme events or (3) changes in the hydrological processes that lead to extreme events. However, increasing studies have found clustering effects of hydrological and precipitation extremes since the work by Le Cam (Citation1961). Villarini et al. (Citation2010) found temporal clustering of floods in the USA. Studies by Mailier et al. (Citation2006), Vitolo et al. (Citation2009) and Mumby et al. (Citation2011) discovered clustering effects of tropical and extratropical cyclones and storms. Analysing precipitation processes in China, Zhang et al. (Citation2012) pointed out a significant dependence of precipitation volume, m, and duration of precipitation event, t, on their previous values for similar volumes, and the dependence tended to be stronger when m was larger or t was longer. Milly et al. (Citation2007) argued that stationarity was dead and should no longer serve as a central, default assumption in water-resource risk assessment and planning. Hence, nonstationarity of flood events has drawn significant concern (Villarini et al. Citation2009, Citation2010, Silva et al. Citation2012, Zhang et al. Citation2015).
Poyang Lake (28°22′–29°45′N, 115°47′–116°45′E), located in the middle Yangtze River basin (), is the largest freshwater lake in China. The total drainage area of the water systems of the basin is 162 200 km2, accounting for approximately 9% of the drainage area of the Yangtze River basin. The lake basin is a very important wetland and acts as one of the major agricultural production areas in China. However, flood events in the basin have intensified in recent decades, causing tremendous losses of agricultural production, property and lives, and the intensification is being attributed to the alteration of the hydrological cycle (Shankman et al. Citation2006). Poyang Lake is higher in the western, southern and eastern parts and is lower in the northern part, therefore precipitation always converges in the northern Poyang Lake basin, and heavy floods occur whenever rainstorms occur (Zhang et al. Citation2014). In 2009, the State Council of China officially approved “Poyang Lake Ecological Economic Zone Planning” (http://info.e-to-china.com/investment_guide/72106.htm) and since then development of the lake basin has drawn considerable concern from the Chinese government. Fundamental to the basin development, especially flood control and consequent reduction of flood-induced losses (Nakayama and Watanabe Citation2008), is the understanding of changing properties and impacts of hydrological extremes.
Due to the critical role the Poyang Lake basin plays in flood mitigation and control in the Middle Yangtze River basin, and in the conservation of the ecological environment, many researchers have analysed flooding in the Poyang Lake basin. For example, Shankman et al. (Citation2006) found that El Niño is one important cause behind the severe floods in the Poyang Lake basin, e.g. the 1954 and 1998 floods. Ma et al. (Citation2007) pointed out that the populated regions are also those with high flood risk. Using an indicator approach, spatiotemporal patterns of flood vulnerability in the Poyang Lake basin have been analysed by Chen and Chen (Citation2012). Zhang et al. (Citation2011), using the probability distribution functions and Mann-Kendall trend test method, analysed the probability behaviour and trends of hydrological extremes (the 7-day high flow). However, the statistical properties of peaks-over-threshold (POT) based sample floods and different seasonal floods across the basin have not received much attention, particularly for the occurrence rates and clustering of the floods. Therefore, the objectives of this study are to (1) analyse the statistical properties of floods defined by nine flood indices, using annual and seasonal maximum flow (AMF) and POT-based sample flood series; (2) evaluate the clustering phenomenon of floods within the basin; and (3) investigate the relationships between flood indices and climate indices, and probe the causes behind the change in floods. In addition, the impacts of floods on agriculture in the basin are discussed. This study helps to shed new light on the changing properties of flood events in the lake basin, providing a theoretical background for flood frequency analysis and development of flood mitigation measures.
2 Data
The hydrological data analysed in this study were daily streamflow data extracted from six hydrological stations on Gan River, Fu River, Xin River, Rao River and Xiu River, i.e. Waizhou, Lijiadu, Meigang, Hushan, Dufengkeng and Wanjiabu stations, respectively. The streamflow data at Waizhou, Lijiadu and Wanjiabu stations were collected for 1955–2005 and those data at Meigang and Hushan stations were collected for 1952–2005. The locations of these rivers and hydrological stations are shown in . There were missing data in 1978 and 1981 at Hushan station. The missing data were few and were found at one station only, so had a limited effect on the results; therefore, the missing data were filled using simple linear regression with neighbouring stations with R2 > 0.8. The causes behind floods were also investigated by analysing the relations between flood events and climate indices.
Figure 1. Locations of hydrological stations, water reservoirs and irrigation areas in the Poyang Lake basin. The hydrological stations are: WZ: Waizhou; LJD: Lijiadu; MG: Meigang; DFK: Dufengkeng; HS: Hushan; WJB: Wanjiabu.
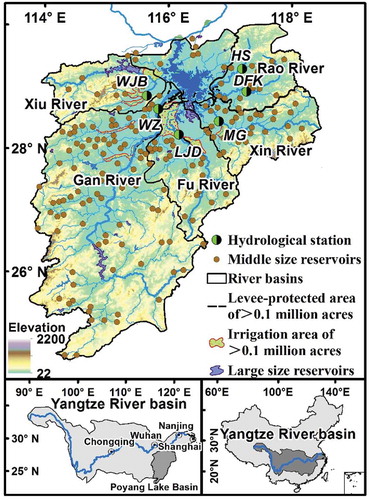
The climate indices considered in this study were the Indian Ocean Dipole (IOD), North Atlantic Oscillation (NAO), Pacific Decadal Oscillation (PDO) and El Niño/Southern Oscillation (ENSO). ENSO is the difference of sea surface temperature (SST) in the Niño 3.4 index (5°N–5°S, 120°W–170°W). Monthly ENSO data covering the period 1952–2005 were extracted from the Climate Prediction Centre of National Oceanic and Atmospheric Administration (http://www.cpc.ncep.noaa.gov/products/analysismonitoring/ensostuff/ensoyears.shtml). The IOD is a kind of ocean–atmosphere coupling phenomenon and is defined by the Dipole Mode Index (DMI). The intensity of the IOD is represented by an anomalous SST gradient between the western equatorial Indian Ocean (50°E–70°E and 10°S–10°N) and the southeastern equatorial Indian Ocean (90°E–110°E and 10°S–0°N) (Yamagata et al. Citation2003). The IOD data covering the period 1952–2005 were obtained from JAMSTEC (Japan Agency for Marine–Earth Science and Technology) (http://www.jamstec.go.jp/frsgc/research/d1/iod/iod/dipole_mode_index.html). The PDO index is the leading principal component of monthly sea-surface temperature variability. The PDO data were extracted from the US National Oceanic and Atmospheric Administration (NOAA; http://www.esrl.noaa.gov/psd/data/correlation/pdo.data). The NAO is defined as a meridional dipole in the atmospheric pressure (Moore et al. Citation2013). The NAO index data were extracted from the Climate Prediction Centre of the NOAA (http://www.cpc.ncep.noaa.gov/products/precip/CWlink/pna/nao.shtml). The influence of flooding on agriculture was also investigated by analysing the relationship between occurrence rates of floods and agricultural disaster. Flood-affected crop area, flood-damaged crop area and crop failure area data were collected for 1955–2005 from the Ministry of Agriculture, China (http://202.127.42.157/moazzys/zaiqing.aspx). The crop area data were collected for 1955–2005 from the National Bureau of Statistics. The crop area and flood-affected area data are the annual series for the whole Poyang Lake basin.
3 Methodology
3.1 Peaks-over-threshold (POT) based definitions of flood indices
Nine flood indices were analysed in this study (). Flood series were obtained using two techniques, i.e. annual peak flow and a POT-based sampling technique that helps gain information on flood magnitude, occurrence rate and timing of flood events. The independence of flood peaks was calculated by using the independence criteria between two successive peaks given by (Lang et al. Citation1999):
Table 1. Information on the nine flood indices used in this study.
and
where θ denotes waiting time between two flood peaks; and Qmin denotes the minimum flow between two successive peaks Q1 and Q2.
Using POT series can avoid insufficient annual maximum series regarding the use of a single event per year. In addition, POT series supply more information about flood magnitude and timing, especially for the waiting time between two successive peaks and the clustering in time. Lang et al. (Citation1999) recommended that the average number of flood events exceeding 2–3 per year be the POT series. In this study, a mean number of flood events of 2.4–3 per year was adopted at each gauging station, being the same as that used in our previous study (Zhang et al. Citation2016).
3.2 Trends and change points of flood series
The rank-based nonparametric Mann-Kendall (M-K) test (Mann Citation1945, Kendall Citation1975), which is less sensitive to outliers than parametric statistics, was used. To avoid the influence of serial persistence on M-K test results, the modified M-K (MMK) trend test was used, using the computation algorithm discussed by Hamed and Rao (Citation1998). For detection of change points in hydrological series, many techniques are available, such as the rank-sum (R-S) test (Mann and Whitney Citation1947), sliding T and sliding F tests (Patrick and Shlomo Citation1999), as well as the M-K test (Mann Citation1945, Kendall and Gibbons Citation1990). Comparing the performances of 10 change-point test methods, Lei et al. (Citation2007) found that the R-S test was more accurate to detect change points, it has more flexibility and can show the probability of the change point. The algorithm of the R-S test can be found in Patrick and Shlomo (Citation1999).
3.3 Temporal clustering in occurrence rates of floods
Analysis of the monthly occurrence rates of floods helps to identify dormant or active flood periods. Monthly occurrence rates of floods can be computed as (Cunderlik et al. Citation2004):
where nm is the number of days of the mth month; Fm is the annual accumulative occurrence rate of floods during the mth month; N denotes the total occurrence rate of POT-based sampled floods; FFm denotes the occurrence rate of floods during the mth month; and and
are the 95% confidence intervals of FFm. If occurrence of floods is not seasonal, then FFm should be 1/12.
The degree of clustering in flood occurrences can be characterized by the dispersion index (D). Mumby et al. (Citation2011) analysed the temporal clustering behaviour of tropical cyclones and its ecosystem impacts using the dispersion index, D:
where Z(T) is the series of annual flood occurrences for a time window T; and var(Z(T)) denotes the variance of the series of annual flood occurrences. A positive value of D implies a larger degree of dispersion of the POT-based sampled flood series and shows temporal clustering of floods with active and dormant periods. The bootstrap technique was used to quantify the confidence interval for D, and the Lagrange multiplier statistic (LM) was used to evaluate the significance level of D under a 5% significance level (Therneau and Grambsch Citation2000):
where denotes the long-term annual average number of floods.
3.4 Nonparametric evaluation of occurrence rates of floods
The occurrence rate of the time-dependent extreme events can be computed as (Mudelsee et al. Citation2003, Citation2004):
where Tn is the timing of the nth flood event with unit of day; m is the number of flood occurrences based on the POT sampling technique; K(·) is the Gaussian kernel function; and h is the width of the kernel function. The Gaussian kernel function is a widely used kernel function which can use Fourier space and produce a smoothed estimation of the occurrence rate of extreme events (Mudelsee et al. Citation2003, Citation2004). Since no data are outside the interval, there will be a boundary bias near the boundary for the Gaussian kernel function. This boundary effect can be reduced by generating pseudodata. The pseudodata were produced using a mapping technique (Mudelsee et al. Citation2004), in which pT is the pseudodata outside the time interval of [t1, tm] for the POT sampling-based series. For t < t1, pT[i] = t1 − [Ti − t1], and the same procedure was used for t > tm. The extended series was 1.5 times longer than the original one. The computation of λ(t) for the extended data series was based on:
where is the timing of the nth flood event; and m* is the sample size of the extended data series. The selection of window width, h, determines the bias and variance properties of the occurrence rate estimator. A small window width results in fewer data points that effectively contribute to the kernel estimation, which will substantially influence the randomness of λ(t); a too large window width may cause over-smoothing of the data series, hence resulting in a small variance and increased bias. Therefore, the cross-validation method was used to determine the bandwidth (Mudelsee et al. Citation2003). To analyse the annual change in λ(t) without considering seasonal changes within the year, the bandwidth should be longer than 365.25 days. The bootstrap technique can be combined to enable uncertainty analysis of the occurrence rate of floods. Details of the bootstrap algorithm can be found in Mudelsee et al. (Citation2004).
4 Results
4.1 Choice of threshold values for POT-based flood sampling
The mean number of over-threshold flood events (MnT) was computed with the interval of [1,10] and curves for MnT, MET and D were drawn, as illustrated in Figure 2, for Waizhou station as a case study. The dispersion index, D, was used to decide whether or not the number of over-threshold flood events followed the Poisson distribution with a confidence interval of 95%. It can be seen from that when the threshold values lie in the range 4500–7009 m3/s, the MnT values increase with the increase in threshold values and they are linearly related. ) also indicates that MnT would follow the Poisson distribution when D ranges within the interval of 95%. Furthermore, ) shows that when the threshold values are less than 7009 m3/s, the value of MnT meets the requirements that MnT should be greater than 2. Thus, the threshold value for the sampling of flood events at the Waizhou station should be 7009 m3/s, and MnT = 2.42. Selection of a threshold value for the sampling of flood events helped produce the POT-based sampled flood series at the Waizhou station, i.e. 123 flood events. Similarly, the threshold values for sampled flood events at the other hydrological stations, Lijiadu, Meigang, Dufengkeng, Hushan and Wanjiabu, were, respectively, 2169, 3469, 1461, 1729 and 746 m3/s, and related MnT values were, respectively, 2.52, 2.83, 2.46, 2.51 and 2.62. These threshold values were used to obtain the POT-based sampled flood series at each individual hydrological station for further analysis.
Figure 2. Threshold values of flood events based on POT-based sampling at Waizhou station in the Poyang Lake basin. Grey lines and dashed horizontal lines represent the 95% confidence interval.
4.2 Changing properties of flood indices
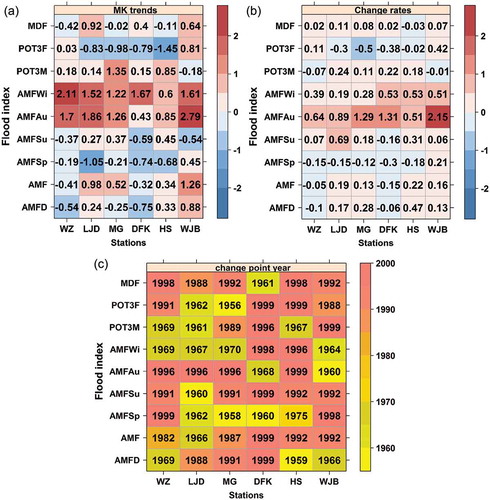
Trends and detection of change points of nine flood indices were done as shown in Figure 3. ) shows that AMF presents increasing trends at Lijiadu, Meigang, Hushan and Wanjiabu stations, and is decreasing at Waizhou and Dufengkeng stations. The change points of AMF at hydrological stations of the lake basin were mainly during the 1980s–1990s, except for Lijiadu station where the change point of AMF was in 1966 ()). The flood magnitude increased by 19%, 13%, 22% and 16% after the change points at Lijiadu, Meigang, Hushan and Wanjiabu stations, respectively. However, a decrease of 5% and 15% in the flood magnitude was observed at Waizhou and Dufengkeng stations, respectively ()). Decreasing trends of AMF were found mainly during spring and summer, and particularly during spring. However, increasing trends of AMF were dominant during autumn and winter. The increase of AMF during winter can be attributed to the wetting tendency of winter (Zhang et al. Citation2014). Specifically, a decrease of, respectively, 15%, 15%, 12%, 30% and 18% in the spring AMF can be detected after the change points at Waizhou, Lijiadu, Meigang, Dufengkeng and Hushan stations. However, an increase of 21% in the spring AMF flood magnitude was found at Wanjiabu station after 1998. Increasing trends of summer AMF were observed at Lijiadu, Meigang and Hushan stations with change points during 1960, 1991 and 1992 and the increase rate was 69%, 18% and 31%, respectively. Increasing autumn AMF was found at all six stations; in particular, the increase of autumn AMF at Wanjiabu station was significant at the 95% confidence level ()). Also, the change points mainly appeared after the 1990s and the change rates were more than 51% ()). The POT3F was increasing at Waizhou and Wanjiabu stations with change points during 1991 and 1988, and the increase of flood magnitude reached 11% and 42%, respectively. The POT3M presented increasing trends at Waizhou, Lijiadu, Meigang, Hushan and Dufengkeng stations, and decreasing trends at Wanjiabu station.
Figure 3. Changing properties of nine flood indices at hydrological stations across the Poyang Lake basin: (a) MK trends; (b) change rates before and after change points; and (c) the year of change point. Dark shaded numbers in (a) indicate that the trend is significant at the 95% confidence level. See for abbreviations of hydrological stations.
4.3 Temporal clustering in occurrence rates of floods
Figure 4 illustrates the occurrence rates of POT-based sampled flood series that were estimated using the kernel estimation method; the confidence interval was evaluated using the bootstrap resampling technique. Different changing properties of floods across the Poyang Lake basin were identified at different hydrological stations. Changes in the occurrence rates of floods at different stations had roughly similar properties. Two time intervals were identified with higher occurrence rates of flood events, i.e. between the late 1960s and the early 1970s, and the mid-1990s. The occurrence rates of floods at the Waizhou and Lijiadu stations exhibited moderate changes. The same time intervals with relatively high occurrence rates were also observed (between the late 1960s and the early 1970s, and the mid-1990s). However, the occurrence rates were not significantly higher than at other time intervals. Furthermore, flood events at all the hydrological stations across the basin had a decreasing tendency after the late 1990s. The occurrence rates of floods during the mid-1990s were higher than those during the late 1960s and the early 1970s. It seems that flood events entered a relatively dormant period after the late 1990s.
Figure 5 illustrates temporal patterns of different categories of floods across the lake basin. It can be seen from that, during the entire study period, the temporal patterns of different seasonal and annual floods were similar. However, numerous time intervals with relatively higher occurrence rates of floods can be identified. Generally, these time intervals are before and after the early 1970s, and the mid-1990s. Specifically, temporal clustering of floods was observed mainly at Meigang, Dufengkeng and Hushan stations. Floods occurred sporadically at the other three hydrological stations (Waizhou, Lijiadu and Wanjiabu), with weak temporal clustering of floods during the entire study period. Therefore, in general, floods in the lake basin are subject to temporal clustering. The dispersion index, D, can also be used to evaluate whether occurrence rates of floods follow the Poisson distribution and hence can be used to evaluate the clustering effect of floods. The dispersion indices of POT frequency series are listed in . It can be seen that the dispersion indices of occurrence rates of floods at all the hydrological stations are larger than 0, implying active and/or dormant flood periods. Specifically, the dispersion index of POT3F at Dufengkeng station is statistically significant at the 5% significance level, indicating a significant temporal clustering effect of flood behaviour. The temporal patterns of occurrence rates of floods () and the dispersion index results () reveal the temporal clustering of floods, which is in line with the results of the kernel estimation method ().
Table 2. Dispersion index, D, and related statistical confidence levels of the peaks-over-threshold frequency (POT3F) series at hydrological stations across the Poyang Lake basin.
Figure 4. Temporal variations of occurrence rates of floods with 95% confidence intervals (grey area) at hydrological stations across the Poyang Lake basin. MDF: days of POT-based flood occurrence (d). See for abbreviations of hydrological stations.
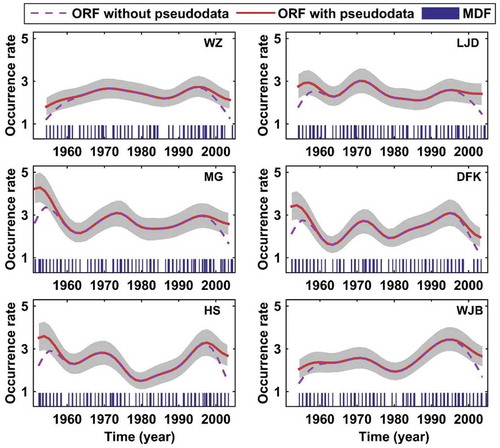
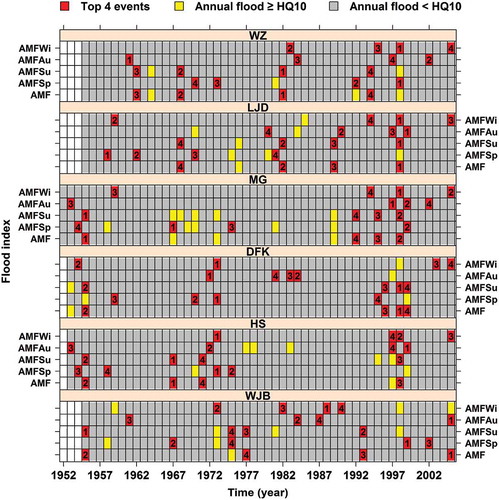
Figure 5. Temporal distribution of the top four largest flood events and a flood event with a return period of >10 years at hydrological stations across the Poyang Lake basin. Numbers in dark shaded (red) cells represent the order of the top four events. See for abbreviations of hydrological stations.
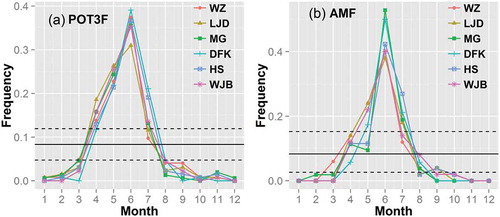
To further understand intra-annual flood behaviour, Figure 6 demonstrates the temporal variations of AMF- and POT-based sampled flood series. Long-term daily average streamflow curves were used to compare AMF- and POT-based sampled flood behaviour. It can be seen from that most of the extreme floods captured by AMF are belong to the POT-based sampled floods. The POT series supply more information about floods, not only their magnitude and timing, but also the flood frequency. This shows that analysing POT-based sampled floods is necessary to comprehensively study flood characteristics. However, POT3M is not a continuous time series, which is troublesome in analysing the changing characteristics of flood magnitude, and the MDF is the mean days of POT-based flood flow, which is not the real timing of a flood. Therefore, it is appropriate to adopt both the AMF- and POT-based samples to comprehensively analyse magnitude, occurrence rates and the time of occurrence of floods. also shows a significant temporal clustering of flood events; higher magnitude floods tend to appear in periods of high flood frequency and this has the potential to pose serious challenges for mitigation of flood hazards and management of water resources. Figure 7 illustrates seasonal variations of monthly flood frequency, and helps identify active and/or dormant flood periods. It can be observed from that the highest occurrence rates of floods were observed during June, with an occurrence rate of floods >0.3. Comparatively, higher occurrence rates of floods were observed during April to July, which were significant at 5% significance level, implying that the time interval from April to July is the active flood period.
Figure 6. Annual distribution of AMF, POT3M and long-term annual average streamflow processes at hydrological stations across the Poyang Lake basin. Solid curves denote four times the long-term annual average streamflow for the sake of easy visual comparison. Vertical grey lines (bars) represent the flood dates obtained from the POT dates. See for abbreviations of hydrological stations.
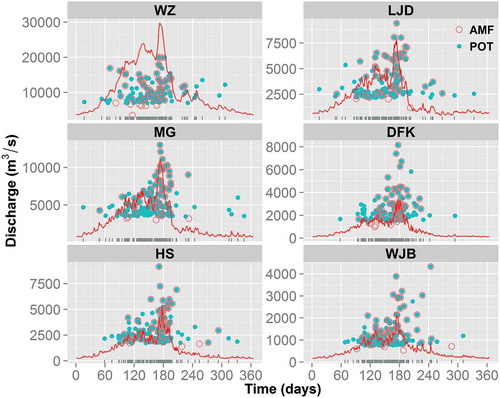
Figure 7. Monthly flood frequency of POT-based sampled floods and annual maximum floods at hydrological stations across the Poyang Lake basin. Dashed lines represent the upper and lower bounds of the 95% confidence interval. See for abbreviations of hydrological stations.
4.4 Relationship of floods indices to climate indices
To further understand the changing properties of flood magnitude, occurrence rate and occurrence timing in the Poyang Lake basin, the Pearson correlation coefficients were computed between these three variables and four climate indices: IOD, PDO, NAO and ENSO (Fig. 8). shows positive correlations between the IOD of the previous year and flood indices AMF, AMFSp, AMFSu, AMFWi and POT3F (see ). A significant positive correlation was detected between the IOD of the previous year and POT-based sampled flood regimes at Waizhou, Meigang and Hushan stations. Moreover, a positive correlation was also identified between the IOD of the previous year and AMFSu at Lijiadu station, AMF and AMFSu at Meigang station and AMFSp at Wanjiabu station. However, the Pearson correlation coefficients were not significant between the IOD of the same year and flood magnitude and POT3F. It should be noted here that a positive correlation was detected between the IOD of the same year and AMFD, and correlations between the IOD of the same year and AMFD at Lijiadu, Meigang and Wanjiabu stations were statistically significant.
Figure 8. Correlation coefficients between climate indices and flood indices at the hydrological stations across the Poyang Lake basin. Prefixes 0_ and 1_ denote climate indices of 0 and 1 year ahead, respectively. Dark shaded numbers indicate that the correlation is significant at the 95% confidence level. See for abbreviations of hydrological stations.
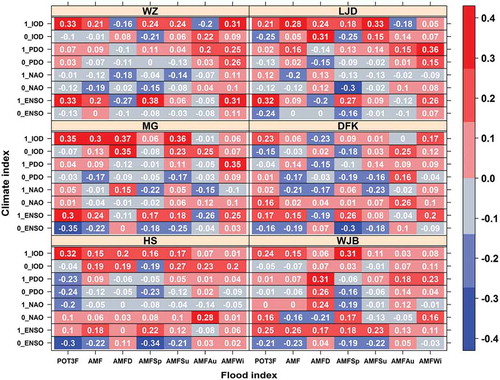
The PDO of the previous year had a significant positive correlation with AMFWi at Lijiadu and Meigang stations and AMFD at Wanjiabu, but did not have a significant correlation with other flood indices. The PDO of the same year and NAO of the previous year did not have a significant correlation with any of the flood indices. Therefore, the PDO and NAO of the same year have no obvious relationship with the flood magnitude, frequency and occurrence timing. The ENSO of the previous year and the IOD of the previous year had positive correlations with all the flood indices at most of the stations. Significant correlations were found between ENSO and POT3F at Waizhou, Lijiadu and Meigang stations. Further, ENSO had significant correlation with AMFSp, while it had negative correlations with the same year of POT3F and AMFSp at all the stations, and significant negative correlations with POT3F at Meigang and Hushan stations and with AMFSp at Dufengkeng and Hushan stations. In general, the IOD had significant correlation with the flood magnitude and occurrence rate of the next year. Moreover, the IOD had an influence on the timing of occurrence of floods. The cold phase of ENSO triggered higher occurrence rates of floods and enhanced AMFWi. In contrast, the warm phase of ENSO had a significant correlation with flood magnitude and occurrence rates in the next year. The PDO and NDO, however, did not impact on the flood magnitude, occurrence rates and occurrence timing across the lake basin.
4.5 Analysis of AMF and POT3F under different phases of ENSO and IOD
The analyses described in Section 4.4 indicate that the flood characteristics in the Poyang Lake basin are related to the IOD and ENSO. Meanwhile, AMF and occurrence rates of floods are the main components of the flood risk system. Thus, in this section, we attempt to further consider the correlation of warm and/or cold phases of the IOD and ENSO with AMF and occurrence rates of POT-based sample flood series (Fig. 9). In , the positive (negative) IOD and ENSO are associated with the warm (cold) phase IOD and ENSO, and the positive (negative) AMF and POT3F anomaly means larger (smaller) magnitude and higher (lower) frequency than mean AMF and POT3F. It can be seen from )–(d) that POT3F and AMF are negatively correlated with the same-year ENSO, but positively related to the last-year ENSO. A closer look at indicates that about 75% of larger AMF (twice the mean AMF) and higher POT3F (twice the mean POT3F) happened in the year of a cold phase of ENSO, and about 75% of higher POT3F happened in the next year of a warm phase of the IOD, showing that most of the larger magnitude floods and higher occurrence rates of flood tended to occur in the year of a cold phase of ENSO and the next year of a warm phase of ENSO. However, the IOD tends to have impacts on POT3F and AMF of the next year ()–(h)), but the correlation between IOD on POT3F and AMF of the same year is not significant ()–(g)), implying a distinctly different degree of correlation between the climate index and the flood magnitude and occurrence rates of the same year and those of the next year.
Figure 9. Box plots of statistical relationships between AMF and POT3F. Suffixes _0 and _1 denote climate indices of 0 and 1 year ahead, respectively. The whiskers of boxes are the maximum and minimum of all the data in the corresponding grades. The left (right) quartile comprises 25% of data less (greater) than this value. Each box plot shows six hydrological stations combined (313 samples).
4.6 Impact of floods on the crop area
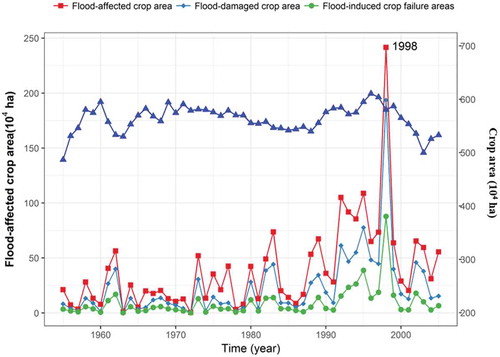
The Poyang Lake basin is an important source of agricultural products in China. Figure 10 illustrates temporal variations of flood-affected crop area, flood-damaged crop area and crop failure area in the Poyang Lake basin. It can be seen from that the change range of the crop area is relatively small, and the change in flood impact area is inconsistent with the change in crop area. shows that main influencing factor for flood-affected and flood-damaged crop area and crop failure area is flooding, rather than change in crop area. The long-term annual average flood-affected crop area, flood-damaged crop area and crop failure area are, respectively, 3.92 × 10⁵, 2.33 × 10⁵ and 0.91 × 10⁵ ha, with an increasing tendency. During the period 1963–1972, the flood-affected and flood-damaged crop areas and crop failure area were smaller overall; this is likely because fewer big floods occurred in this period. Besides, negligible flood-affected crop area, flood-damaged crop area and crop failure area were observed in 1960, 1963, 1965, 1972, 1978, 1979, 1985, 1986 and 1987, and these years were free of flooding regimes (). The 1990s were dominated by the highest flood occurrence rate (); in addition, the 1990s were also characterized by highly frequent floods and particularly the four largest flood events (). Therefore, flood-affected crop area, flood-damaged crop area and crop failure area were the largest during the study period; during the 1990s, these areas were, respectively, 9.58 × 10⁵, 6.40 × 10⁵ and 2.69 × 10⁵ ha, accounting for 16.3%, 10.9% and 4.6% of the total drainage area of the basin. Similar to the 1990s, the 1970s was also dominated by a high flood occurrence rate, although the number of big flood events was less than in the 1990s and, therefore, the respective areas were also less than in the 1990s. Changes in the flood-affected crop area, flood-damaged crop area and crop failure area have close relationships with the occurrence rates of floods and the frequency of big flood events, implying significant impacts of flood hazards on agriculture production.
Figure 10. Temporal variations of flood-affected crop area, flood-damaged crop area and crop failure area of the whole Poyang Lake basin. The upper line represents the long-term crop area (right-hand y-axis) of the whole Poyang Lake basin.
5 Discussion
There are 208 water reservoirs and 10 irrigation systems in the Poyang Lake basin, wherein there are seven irrigated areas each with an area of larger than 1 × 10⁵ ha. In the Gan River alone there are 107 water reservoirs with a total water storage capacity of 7.51 × 10⁹ m3. The locations of these water reservoirs are shown in . Numerous floods with a peak flood flow of 1 × 10⁴ m3/s or greater have occurred in the study area. Hydrological regulation helps to reduce peak flood flow, which should be the reason for the reduction of annual peak flood flow in the Gan River basin and other river basins in the Poyang Lake basin. Afforestation has been undertaken in the basin since the 1980s and this has increased the forest coverage to 60.05%. Forests can, to a certain degree, reduce the peak flood flow, but they exert no evident influence on large flood events resulting from long-lasting heavy precipitation (Xu Citation2000). The forest cover of the Raohe River basin is the largest amongst the five tributaries, with a forest coverage of 67.8%, which may be the reason for the reduction in annual peak flood flow in the Raohe River at Dufengkeng station.
The Pingyuan Irrigation System, completed in 1960, is the largest agricultural irrigation facility in the basin. The long-term annual human withdrawal of water resources from the Fu River basin, Lijiadu station, has reached 3.76 × 10⁸ m3, accounting for 29.6% of the total annual streamflow of the Fu River. The large-scale human withdrawal of water reduces the streamflow, especially in the spring when more water is needed for irrigation. In general, the flood occurrence rate at Lijiadu station and spring AMF had a decreasing tendency, showing the impact of withdrawal of water on flood occurrence rate in the Fu River basin. The above analyses indicate that water reservoirs, forests and also artificial withdrawal of water by irrigation facilities have different impacts on floods. Generally, water reservoirs and forests have limited impacts on peak flood flows. Therefore, floods of the lake basin are influenced mainly by precipitation extremes (Zhang et al. Citation2011).
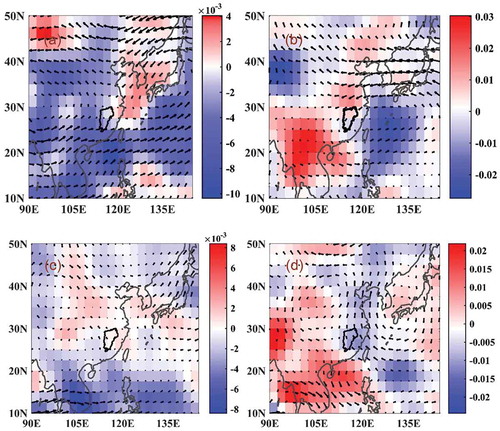
The above analyses indicate that frequent floods were observed during the spring and summer in the Poyang Lake basin. In order to clarify the influence of climate indices on flooding, based on the NCAR/NCEP reanalysis dataset, the field patterns of 850 hPa wind anomalies and 500 hPa vertical velocity anomalies during spring and summer with respect to the climate indices ENSO_1 and IOD_1 are illustrated in Figure 11. A negative vertical velocity means ascending motion, which results in vapour condensation and increases in the amount and intensity of precipitation, further affecting the frequency and magnitude of floods. ) shows that Poyang Lake basin is dominated by negative vertical velocity, corresponding to positive phase ENSO_1 in spring, which increased precipitation in the Poyang Lake basin; this further proves the positive correlation between ENSO_1 and the flood frequency and magnitude. In particular, negative vertical velocity is more obvious in the southwestern part of Poyang Lake, and this is in line with spring AFM at Waizhou which is in significant positive correlation with ENSO_1. ) and (c) shows that the correlations between ENSO_1 and vertical velocity in spring, and between IOD_1 and vertical velocity in summer are not evident, and this is also reflected in the correlation analysis results shown in . It can be seen from ) that Poyang Lake basin is dominated by negative vertical velocity in summer, corresponding to the positive phase of the IDO; this proves the positive influence of IOD_1 in summer on precipitation, and further influence on floods. Besides, it has been illustrated in the foregoing that the influences of climate indices on flood are different in each tributary. The spatiotemporal patterns of precipitation are influenced mainly by the East Asian monsoon system (Zhang et al. Citation2011). Chen et al. (Citation2013) pointed out that the warm phase of ENSO can cause the weakening of the East Asian summer monsoon of the next year. However, Weaker East Asian summer monsoons tend to increase the precipitation extremes in the middle and lower Yangtze River basin. Hence, the warm phase of ENSO can help enhance precipitation extremes in the middle and lower Yangtze River basin and vice versa. Zhang et al. (Citation2014) indicated that the largest 1-day and the largest consecutive 5-day precipitation regimes are positively related to the ENSO events of the last year. ENSO impacts floods of the lake basin via its influence on precipitation changes of the subsequent year. Yuan et al. (Citation2008) indicated that the warm phase of IOD usually enhances the West Pacific subtropical high at 500 hPa in the summer of the following year, which causes the strengthening of the ridge in the westward direction and hence the intensifying Asian summer monsoon. This is the major cause for the intensification of precipitation in the upper and middle Yangtze River basin. Also, the concurrence of the warm phases of both ENSO and IOD was found to further strengthen the West Pacific High (Chakravorty et al. Citation2013) and, therefore, the warm phases of ENSO and IOD combine to intensify precipitation extremes of the next year in the Poyang Lake basin and hence increase the peak flood flow and flood occurrence rates across the basin. These research results are in good agreement with the results of the current study.
Figure 11. Regression of anomalous patterns of wind (vectors: m/s) at 850 hPa and vertical velocity at 500 hPa in (a) spring with respect to ENSO_1; (b) spring with respect to IOD_1; (c) summer with respect to ENSO_1; and (d) summer with respect to IOD_1.
6 Conclusions
In this study, the magnitude, occurrence rate and timing of floods in the Poyang Lake basin were analysed based on annual and seasonal AMF- and POT-based sampled flood series. The nonstationarity and uncertainty were analysed using the kernel density estimation and bootstrap resampling methods. Monthly frequency analysis and dispersion index were used to evaluate annual and inter-annual variations in the temporal clustering of floods. Also, the causes behind clustering and nonstationarity of floods were investigated, based on the relationship between flood indices and climate indices, such as the IOD, NAO, PDO and ENSO. The differences in degree of correlation between the different phases of climate indices and peak flood flow and flood occurrence rates were also analysed. The following conclusions may be drawn from this study:
Annual, autumn and winter AMF and POT3M mainly exhibit an increasing tendency. The occurrence rate of floods at Lijiadu station has a decreasing tendency. Generally, two periods with higher occurrence rates of floods were identified: from the late 1960s to the early 1970s, and the mid-1990s. However, the highest occurrence rates of floods were observed mainly during the 1990s. Active flood activities can usually be observed at most hydrological stations across the Poyang Lake basin during the 1990s.
The occurrence rates of floods in Poyang Lake basin are in evident fluctuation. A persistent increase in flood occurrence rates can be detected after the 1990s, especially in 1998. Temporal clustering of floods is detected at hydrological stations across the lake basin. Losses of agricultural production, reflected in flood-affected crop area, flood-damaged crop area and crop failure area, are observed mainly during the 1990s, and the 1990s is also the time interval dominated by the highest flood occurrence rates, implying large impacts of flood hazards on agricultural production. Significant clustering of floods processes serious challenges for mitigation of flood hazards across the basin.
The flood magnitude and occurrence rate of the following year are positively related to ENSO and IOD. The indices PDO and NAO have no significant impacts on floods of the lake basin. The ENSO and IOD are the principle climate indices having significant impacts on flood activities of the basin. The ENSO has a significant impact on the flood occurrence rate and on annual maximum streamflow during spring. It may be noted here that the flood control function of water reservoirs is greatly limited by the design standard of hydraulic facilities. Besides, forests can, to a certain degree, reduce the peak flood flow, but exert no evident influence on large flood events resulting from long-lasting heavy precipitation. Thus, the spatiotemporal pattern of precipitation extremes directly affects the spatiotemporal pattern of flooding across the Poyang Lake basin.
Acknowledgments
Our cordial gratitude is extended to the co-editor, Professor Attilio Castellarin, Editorial Manager, Ms Frances Watkins, and three anonymous reviewers for their professional and pertinent comments and suggestions, which were very helpful for the further quality improvement of this manuscript. Detailed information such as data can be obtained by writing to the corresponding author at [email protected].
Disclosure statement
No potential conflict of interest was reported by the authors.
Additional information
Funding
References
- Alan, D.Z., et al., 2003. Detection of intensification in global- and continental-scale hydrological cycles: temporal scale of evaluation. Journal of Climate, 16, 535–547. doi:10.1175/1520-0442(2003)016<0535:DOIIGA>2.0.CO;2
- Apurv, T., et al., 2015. Impact of climate change on floods in the Brahmaputra basin using CMIP5 decadal predictions. Journal of Hydrology, 527, 281–291. doi:10.1016/j.jhydrol.2015.04.056
- Burn, D.H., Sharif, M., and Zhang, K., 2010. Detection of trends in hydrological extremes for Canadian watersheds. Hydrological Processes, 24, 1781–1790. doi:10.1002/hyp.v24:13
- Chakravorty, S., Chowdary, J.S., and Gnanaseelan, C., 2013. Spring asymmetric mode in the tropical Indian Ocean: role of El Niño and IOD. Climate Dynamics, 40 (5–6), 1467–1481. doi:10.1007/s00382-012-1340-1
- Chen, P. and Chen, X., 2012. Spatio-temporal variation of flood vulnerability at the Poyang Lake ecological economic zone, Jiangxi Province, China. Water Science & Technology, 65 (7), 1332–1340. doi:10.2166/wst.2012.027
- Chen, W., Feng, J., and Wu, R., 2013. Roles of ENSO and PDO in the link of the East Asian winter monsoon to the following summer monsoon. Journal of Climate, 26 (2), 622–635. doi:10.1175/JCLI-D-12-00021.1
- Cunderlik, J.M., Ouarda, T.B., and Bobée, B., 2004. On the objective identification of flood seasons. Water Resources Research, 40 (1). doi:10.1029/2003WR002295
- Easterling, D.R., et al., 2000. Climate extremes: observations, modeling, and impacts. Science, 289, 2068–2074. doi:10.1126/science.289.5487.2068
- Gao, G., et al., 2007. Trend of estimated actual evapotranspiration over China during 1960–2002. Journal of Geophysical Research, 112, D11120. doi:10.1029/2006JD008010
- Hamed, K.H. and Rao, A.R., 1998. A modified Mann-Kendall trend test for autocorrelated data. Journal of Hydrology, 204 (1–4), 182–196. doi:10.1016/S0022-1694(97)00125-X
- Huntington, T.G., 2006. Evidence for intensification of the global water cycle: review and synthesis. Journal of Hydrology, 319, 83–95. doi:10.1016/j.jhydrol.2005.07.003
- Kendall, M.G., 1975. Rank correlation methods. London: Griffin.
- Kendall, M.G. and Gibbons, J.D., 1990. Rank correlation methods. 5th ed. London: Edward Arnold, Oxford University Press.
- Kundzewicz, Z.W., et al., 2014. Flood risk and climate change: global and regional perspectives. Hydrological Sciences Journal, 59 (1), 1–28. doi:10.1080/02626667.2013.857411
- Lang, M., Ouardab, T.B.M.J., and Bobee, B., 1999. Towards operational guidelines for over-threshold modeling. Journal of Hydrology, 225, 103–117. doi:10.1016/S0022-1694(99)00167-5
- Le Cam, L.M., 1961. A stochastic description of precipitation. Proceedings of the Fourth Berkeley Symposium on Mathematical Statistics and Probability, 3, 517–528.L.
- Lei, H., Xie, P., and Chen, G., 2007. Comparison and analysis on the performance of hydrological time series change-point testing methods. Water Resource Power, 25 (4), 36–40. (in Chinese with English abstract).
- Liu, J., et al., 2017. Contribution of multiple climatic variables and human activities to streamflow changes across China. Journal of Hydrology, 545, 145–162. doi:10.1016/j.jhydrol.2016.12.016
- Ma, D.G., et al., 2007. Farmers vulnerability to flood risk: a case study in the Poyang Lake Region. Journal of Geographical Sciences, 03, 321–332.
- Mailier, P.J., Stephenson, D.B., and Ferro, C.A.T., 2006. Serial clustering of extratropical cyclones. Monthly Weather Review, 134 (8), 2224–2240. doi:10.1175/MWR3160.1
- Mann, H.B., 1945. Nonparametric tests against trend. Econometrica, 13, 245–259. doi:10.2307/1907187
- Mann, H.B. and Whitney, D.R., 1947. On a test of whether one of two random variables is stochastically larger than the other. The Annals of Mathematical Statistics, 18 (1), 50–60. doi:10.1214/aoms/1177730491
- Milly, P.C.D., et al., 2007. Stationarity is dead. Ground Water News & Views, 4 (1), 6–8.
- Moore, G.W.K., Renfrew, I.A., and Pickart, R.S., 2013. Multidecadal mobility of the North Atlantic oscillation. Journal of Climate, 26 (8), 2453–2466. doi:10.1175/JCLI-D-12-00023.1
- Mudelsee, M., et al., 2003. No upward trends in the occurrence of extreme floods in central Europe. Nature, 425, 166–169. doi:10.1038/nature01928
- Mudelsee, M., et al., 2004. Extreme floods in central Europe over the past 500 years: role of cyclone pathway “Zugstrasse Vb”. Journal of Geophysical Research: Atmospheres, 109, D23101. doi:10.1029/2004JD005034
- Mumby, P.J., Vitolo, R., and Stephenson, D.B., 2011. Temporal clustering of tropical cyclones and its ecosystem impacts. Proceedings of the National Academy of Sciences of the United States of America, 108 (43), 17626–17630. doi:10.1073/pnas.1100436108
- Nakayama, T. and Watanabe, M., 2008. Role of flood storage ability of lakes in the Changjiang River catchment. Global and Planetary Change, 63, 9–22. doi:10.1016/j.gloplacha.2008.04.002
- Patrick, D.B. and Shlomo, S.S., 1999. Increasing physicians’ awareness of the impact of statistics on research outcomes: comparative power of the t-test and Wilcoxon Rank-Sum test in small samples applied research. Journal of Clinical Epidemiology, 52 (3), 229–235. doi:10.1016/S0895-4356(98)00168-1
- Shankman, D., Keim, B.D., and Song, J., 2006. Flood frequency in China’s Poyang Lake region: trends and teleconnections. International Journal of Climatology, 26, 1255–1266. doi:10.1002/(ISSN)1097-0088
- Silva, A.T., Portela, M.M., and Naghettini, M., 2012. Nonstationarities in the occurrence rates of flood events in Portuguese watersheds. Hydrology and Earth System Sciences, 16 (1), 241–254. doi:10.5194/hess-16-241-2012
- Sun, Z., et al., 2012. Precipitation patterns and associated hydrological extremes in the Yangtze River basin, China, using TRMM/PR data and EOF analysis. Hydrological Sciences Journal, 57 (7), 1315–1324. doi:10.1080/02626667.2012.716905
- IPCC (Intergovernmental Panel on Climate Change), 2013. Summary for policymakers. In: T.F. Stocker, et al., eds. Climate change 2013: the physical science basis, contribution of working group I to the fifth assessment report of the intergovernmental panel on climate change. Cambridge, UK: Cambridge University Press.
- Therneau, T.M. and Grambsch, P.M., 2000. Modeling survival data: extending the Cox model. New York: Springer.
- Villarini, G., et al., 2009. On the stationarity of annual flood peaks in the continental United States during the 20th century. Water Resources Research, 45, W08417. doi:10.1029/2008WR007645
- Villarini, G., Smith, J.A., and Napolitano, F., 2010. Nonstationary modeling of a long record of rainfall and temperature over Rome. Advances in Water Resources, 33, 1256–1267. doi:10.1016/j.advwatres.2010.03.013
- Vitolo, R., et al., 2009. Serial clustering of intense European storms. Meteorologische Zeitschrift, 18 (4), 411–424. doi:10.1127/0941-2948/2009/0393
- Xu, J., 2000. Streamflow and sediment variations in the upper reaches of Changjiang River and its tributaries due to deforestation. Journal of Hydraulic Engineering, 1, 72–80. (in Chinese with English abstract).
- Yamagata, T., et al., 2003. Comments on “dipoles, temperature gradients, and tropical climate anomalies”. Bulletin of the American Meteorological Society, 84, 1418–1422. doi:10.1175/BAMS-84-10-1418
- Yilmaz, A.G., 2015. The effects of climate change on historical and future extreme rainfall in Antalya, Turkey. Hydrological Sciences Journal, 60 (12), 2148–2162. doi:10.1080/02626667.2014.945455
- Yuan, Y., et al., 2008. Influences of the Indian Ocean dipole on the Asian summer monsoon in the following year. International Journal of Climatology, 28 (14), 1849–1859. doi:10.1002/joc.v28:14
- Zhang, Q., et al., 2011. Hydrological extremes in the Poyang Lake basin, China: changing properties, causes and impacts. Hydrological Processes, 25 (20), 3121–3130. doi:10.1002/hyp.v25.20
- Zhang, Q., et al., 2012. Scaling and clustering effects of extreme precipitation distributions. Journal of Hydrology, 454–455, 187–194. doi:10.1016/j.jhydrol.2012.06.015
- Zhang, Q., et al., 2014. Max-stable based evaluation of impacts of climate indices on extreme precipitation processes across the Poyang Lake basin, China. Global and Planetary Change, 122, 271–281. doi:10.1016/j.gloplacha.2014.09.005
- Zhang, Q., et al., 2015. Evaluation of flood frequency under non-stationarity resulting from climate indices and reservoir indices in the East River basin, China. Journal of Hydrology, 527, 565–575. doi:10.1016/j.jhydrol.2015.05.029
- Zhang, Q., et al., 2016. Magnitude, frequency and timing of floods in the Tarim River basin, China: changes, causes and implications. Global and Planetary Change, 139, 44–55. doi:10.1016/j.gloplacha.2015.10.005