
ABSTRACT
An extreme value analysis (EVA) point process approach has been implemented to examine the flood characteristics of Puerto Rico when tropical cyclones (TCs) are present in the discharge series and when they are removed from it. Mean daily discharge values that exceeded the 99th percentile thresholds were used in both the TC and non-TC data series. In nine of the 12 stations the maximum discharge was associated with a TC, with hurricanes Hortense (1996), Georges (1998) and Eloise (1975) responsible for most of the maximum peaks at each site. Percentage changes in the generalized extreme value parameters, which include location (central tendency), scale (variance) and shape (skewness), between the TC and non-TC data exhibited a decrease in the majority of stations. Stations in the eastern interior and central region of the island showed the largest decrease in all parameters, in flood occurrences and in return periods when TCs were removed from the series.
Editor R. Woods; Associate editor C. Perrin
1 Introduction
The island of Puerto Rico is known to experience extreme floods associated with heavy rainfall from the passage of tropical cyclones (TCs), which are intense low-pressure systems that develop in the tropics and can bring strong winds, extreme precipitation and lead to flash floods in countries in their path. As a tropical island, Puerto Rico receives a lot of precipitation, especially in the north and central regions of the island, where rainfall can range from 3000 to 4300 mm annually (Picó Citation1974). Orographic influences cause rainfall to be unevenly distributed across the island, with the northern region experiencing more rainfall through the year than the southern region (Colon 2008). This variability of rainfall over space and time causes different hydrological responses to extreme precipitation events in the island. The flood hydrology of Puerto Rico is of concern and interest because of the high frequency of extreme unit discharge flood peaks relative to other locations in the USA (O’Connor and Costa Citation2004). During the hurricane season months (June–November) TCs play an important role in the flood hydrology of extreme events on the island (Scatena and Larsen Citation1991, Larsen and Simon Citation1993, Larsen and Torres-Sanchez Citation1998).
The TCs that impact the east Caribbean, where Puerto Rico is located, tend to develop in the mid hurricane season, with August and September being the months with the higher frequency of events (Elsner and Kara Citation1999). It is well known that Atlantic basin TCs that impact the island of Puerto Rico are affected by atmospheric–oceanic oscillations such as the El Niño Southern Oscillation (ENSO) and the Atlantic Multi-decadal Oscillation (AMO). The ENSO has been found to affect rainfall in the Caribbean since it causes shifts in wind direction (dominant westerlies during El Niño and dominant easterlies during La Niña) and a weakening of the dominant trade winds, which also influence tropical cyclone development (Gray Citation1984, Poveda et al. Citation2006). The AMO has been found to influence rainfall variability in North America and it has been associated with changes in the frequency of droughts and intense hurricanes in the Atlantic sector (Knight et al. Citation2006).
Many of the record peak measurements in Puerto Rico were associated with tropical cyclones, such as Hurricane Donna in September 1960 (Barnes and Bogart Citation1961), Hurricane Hortense in September 1996 (Torres-Sierra Citation1997) and Hurricane Georges in September 1998 (Larsen and Román Citation2001). The extreme floods associated with these TCs led to devastating impacts that have translated into billions of dollars in losses. Several TCs have caused severe damage to the island of Puerto Rico over the last 50 years. Tropical storm Eloise (1975) dropped heavy precipitation over the island, with some areas in the central region receiving more than 500 mm (Colón 2009), flash floods causing 34 fatalities (Hebert Citation1976) and losses of US$458 million (Pielke et al. Citation2003). Another major hurricane was Georges (1998), associated with strong winds, heavy rainfall and floods that led to more than US$2 billion in losses (Bennet and Mojica Citation1998, Pasch et al. Citation2001) Two other major hurricanes were David (1979), with US$200 million in losses and seven fatalities in the island, and Hortense (1996), with flooding events that caused 18 fatalities and damages of US$128 million (Hebert Citation1980, Pasch and Avila Citation1999).
Even though some researchers have explored the hydrological response associated with tropical cyclone rainfall over the island for a few intense hurricanes, no study has looked at a climatology of TCs that includes tropical depressions and tropical storms, which can also produce extreme flood events over the island. For that reason, the main purpose of this study is to examine the statistical characteristics of extreme flood events over Puerto Rico and their relationship with tropical cyclones by implementing extreme value analysis (EVA).
Studies that looked at the relationship between TCs and floods have varied in their scope and scale, with some looking at the regional hydrological response to these events (O’Connor and Costa Citation2004, Villarini and Smith Citation2010) and others focusing on a more local scale (Waylen Citation1991, Kostaschuk et al. Citation2009). O’Connor and Costa (Citation2004) examined the spatial distribution of floods in the USA and found that Puerto Rico and Hawaii together account for 32% of the observed record flows in the 99th percentile of unit discharges, although they only represent less than 5% of all observations in the study. These tropical island locations exhibit such high unit discharge characteristics, especially in their windward areas, since they are in the path of the northeasterly winds, where mountains force the moist air to rise and enhance the rainfall associated with local convective storms and tropical cyclones (Colon 2008).
One of the main methods implemented to examine the relationship between floods and TCs is the general extreme value (GEV) distribution (Coles et al. Citation2001), which allows the examination of upper tail properties of flood peaks. Morrison and Smith (Citation2002) found that a number of flood records in central Appalachia have anomalously large values of the estimated GEV shape parameter. Recent studies of floods in the USA have implemented the use of GEV probability distributions to investigate whether TCs control the upper tail of the flood peak distribution (Villarini and Smith Citation2010, Citation2013). One of these studies focused on the relationship between floods and TCs in the eastern USA, where the GEV distribution was implemented in order to compare the shape (skewness) parameter of the entire discharge series and the series without tropical cyclones. It was found that, when peaks associated with TCs are removed, there is a reduction in the shape parameter, which shows that floods associated with TCs tend to have heavier tails (Villarini and Smith Citation2010). They also found that TCs had a larger influence on the upper tails of the flood distribution east of Appalachia and in coastal areas between Florida and New England. However, a more recent study of TCs and floods in Texas found that tropical cyclones tend to have a weaker influence on flood peaks when compared to the GEV shape parameter of other locations in the eastern USA (Villarini and Smith Citation2013).
The main purpose of this study is to examine the relationship between extreme flood events in Puerto Rico and tropical cyclones over the island. Mean discharge data from 12 stations in 12 different drainage basins in Puerto Rico for the 1970–2010 period were used. Tropical cyclone 6-hourly track data from 86 TCs were used in order to identify the floods associated with the different storms that impacted the island during the period. Floods were defined as exceedence of the 99th percentile of the entire mean discharge series at each of the 12 stations. An extreme value analysis (EVA) point process approach was implemented to determine if TCs strongly affected the properties of the GEV distribution parameter location (central tendency), scale (variance) and shape (skewness) of the mean discharge time series for each of the 12 stations with 41 years of data. First, the point process model was fitted to the entire mean discharge data at each station and then the model was implemented again using the series with flood peaks associated with TCs removed. The GEV parameters of the entire discharge series and the series without TCs were retrieved in order to compare them and determine if there were any statistical differences between the two sets of parameters. Maps of percentage change between the GEV parameters were generated to visually compare the differences between the location, scale and shape of the entire series and the one with TCs removed. The maps also served to examine the spatial characteristics of the floods in the different stations over the island. Flood frequencies and return periods were also calculated from the GEV parameters to examine the differences between the occurrence of floods between the two series. The TCs that produce the largest floods in most of the stations were identified in order to examine the relationship between extreme floods and tropical cyclone rainfall.
2 Data and methods
2.1 Data
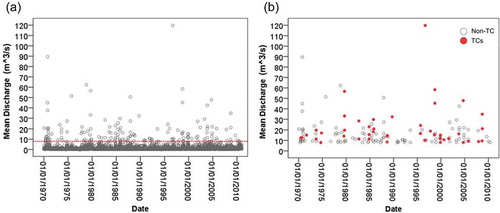
Daily mean discharge data were obtained for 12 stations with complete data (14 975 daily observations) for the time period 1970–2010 (41 years) for the island of Puerto Rico (). The daily mean discharge data were obtained from the United States Geological Survey (USGS) National Water Information System and approved for analysis for all of the stations in this study (). The 12 stations were located in 12 different water drainage basins across the island from east to west, with areas ranging from 20.71 to 517.1 km2. The size of the drainage basin is an important factor when it comes to the streamflow characteristics of each station, with larger basins capturing more water from rainfall, hence having higher discharge values than smaller basins (O’Connor and Costa Citation2004). This factor is relevant when it comes to defining a flood in stations covering water basins of different sizes. In the absence of a universal practical physical threshold that could be applied to all 12 stations in the different basins, this study defines a flood as a mean discharge value in the 99th percentile of the entire data distribution at each station. By implementing the statistical instead of the physical approach when defining floods over different basins, we treated each daily mean discharge series equally, since only the most extreme flood peaks (99th percentile) are examined. The scatter plots of one of the stations show the entire series of mean daily discharge and the extreme flood peaks in the 99th percentile of the flood distribution, with the flows associated with TCs highlighted (). It is important to note that normalized discharge by catchment area was also investigated, yet it had very little effect on parameter estimates or changes in parameters once TCs were removed.
Figure 1. The island of Puerto Rico and the stations with complete daily discharge data for the 1970–2010 period and their respective drainage basins.
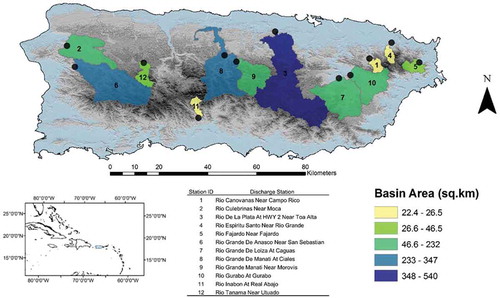
Table 1. Stations with complete daily discharge for the 1970–2010 period.
Figure 2. Scatter plots of (a) the entire series of mean daily discharge data, with 99th percentile shown as dotted line; and (b) the 99th percentile series of mean daily discharge, with floods associated with TCs highlighted for the station at Rio Canovanas near Campo Rico.
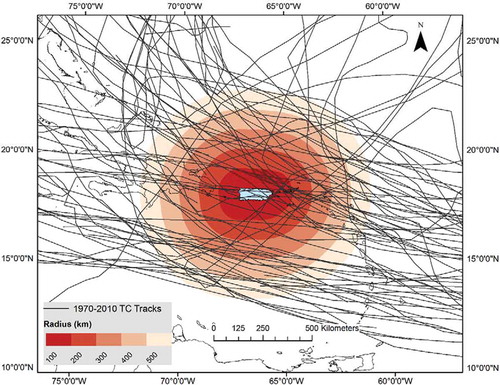
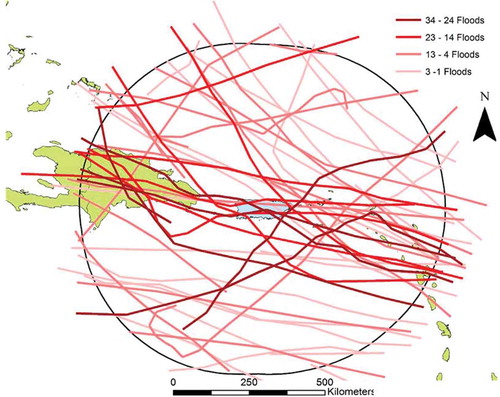
Six-hourly TC track data for all TCs that might have impacted the island of Puerto Rico during the 1970–2010 period were obtained from the International Best Track Archive for Climate Stewardship (IBTrACS) (Knapp and Kruk Citation2010). The TC track data were entered in a geographic information system (GIS), in which a 500-km radius buffer was implemented to select the storms that could have brought significant rainfall to the island and caused floods (). The same selection radius has been used by other studies that examined tropical cyclones and their associated rainfall over Puerto Rico (Boose et al. Citation2004, Hernández Ayala and Matyas Citation2016). Flooding related to TCs was identified by associating a flood peak with a cyclone if the centre of the storm was within 500 km of the island’s coast in a time frame of two days before and seven days after the passage of the TC (Villarini and Smith Citation2013). The implementation of the search radius and time window allows us to capture the spatiotemporal extent of the rainfall associated with a TC, its specific characteristics (proximity of centre to land, intensity and translation speed) and the moisture environment in which the storm is embedded. In order to examine the moisture environments of the TCs, precipitable water (TPW) data were obtained from the National Center for Environmental Prediction and National Center for Atmospheric Research (NCEP/NCAR) re-analysis dataset (Kalnay et al. Citation1996). The closest four cells to the island were selected to calculate an average TPW for each storm; a similar calculation was done by Hernández Ayala and Matyas (Citation2016) to examine the relationship between moisture and tropical cyclone rainfall in Puerto Rico.
Figure 3. Tracks of all 86 TCs that passed within a 500 km radius of the coast of Puerto Rico.
2.2 Extreme value analysis point process approach
Extreme value analysis (EVA) using a point process approach is utilized to model the statistical characteristics (central tendency, variance and skewness) of extreme flood events (99th percentile) over Puerto Rico for 12 entire daily mean discharge time series and a series in which flood peaks associated with TCs have been removed. This method combines existing approaches in the modelling of extremes, specifically the annual maximum series (AMS) and the partial duration series (PDS), also known as the peaks-over-threshold approach (POT). The AMS and PDS approaches have been used extensively in different studies looking at hydrological or climatological events above high/low thresholds (Waylen Citation1988, Waylen and LeBoutillier Citation1989, Waylen et al. Citation2012).
The point process approach has advantages over both traditional approaches of modelling extremes, as it can model the frequency and magnitude of events in a single point process rather than separately as in the POT, and it also includes all of the available extreme data above a specific threshold, and thus leads to more reliable results (Embrechts et al. Citation1997, Coles et al. Citation2001, Tomassini and Jacob Citation2009, Keellings and Waylen Citation2015). This study uses the point process approach to obtain maximum likelihood estimates of the location (central tendency), scale (variance) and shape (skewness) parameters of the limiting GEV distribution to examine the statistical characteristics of extreme floods associated with TCs over Puerto Rico. Other methods based on Bayesian estimation have been found to produce more realistic estimates when it comes to the probability of extremes; however, this study focuses on how past TCs influenced the flood distribution at different sites, so the focus is not on the probability of future floods. Therefore, the Bayesian techniques are not implemented here (Sisson et al. Citation2006).
Through the point process approach, the GEV annual maximum and POT can be combined by fitting the GEV using the POT method, but still in terms of the GEV parameterization (Coles et al. Citation2001, Katz et al. Citation2002, Radermacher and Tomassini Citation2012, Keellings and Waylen Citation2014). The point process approach is formulated in terms of the limiting GEV parameters: scale μ, location σ and shape ξ, and as a result the extreme properties of the x variable are defined by those three parameters (Coles et al. Citation2001). The cumulative distribution function of the GEV is given by:
The magnitude of the flood event or cluster maxima, within a POT framework, follows a generalized Pareto distribution (GPD). The cumulative distribution function of a GPD is given by (Coles et al. Citation2001):
The parameters of the limiting GEV and those of the corresponding POT approach are directly related through (Davison and Smith Citation1990):
These transformations are then used to define a Poisson process with rate parameter lambda (Λ) derived from the estimated scale parameter σ, shape parameter ξ and location parameter μ, and u equal to the threshold (Equation (3)). Considering N independent events exceeding a threshold, u, N~Poisson(Λ) where (Keellings and Waylen Citation2014):
The first step before introducing the mean daily discharge series from the 12 stations individually into the point process model was to decluster the data. This study considered a flood to be a single event if it was separated by more than three days of below threshold (99th percentile) values. For example, a tropical cyclone could cause significant rainfall over a given area in a short time period, while having a lag in the hydrological response, which can produce above-threshold discharge for a couple of days; if the values go below that threshold for at least three days and then exceed the threshold on the fourth day, the new values will be considered to be part of a different event. It is important to note that declustering was also done on flood events that were separated by five days of below-threshold (99th percentile) values, and the results were similar to those with the three-day decluster. After declustering the series with TCs and the series with TCs removed, they were both introduced in the point process model.
The location, scale and shape parameters of both series were retrieved and compared to determine if TCs had an influence on the central tendency, variance and skewness of the mean daily discharge of extreme flooding events. Percentage differences between each of the GEV parameters and derived estimates of lambda for frequency of events were calculated to see if there was a reduction or an increase in their values when TCs were removed from the data. GEV-derived estimates of the 10- and 20-year return periods (i.e. the flood peaks with 5 and 10% chance of occurrence in any year) were also calculated to investigate the impact of removal of TCs. These percentage change calculations were also mapped to examine the spatial distribution of the different GEV parameters, event frequency, return period estimates, and their corresponding changes when TCs were removed from the data series. The top flood-producing TCs were identified and their characteristics in terms of rainfall, moisture and proximity to land were examined in order to explore their relationship with the extreme floods. All of the calculations in this paper were computed in R using the freely available extRemes and ismev packages (Coles et al. Citation2001, see http://www.r-project.org/).
3 Results and discussion
3.1 Descriptive statistics
Of the 86 TCs that passed within a 500-km radius of Puerto Rico, only 51 (59%) were associated with individual flood peaks at or above the 99th percentile threshold used to identify the most extreme discharge values at all of the stations. Tropical cyclones were responsible for the maximum value of mean daily discharge in 75% of the stations (). As expected, larger drainage basins had higher mean discharge values than smaller basins, and for that reason the 99th percentile was useful in identifying changes from one series (TCs included) to another (TCs removed). All of the stations reflected a reduction in the mean discharge when TCs were removed from the series, yet this decrease varied from station to station, with those located in the eastern interior region of the island showing the largest percentage decreases of their means (10–14%). Similar TCs were responsible for multiple flood peaks in different stations around the island. Among the TCs responsible for most of the extreme floods we find powerful hurricanes, Georges (1998), Hortense (1996), Hugo (1989) and David (1979). These hurricanes were associated with heavy rainfall over the island since their centres, characterized by intense convective thunderstorm activity, were relatively close to land, and the storms were also embedded in high-moisture environments which promoted high precipitation accumulations (Hernández Ayala and Matyas Citation2016). Hurricanes were not the only storms responsible for the first, second and third maximum flood peaks in some of the stations; here, tropical depressions and storms Eloise (1975), Isabel (1985) and Jeanne (2004) also produced extreme discharge events throughout the island (). Tropical depression Eloise dropped heavy rainfall throughout the island, with values above 500 mm in the central mountains region (Colon 2008), floods and landslides causing 34 fatalities (Hebert Citation1976), and total losses of US$458 million (Pielke et al. Citation2003).
Table 2. The 99th percentile of all sites and the descriptive statistics of maximum and mean daily discharge (m3/s) for the entire series, the series with TCs removed, and the three maximum flood events, with their respective TCs or dates (month/day/year).
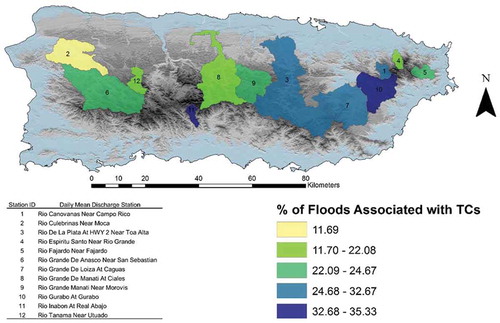
Before discussing the results of the point process model it is important to identify the stations in the island that exhibited the highest percentage of flood peaks associated with TCs. Here, all of the daily mean discharge values at or above the 99th percentile threshold for each station were retrieved, and the ones associated with TCs were identified. A spatial pattern of the percentage of contribution to flood peaks by TCs is evident, with the majority of stations in the eastern interior region of the island exhibiting larger percentages than those located farther west (). This is expected, since TCs move east to west around the island and tend to deposit higher rainfall amounts on the windward-facing mountains of the eastern part of the island (O’Connor and Costa Citation2004). The highest flood peak contributions (%) are found in the eastern interior and in the south central region of the island, while the lowest are in the westernmost station. A higher percentage of flood peaks in the east tends to be more associated with the passage of TCs than those in the west, which means that more extreme (99th percentile) flood-generating processes in the west might be the product of a combination of phenomena such as local convective thunderstorms, west to east moving troughs and cold fronts (Colon 2008). It is important to note that this map only shows the percentage of the number of flood peaks associated with the passage of TCs and not the results of the point process model.
Figure 4. Percentage of mean daily discharge values above the 99th percentile threshold (floods) that were associated with the passage of TCs.
3.2 GEV parameter estimates
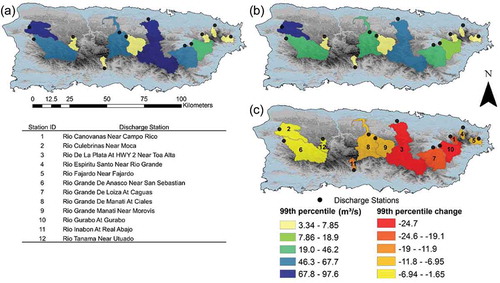
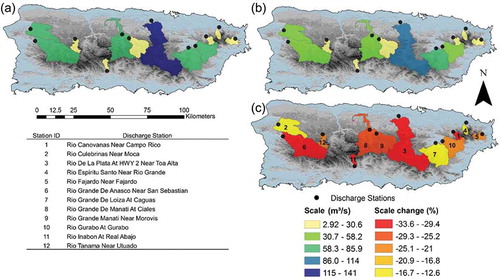
Before looking at the GEV parameters product of the point process approach it is important to examine the spatial distribution of the 99th percentile, since this was the flood definition for all stations in this study. Removing TCs from the data series resulted in a reduction of the 99th percentile threshold which ranged from 1.6 to 24.7%. The stations with the largest reduction (−11 to −24.7%) are located in the eastern interior of the island, which shows that the basins lying mostly to the southeast are the ones where TCs tend to have the strongest influence on extreme flood peaks (). It is important to note that there are two stations in the northeast of the island that exhibit low change (1.8–7.8%), which shows once again that not all areas in the east have similar hydrological responses to the passage of TCs. A general reduction in percentage decrease of the 99th percentile threshold is evident as we move to the central and western parts of the island; these changes show that TCs have a stronger influence on extreme floods in the eastern interior and tend to decrease toward the central and western parts of the island.
Figure 5. (a) Daily mean discharge above the 99th percentile of the entire series; (b) the series with TCs removed; and (c) percentage change between the series.
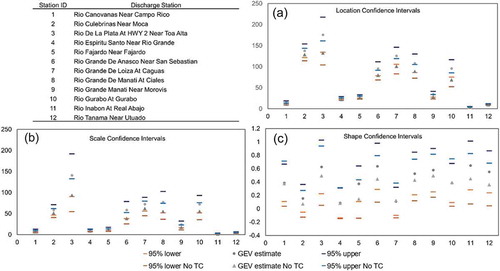
Point process model fits are shown for two example basins (). The QQ plots for all basins exhibit good fit between the models and extreme observations. All GEV parameter estimates and 95% confidence intervals about those estimates are shown in . In all basins, estimates of all three GEV parameters were reduced after the removal of TCs from the series. Stations in the eastern interior and central mountains region of the island exhibited larger decreases in the GEV parameters when TCs were removed from the series. However, it should be noted that the 95% confidence intervals of the TC and non-TC GEV parameter estimates overlap in some of the stations ().
Figure 6. QQ diagnostic plots of empirical and model quantiles for (a, c) series with TCs included and (b, d) series with TCs removed: (top) Rio de la Plata station (east) and (bottom) Rio de Añasco near San Sebastian (west).
Figure 7. Confidence intervals from the point process model for GEV parameters (a) location, (b) scale and (c) shape, for all 12 discharge stations with TCs included and removed from the series (No TC).
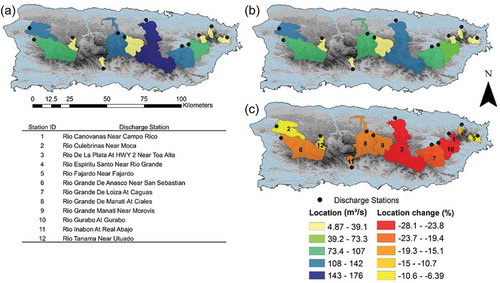
Results from the point process model for the GEV location parameter reveal that all of the stations had a decrease in their mean daily discharge when the flood peaks associated with TCs were removed from the series (). It is important to note that the larger drainage basins tend to have the higher location (mean) parameter values since these cover larger areas in which more tropical cyclone rainfall will tend to fall. The reduction in the location parameter varied over the island, with the largest decrease (–28%) found in the Rio La Plata near Toa Alta watershed located in the eastern interior of the island ()) and the lowest (−6.3%) found in the westernmost drainage basin at Rio Culebrinas near Moca. The location percentage decreases for the stations in the central parts of the island show a higher variance in their values, ranging from −6.3 to −19.4%. This is expected, since this area of the island is a transitional area between the east and the west, where rainfall associated with TCs tends to exhibit higher variability. The two stations in the northeast of the island exhibit similarities to the two stations at the opposite side of the island in the northwest in their location reduction; this might be due to the fact that these locations receive lower amounts of rainfall associated with the passage of TCs when compared to other areas in the east. The stations with the largest decrease in the location parameter are in drainage basins of different sizes, which reinforces the selection of the 99th percentile as the method for identifying extreme floods across all 12 stations.
Figure 8. GEV location parameter for (a) the entire series and (b) the series with TCs removed; and (c) percentage change between both series.
All of the stations also exhibited a decrease in the scale (variance) parameter when the flood peaks associated with TCs were removed from the series (). Higher percentage decreases were found in the drainage basins located in the central and western interior of the island, which means that when TCs are part of the series the variability in mean daily discharge over those places is higher than when they are not included ()). The scale percentage change for stations in the central part of the island had higher values (−33 to −25%), which shows once again that this region is a transitional area between the east and west, in which the rainfall associated with TCs tends to vary more (Hernández Ayala and Matyas Citation2017). The results for the station in Rio Añasco, located in the west with its drainage basin extending in to the western interior, show that when TCs are removed the variance in discharge values decrease by more than 32%. This confirms that TCs have a large impact on the variability of extreme floods in the central and western interior parts of the island. The scale parameter shares some similarities with the location parameter, since both identified the largest mean and variance decreases when TCs were removed from the series in stations in the eastern interior and central parts of the island; yet they also exhibit differences in the west, where the scale parameter shows a higher variance than the location parameter.
Figure 9. GEV scale parameter for (a) the entire series and (b) the series with TCs removed; and (c) percentage change between both series.
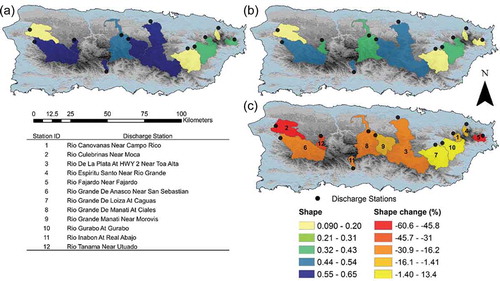
The results for the GEV shape parameter, which were found to be useful in examining the upper tail properties of the flood distribution, also exhibited some interesting changes when the entire series was compared to the one where TCs have been removed (). The largest shape parameter values, associated with thicker tails in the distribution, are found in watersheds located in the central and western interior of the island, while the lowest shape parameters are found in the northwest and northeastern regions ()). The shape (skewness) parameter decreased in all of the stations when TCs were removed from the series ()). However, those changes in the upper tail properties of the flood peak distribution were different for the 12 stations: three stations in the central region of the island exhibited large reductions (−31 to −16%) in their shape parameters when TCs were removed from the series, while the three stations located in the eastern interior exhibited smaller decreases ()). The three stations in the western part of the island exhibited high percentage decreases, while the stations in the northeast, with the exception of the easternmost station, exhibited low percentage decreases in the shape parameter when TCs were removed from the series. This means that TCs control the upper tail properties of the flood peak distribution in stations in the central and western interior regions, which reflects similarities with the patterns of the scale parameter. The GEV shape parameter has been used in other studies examining the upper tail properties of floods, e.g. in Appalachia, where Morrison and Smith (Citation2002) found that stations east of Appalachia tend to exhibit upper tail properties that are controlled by nearby TCs impacting the region. The shape parameter was also used to examine the role of TCs by Villarini and Smith (Citation2010, Citation2013), who found that TCs control the upper tail properties of flood distribution in coastal areas in the eastern USA, yet they do not seem to influence the upper tail properties of floods in Texas.
Figure 10. GEV shape parameter for (a) the entire series and (b) the series with TCs removed; and (c) percentage change between both series.
3.3 GEV lambda and return periods
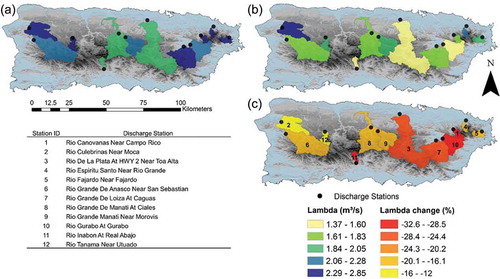
The results of the lambda values that were transformed from the location, scale and shape parameters for both series suggest that TCs have a complex influence on the mean number of flood occurrences on a yearly basis in different regions of Puerto Rico. A higher mean number of flood occurrences (2.06–2.85) was found in stations within eastern and western watersheds when floods associated with TCs were included in the series ()). However, when floods associated with TCs were removed from the series, there was a large reduction in the mean number of events per year in the eastern interior, while lower decreases were evident in the west ()). The largest decrease in the mean number of flood occurrences (−32.6 to −24.35%) was in the eastern interior region of the island and the lowest (−16.1 to −11.9%) was in the western region ()). Again, the stations located in the watersheds in the central region of the island tend to exhibit a higher variability in the mean number of flood occurrences in a year when TCs are removed from the series. This pattern is consistent with that exhibited by the scale and location parameters, and could be due to the fact that rainfall associated with TCs tends to exhibit high variability in the central region of the island (Hernández Ayala and Matyas Citation2017). The station in the Rio Gurabo, in the eastern interior of the island, exhibits the largest percentage change reduction (–32.6%), with a mean number of flood occurrences starting at 2.24 when TCs are present and decreasing to 1.51 when they are removed from the series. The lowest percentage reduction was in Rio Culebrinas near Moca, which ranged from 2.85 when TCs were present in the series to 2.51 when they were removed. The lambda values of the transformed GEV parameters show that one can expect a higher number of flood events (1.84–2.85) associated with TCs over a given year in the eastern interior and the central region of the island, and a lower number in the west. The stations in the smaller watersheds in the northeastern region of the island exhibit lower reductions in lambda when compared to those in the eastern interior and central mountains region, yet they exhibit larger reductions when compared to the stations farther west.
Figure 11. Lambda values of transformed GEV parameters for (a) the entire series and (b) the series with TCs removed; and (c) the lambda percentage change between both series.
Return period (10- and 20-year) estimates were calculated from the GEV parameters for each of the stations in order to examine the magnitude of a flood event (99th percentile) and the likelihood of its occurrence over a given period when floods associated with TCs are present and when they are removed from the series ( and ). For 10-year return periods when floods associated with TCs are present in the series, high values (361–874 m3/s) were recorded at stations located in the eastern interior, central and western interior regions of the island ()). When TCs are remove from the series there is a reduction in the 10-year return period in all of the stations in the island, yet the sites in watersheds that extend into the eastern interior, central and western interior regions of the island exhibit the largest decrease ()). The stations with the largest decrease in 10-year return periods were Rio La Planta near Toa Alta (eastern interior) and Rio Grande de Añasco (western interior), both exhibiting a percentage decrease of more than 40% when TCs are removed from the series.
Figure 12. 1The 0-year return period (m3/s) for (a) the entire series and (b) the series with TCs removed; and (c) the percentage change between the return periods of both series.
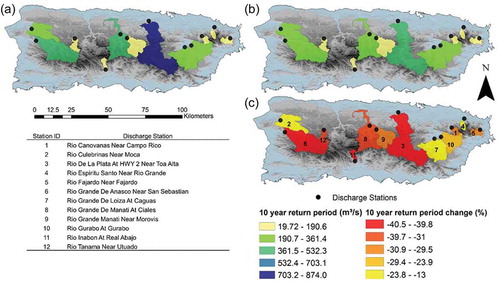
Figure 13. The 20-year return period (m3/s) for (a) the entire series and (b) the series with TCs removed; and (c) the percentage change between the return periods of both series.
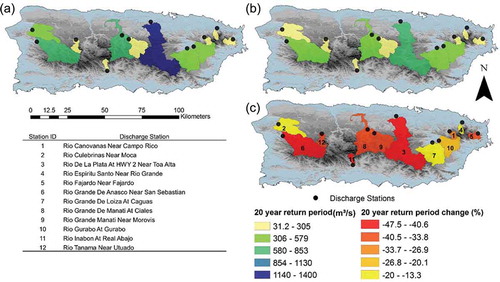
Similar results are found for the 20-year return period, with some stations in the eastern interior, central and western interior regions of the island exhibiting the largest decreases when TCs are removed from the series (), (b)). Again, the stations at Rio de La Plata and Rio Grande de Añasco exhibit the larger percentage change decreases (–45%); other stations within watersheds in the central mountains region also exhibited reductions of −40.6 to −33.7% ()). The 10- and 20-year return period patterns for Puerto Rico are similar to those exhibited by the GEV shape parameter, in which the largest changes were also detected in watersheds that extend toward the eastern interior, central and western interior regions.
3.4 Floods and tropical cyclone rainfall
Recent findings by Hernández Ayala and Matyas (Citation2016) suggest that tropical cyclone rainfall variability over Puerto Rico tends to be associated with changes in the storms’ centre distance to land and the surrounding moisture environments. They found that TCs that come within 230 km of the island’s coast and are embedded in moisture environments of total columnar precipitable water of 44.5 mm or more tend to be associated with mean tropical cyclone rainfall values of more than 50 mm for the entire island, with that value being considered an extreme event of precipitation over the daily basis (Jury and Sanchez Citation2009). When examining the individual daily flood peaks at the 99th percentile used to define extreme floods in all stations, the results () coincide with those of Hernández Ayala and Matyas (Citation2016). The TCs responsible for most of the individual flood peaks were Klaus (1984), followed by David (1979), Jeanne (2004) and Isabel (1985).
Table 3. Characteristics of TCs associated with the highest number of flood peaks over the 12 mean discharge stations. Cat: TC categories on the Saffir-Simpson scale; Max rain and Mean rain: maximum and minimum rainfall, in mm; TC distance at closest approach is in km; and moisture is in mm.
The top 15 individual flood-producing TCs had a mean tropical cyclone rainfall value of 147 mm for the entire island and on average their circulation centres came within 85.84 km of the island’s coast at their closest approach, with moisture environments averaging 48.64 mm. These findings suggest that the TCs associated with the largest number of individual flood peaks over Puerto Rico produce significant rainfall over the island, since their circulation centres associated with intense convection and thunderstorm activity were relatively close to land and embedded in high-moisture environments. It is important to note that eight of the 15 top flood-producing TCs were tropical depressions or tropical storms when they impacted the island, so the intensity of the storm does not necessarily translate into more floods. By observing the tracks of the 51 TCs that were associated with at least one flood over the island, it is evident that the storms that were closer to land caused a higher number of flood peaks than those farther away (). These closer TCs, which included hurricanes Hugo (1989), Hortense (1996) and Georges (1998), and tropical storms Klaus (1984) and Jeanne (2004), were also embedded in high-moisture environments exceeding 49.5 mm.
Figure 14. Tracks of the TCs associated with extreme flood peaks (99th percentile) over Puerto Rico.
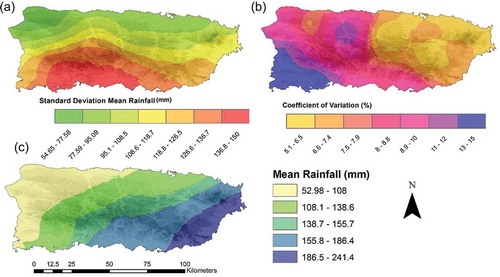
The rainfall associated with the passage of the top 15 flood-producing TCs explains the spatial distribution of floods that resulted when mapping the percentage changes in the location, scale and shape parameters between the entire series and the series without TCs. Averaging the rainfall associated with those TCs reveals a clear pattern of the spatial distribution of TC precipitation over Puerto Rico (). The southeast and central regions are identified as the areas of the island in which tropical cyclone rainfall tends to be highly concentrated, with mean values ranging from 155.8 to 241.4 mm ()). These results coincide with the findings of a recent study by Hernández Ayala and Matyas (Citation2017) which found that rainfall from TCs tends to be concentrated in the southeastern interior and central mountains regions of Puerto Rico. These are the areas where TCs had the strongest influence on the statistical properties of floods, which were identified by comparing the GEV parameters, location, scale and shape, for the entire series and the series without TCs. As we move to the west, rainfall associated with the passage of those top flood-producing TCs tends to decrease until it reaches a minimum in the western region of the island. This spatial pattern of rainfall also explains the weak effect that TCs have on flood distribution in the western region of the island, which simply means that rain associated with the passage of TCs is not the main force behind the largest flood peaks in that region ()). Standard deviation (SD) and coefficient of variation (CV) maps were also generated to examine the variability of rainfall associated with those top flood-producing TCs () and (b)). The SD of mean rainfall associated with TCs tends to be higher in the south and central regions of the island, while the CV exhibits higher percentages of variability in much of the western, central and southern parts of the island. This high variability in rainfall also explains the behaviour of the mean daily discharge in stations in the central and western interior of the island, which shows that TCs do not control many floods (99th percentile) in that area when compared to the eastern interior. However, some of the most extreme floods in the central and western interior regions have been associated with the passage of TCs.
Figure 15. Maps of (a) standard deviation, (b) coefficient of variation and (c) mean rainfall for the 15 TCs associated with the highest number of flood peaks.
4 Conclusions
This study focused on examining the relationship between extreme flood events over Puerto Rico and tropical cyclones. Mean daily discharge data for 12 stations with 41 years of observation for the time period 1970–2010 were selected to study the relationship. Floods were defined using a statistical approach, with the 99th percentile chosen to extract all of the extreme flood peaks in all of the 12 series. All tropical cyclones that passed within 500 km of the island’s coast were considered in this study, resulting in 86 storms. A flood event was associated with a tropical cyclone if the peak was observed two days before or seven days after the day of closest approach to land. An extreme value analysis (EVA) point process approach was chosen to model the statistical properties of the flood distribution of the different series by identifying changes in the GEV parameters location (central tendency or mean), scale (variance) and shape (skewness) which resulted from the model. The point process model was applied to the entire series of extreme flood peaks and the series without TCs. This was done to examine if there were any changes in the GEV parameters when TCs were removed from the data.
Of the 86 TCs identified in this study, only 51 produced at least one flood event (99th percentile) over Puerto Rico in the 1970–2010 period. Tropical cyclones tend to produce the highest count of individual flood peaks (>30%) in the eastern interior region of the island, while a general decrease in the percentage is observed as we move to the western region. The GEV parameters that resulted from the point process model of the entire series were compared to the results obtained when TCs were removed from the series. The location exhibits a decrease in all of the sites, yet decreases in the eastern interior are larger than those in the west and central areas of the island. This suggests that TCs tend to have a stronger effect on the central tendency of the flood peak distribution in stations in the eastern interior region of the island. When the scale (variability) of both series is compared, the central and western interior regions of the island exhibit the largest reduction in the parameter when TCs are removed from the series. This is due to the fact that rainfall associated with TCs tends to have a higher variability in the central and western regions of the island. The shape parameter, which has been used in previous studies to examine the upper tail behaviour of the flood distribution, was also found to change when TCs were removed from the series. The stations in the central and western interior regions of the island tend to have larger shape values when TCs are included in the series, while stations in the east tend to have a lower value of the shape parameter. The lower shape parameter values for the stations in the east might be due to the fact that tropical cyclone rainfall for top flood-producing TCs has a lower variance in that region, when compared to the TC rainfall variability of the central and western interior regions of the island.
The results from the GEV lambda values show that when floods associated with TCs are removed from the series there is a large reduction in the mean number of flood occurrences over a year in the eastern interior region of the island, while smaller decreases are evident in the west. The 10- and 20-year return period patterns for Puerto Rico are similar to those exhibited by the shape and scale parameters, in which the largest changes were also detected in watersheds that extend toward the eastern interior, central and western interior regions. The TCs that were responsible for many of the individual flood peaks had mean rainfall values of 147 mm for the whole island, were located at an average distance of 85.84 km from the island’s coast and were embedded in moisture environments with an average columnar precipitable water value of 48.6 mm. Hurricanes Hugo (1989), Hortense (1996) and Georges (1998), and tropical storms and depressions Eloise (1975), Klaus (1984) and Isabel (1985) were among the TCs closer to land that were embedded in high-moisture environments and produced a high number of individual flood peaks at the 99th percentile threshold. The spatial distribution of rainfall associated with the top individual flood-producing TCs exhibits a high concentration of precipitation in the eastern interior and central mountains region of the island, while a general decrease in rain is evident toward the west.
Disclosure statement
No potential conflict of interest was reported by the authors.
Additional information
Funding
References
- Barnes, H.H. and Bogart, D.B., 1961. Floods of September 6, 1960, in Eastern Puerto Rico. Vol. 451. US Government Printing Office.
- Bennet, S.P. and Mojica, R., 1998. Hurricane Georges preliminary storm report: from the tropical Atlantic to the United States Virgin Islands and Puerto Rico. San Juan, Puerto Rico: National Weather Service Weather Forecast Office, A NOAA National Weather Service NWSFO San Juan Official Report, 1–15.
- Boose, E.R., Serrano, M.I., and Foster, D.R., 2004. Landscape and regional impacts of hurricanes in Puerto Rico. Ecological Monographs, 74 (2), 335–352. doi:10.1890/02-4057
- Coles, S., et al., 2001. An introduction to statistical modeling of extreme values. Vol. 208. London: Springer.
- Davison, A.C. and Smith, R.L., 1990. Models for exceedances over high thresholds. Journal of the Royal Statistical Society. Series B (Methodological), 52 (3), 393–442.
- Elsner, J.B. and Kara, A.B., 1999. Hurricanes of the North Atlantic: climate and society. Oxford University Press.
- Embrechts, P., Kluppelberg, C., and Mikosch, T., 1997. Modelling Extremal Events for Insurance and Finance. Vol. 33. Berlin/Heidelberg: Springer-Verlag, 645 pp.
- Gray, W.M., 1984. Atlantic seasonal hurricane frequency. Part I: El Niño and 30 mb quasi-biennial oscillation influences. Monthly Weather Review, 112 (9), 1649–1668. doi:10.1175/1520-0493(1984)112<1649:ASHFPI>2.0.CO;2
- Hebert, P.J., 1976. Atlantic hurricane season of 1975. Monthly Weather Review, 104 (4), 453–465. doi:10.1175/1520-0493(1976)104<0453:AHSO>2.0.CO;2
- Hebert, P.J., 1980. Atlantic hurricane season of 1979. Monthly Weather Review, 108 (7), 973–990. doi:10.1175/1520-0493(1980)108<0973:AHSO>2.0.CO;2
- Hernández Ayala, J.J. and Matyas, C.J., 2016. Tropical cyclone rainfall over Puerto Rico and its relations to environmental and storm‐specific factors. International Journal of Climatology, 36 (5), 2223–2237. doi:10.1002/joc.2016.36.issue-5
- Hernández Ayala, J.J. and Matyas, C.J., 2017. Spatial distribution of tropical cyclone rainfall and its contribution to the climatology of Puerto Rico. Physical Geography, 1–20. doi:10.1080/02723646.2017.1354416
- Jury, M.R. and Sanchez, D.M., 2009. Composite meteorological forcing of Puerto Rican springtime flood events. Weather and Forecasting, 24 (1), 262–271. doi:10.1175/2008WAF2222151.1
- Kalnay, E., et al., 1996. The NCEP/NCAR 40-year reanalysis project. Bulletin of the American Meteorological Society, 77 (3), 437–471. doi:10.1175/1520-0477(1996)077<0437:TNYRP>2.0.CO;2
- Katz, R.W., Parlange, M.B., and Naveau, P., 2002. Statistics of extremes in hydrology. Advances in Water Resources, 25, 1287–1304. doi:10.1016/S0309-1708(02)00056-8
- Keellings, D. and Waylen, P., 2014. Increased risk of heat waves in Florida: characterizing changes in bivariate heat wave risk using extreme value analysis. Applied Geography, 46, 90–97. doi:10.1016/j.apgeog.2013.11.008
- Keellings, D. and Waylen, P., 2015. Investigating teleconnection drivers of bivariate heat waves in Florida using extreme value analysis. Climate Dynamics, 44 (11–12), 3383–3391. doi:10.1007/s00382-014-2345-8
- Knapp, K.R. and Kruk, M.C., 2010. Quantifying interagency differences in tropical cyclone best-track wind speed estimates. Monthly Weather Review, 138 (4), 1459–1473. doi:10.1175/2009MWR3123.1
- Knight, J.R., Folland, C.K., and Scaife, A.A., 2006. Climate impacts of the Atlantic multidecadal oscillation. Geophysical Research Letters, 33, 17. doi:10.1029/2006GL026242
- Kostaschuk, R., et al., 2009. Suspended sediment transport and deposition over a dune: Río Paraná, Argentina. Earth Surface Processes and Landforms, 34 (12), 1605–1611. doi:10.1002/esp.v34:12
- Larsen, M.C. and Román, A.S., 2001. Mass wasting and sediment storage in a small montane watershed: an extreme case of anthropogenic disturbance in the humid tropics. In: J.M. Dorava, D.R. Montgomery, B.B. Palcsak and F.A. Fitzpatrick, eds. Geomorphic Processes and Riverine Habitat. Washington, DC: American Geophysical Union, 119–138. doi:10.1029/WS004p0119
- Larsen, M.C. and Simon, A., 1993. A rainfall intensity-duration threshold for landslides in a humid-tropical environment, Puerto Rico. Geografiska Annaler. Series A. Physical Geography, 75, 13–23. doi:10.2307/521049
- Larsen, M.C. and Torres-Sanchez, A.J., 1998. The frequency and distribution of recent landslides in three montane tropical regions of Puerto Rico. Geomorphology, 24 (4), 309–331. doi:10.1016/S0169-555X(98)00023-3
- Morrison, J.E. and Smith, J.A., 2002. Stochastic modeling of flood peaks using the generalized extreme value distribution. Water Resources Research, 38 (12), 1305. doi:10.1029/2001WR000502
- O’Connor, J.E. and Costa, J.E., 2004. Spatial distribution of the largest rainfall‐runoff floods from basins between 2.6 and 26,000 km2 in the United States and Puerto Rico. Water Resources Research, 40 (1), W01107. doi:10.1029/2003WR002247
- Pasch, R.J. and Avila, L.A., 1999. Atlantic hurricane season of 1996. Monthly Weather Review, 127 (5), 581–610. doi:10.1175/1520-0493(1999)127<0581:AHSO>2.0.CO;2
- Pasch, R.J., Avila, L.A., and Guiney, J.L., 2001. Atlantic hurricane season of 1998. Monthly Weather Review, 129 (12), 3085–3123. doi:10.1175/1520-0493(2001)129<3085:AHSO>2.0.CO;2
- Picó, R., 1974. The geography of Puerto Rico. Chicago: Aldine Publishing Company.
- Pielke Jr, R.A., et al., 2003. Hurricane vulnerability in Latin America and the Caribbean: normalized damage and loss potentials. Natural Hazards Review, 4 (3), 101–114. doi:10.1061/(ASCE)1527-6988(2003)4:3(101)
- Poveda, G., Waylen, P.R., and Pulwarty, R.S., 2006. Annual and inter-annual variability of the present climate in northern South America and southern Mesoamerica. Palaeogeography, Palaeoclimatology, Palaeoecology, 234 (1), 3–27. doi:10.1016/j.palaeo.2005.10.031
- Radermacher, C. and Tomassini, L., 2012. Thermodynamic causes for future trends in heavy precipitation over Europe based on an ensemble of regional climate model simulations. Journal of Climate, 25 (21), 7669–7689. doi:10.1175/JCLI-D-11-00304.1
- Scatena, F.N. and Larsen, M.C., 1991. Physical aspects of hurricane Hugo in Puerto Rico. Biotropica, 23, 317–323. doi:10.2307/2388247
- Sisson, S.A., Pericchi, L.R., and Coles, S.G., 2006. A case for a reassessment of the risks of extreme hydrological hazards in the Caribbean. Stochastic Environmental Research and Risk Assessment, 20 (4), 296–306. doi:10.1007/s00477-005-0246-4
- Tomassini, L. and Jacob, D., 2009. Spatial analysis of trends in extreme precipitation events in high-resolution climate model results and observations for Germany. Journal of Geophysical Research, 114, D12113. doi:10.1029/2008JD010652
- Torres-Sierra, H., 1997. Hurricane Hortense: impact on surface water in Puerto Rico (No. 014-97). US Geological Survey.
- Villarini, G. and Smith, J.A., 2010. Flood peak distributions for the eastern United States. Water Resources Research, 46, 6. doi:10.1029/2009WR008395
- Villarini, G. and Smith, J.A., 2013. Flooding in Texas: examination of temporal changes and impacts of tropical cyclones. JAWRA Journal of the American Water Resources Association, 49 (4), 825–837. doi:10.1111/jawr.12042
- Waylen, P., Keellings, D., and Qiu, Y., 2012. Climate and health in Florida: changes in risks of annual maximum temperatures in the second half of the twentieth century. Applied Geography, 33, 73–81. doi:10.1016/j.apgeog.2011.06.007
- Waylen, P.R., 1988. Statistical analysis of freezing temperatures in Central and Southern Florida. Journal of Climatology, 8 (6), 607–628. doi:10.1002/joc.v8:6
- Waylen, P.R., 1991. Modeling the effects of tropical cyclones on flooding in the Santa Fe River basin, Florida. GeoJournal, 23 (4), 361–373. doi:10.1007/BF00193609
- Waylen, P.R. and LeBoutillier, D.W., 1989. The statistical properties of freeze date variables and the length of the growing season. Journal of Climate, 2 (11), 1314–1328. doi:10.1175/1520-0442(1989)002<1314:TSPOFD>2.0.CO;2