
ABSTRACT
A constrained total water-use policy has been implemented to maintain sustainable water supply in some water shortage areas. Managing a constrained water-use quota (T) in water allocation is a challenging goal. This paper proposes a new framework for water allocation under total water-use constraint by utilizing the concept of the Newsboy model, commonly used in operations management and applied economics, and applying it to the Dongjiang River Basin, South China. This framework considers T as a state variable of the objective function, rather than simply dealing with it as a constraint of multi-objective analysis. Using this framework, it is revealed how different schemes of T play out in water allocation, and water-use warning is provided for each sector and water governor in water resources management.
Editor A. Castellarin Associate editor R. Van Nooijen
1 Introduction
Water scarcity can be serious, especially in a region characterized by high-intensity water use or dry climate. In particular, under a changing environment, the spatiotemporal distribution of runoff will be more variable due to climate change and increasing off-stream water demands (water withdrawn from the river channel and used elsewhere) as population and economy growth continues (e.g. Rogers and Louis Citation2007, Hoekema and Sridhar Citation2011, Saleth Citation2011, Manzoni et al. Citation2014). Change of climate and the increase of water demand together make the water scarcity even worse, leading to a challenge for regional water resources security (Wolters et al. Citation2016). Moreover, there are long-term socio-economic effects of water investments and policy choices on water-use regulation (Brown et al. Citation2015). Based on this, a rigid constraint for total water-use amount, an administrative constraint approach to water resources management, has been set up in some developing regions for preventing the blind expansion of water use, particularly in high-intensity water-use regions (Li et al. Citation2015). For example, the Chinese government has implemented a new water resources management policy called “Three Red Lines” since 2011, one aspect of which is the policy of constrained total water use. On the one hand, specified constrained total and industrial water-use quotas were set on the national level; on the other hand, local governments were required to set their own constrained water-use quotas complying with the national control targets. The policy aims to relieve intensive water use, improve water-use efficiency, and provide a foundation for water-use security by punishment and incentive measures. Optimal water allocation can reduce the negative effect of uneven water resources distribution and temporally coordinate water demand and runoff (Condon and Maxwell Citation2013, Milano et al. Citation2013). It is thus viewed as an effective way to achieve water-use sustainability and economic efficiency. When implementing the constrained total water-use policy, as in China, a decision maker must ensure that water use for each sector is within its total water-use constraint. Lack of coordination in water resources allocation and management in a river basin often results in water deficits (Wolters et al. Citation2016). Hence, it is important to understand the relationships between water demand, water supply and constrained water-use quota (T), and in particular that the water allocation scheme is the regulation of water allocation within total water-use constraint, implying that limited water resources can still meet the majority of water demands in complex water supply systems.
The traditional water allocation models provide technical support for water resources management (Murray et al. Citation2012). They focus on the coordination of water demand and supply mainly by using the multi-objective optimal analysis (MOA) method (e.g. Masih et al. Citation2009, Beh et al. Citation2015, Porse et al. Citation2015, Salazar et al. Citation2016), water rights (Bekchanov et al. Citation2015), game theory (Homayoun et al. Citation2010, Madani Citation2010, Mahjouri and Ardestani Citation2010), the Cycles and Spirals of Justice approach (Patrick Citation2014), and complex systems (Liu et al. Citation2010), aiming to maximize the comprehensive benefits to society, the economy and the environment (Zhao and Chen Citation2008, George et al. Citation2011, Hillman et al. Citation2012). Moreover, artificial intelligence (AI) techniques, including agent-based modelling (ABM), have been emerging in recent years, being applied to deal with water demand management (WDM; Ponte et al. Citation2016), to conduct reservoir operation optimization and water shortage rate estimation for multi-users (Chang et al. Citation2016), and to simulate and evaluate threat management strategies for water distribution systems (Galán et al. Citation2009, Zechman Citation2011).
For example, in the MOA model, water demand and supply are usually balanced in order of priority for water demand as: local surface water; groundwater; large reservoir release for water supply; domestic use; instream ecological environment; industry and agriculture. Ultimately, a set of water allocation schemes should satisfy the fundamental water demand for each water-use sector for the improvement of water resources management. However, the MOA model requires a massive amount of calculation, and has two significant problems (Nouiri et al. Citation2015, Porse et al. Citation2015, Davijani et al. Citation2016, Salazar et al. Citation2016): (a) objectives and sub-objectives cannot properly describe a complex water resources system; and (b) no optimum solutions will actually occur due to the “curse of dimensionality” for a system. The ABM could properly consider different socio-economic and geographic factors in a single model by mainly integrating and adapting social sub-models and urban dynamic models; therefore, it is used to complement conventional water forecasting methodologies (Galán et al. Citation2009) and to design an intelligent decision support system (IDSS) for real-time WDM (Ponte et al. Citation2016). In addition, it could also simulate the actions and interactions of the individual actors (e.g. water consumers and water utility managers) in a water distribution network for water supply management, identify effective threat management strategies, and finally help managers and policy makers to make better decisions (Athanasiadis et al. Citation2005, Tillman et al. Citation2005, Zechman Citation2011). Nonetheless, the dynamic interactions among intelligent agents in the ABM are still not clear, and the particular assumptions embedded in the model need to be evaluated carefully.
The constraint of land use has been considered in a water allocation model in a recent study (Wang et al. Citation2015). With the constrained total water-use policy, a water user whose use exceeds T should be punished or pay compensation. Therefore, it is necessary to introduce the concept of compensation into the objective function of the water allocation, from which the relationships among water demand, water supply and T could be formulated. The Newsboy model uses an approach widely used in economics and management studies to find the optimal quantity of products ordered that maximizes the expected profit or minimizes the expected costs of overestimating and underestimating probabilistic demand (Arrow et al. Citation1951, Morse and Kimbal Citation1951, Kogan and Lou Citation2003, GürayGüler Citation2014). It is based on the premise that unsold products can be returned at a cost of the salvage price. The Newsboy model is implemented according to the assumption that retailers can return (part of the) unsold items at the end of the selling season and receive a partial wholesale price (i.e. unit salvage price), and this assumption is not unrealistic (Mostard and Teunter Citation2006). The compensation for each returned item is the difference between the wholesale price and the salvage price. This is the same as water allocation under the constrained total water-use policy. When the water use of a sector exceeds its constrained total quota, the excessive water use has to be compensated. Hence, it is possible to integrate the Newsboy model with the water allocation model to make an optimal water allocation scheme for water resources management under the total water-use constraint. The Newsboy model, with the ability of coordinating random demand and yield in economics and management (Ding Citation2013), is introduced to regulate water supply and demand in water allocation. It has the potential to provide a framework for regional water-use regulation under the policy of constrained total water use with a view to developing better water allocation schemes. As it has wide applications in other disciplines, it is anticipated that the model could provide an innovative approach to addressing water resources management problems under total water-use constraint that the traditional water allocation models cannot solve properly.
The aim of this paper is to develop an approach to formulate the relationships between water demand, water supply and T, and to provide a framework that can assist water managers in optimizing a water allocation scheme and setting up a water over-use warning for water resources management under total water-use constraint. In the proposed framework, T is designed as a state variable in the objective function, rather than simply being dealt with as a constraint of MOA, as in the previous models. To the best of our knowledge, there is no existing model that explicitly considers constrained total water-use quotas or reflects the dynamic change of water-use costs, such as water price and fees, in the objective function within the context of water allocation. This gap in the model has created the need to develop a new framework, which is referred to as water allocation under total water-use constraint.
This paper is divided into two main sections. First, we introduce the concept of the Newsboy model and present the new framework. In the second section, a case study is developed to demonstrate its application in the Dongjiang River Basin, South China. We discuss the advantages and limitations of the new framework and how it can be used and applied in other cases. We conclude by highlighting how different schemes of T affect water allocation under the total water-use constraint in water resources management.
2 Water allocation under total water-use constraint using the Newsboy model: an integrated framework
The Newsboy model can be described as follows. A Newsboy purchases several newspapers in the morning for retail; if not sold out, the rest will be returned at night based on the assumption that the unsold newspapers can be returned to the publisher. He makes a profit of A on every newspaper he sells and is compensated B for the newspapers returned. Therefore, if he purchases more newspapers than he can sell, he will lose money on the newspapers returned. However, he will make less profit when the purchased newspapers cannot meet the demand. Thus, the point is to find the quantity of newspapers that he should purchase to maximize profits under certain market conditions.
In this study, the water allocation amounts correspond to the customers’ demands for newspapers. Just as the demand for a newspaper is random, the water allocation amount for each water-use sector is also uncertain. However, water demand and supply at the basin scale are stable compared with newspaper selling, due to the initiative of demand and longer time period of reservoir storage within the basin. Actually, the uncertainty of water allocation is largely due to water demands, initial water allocation amount, water-use gross profit (similar to retail revenue), water-use cost (corresponding to newspaper cost) and compensation for water use over T (corresponding to compensation for unsold newspapers). Correspondingly, in using the Newsboy model for water allocation, water supply should be in the range of the available water amount (under reservoir regulation). Thus, a decision can be made considering the factors that cause the uncertainty of the water allocation amount to find the optimal water allocation amount that can bring maximum net profits under the regulation of the Newsboy model (). In , the minimum rate of water supply is the ratio of the basic water supply to water demand for each water-use sector (95% for domestic use, 90% for industry, 80% for agriculture). Allocation weight is the basis for allocating water to each water-use sector and is determined by net benefit of water supply and importance coefficient of each water-use sector.
Figure 1. Framework of water allocation under total water-use constraint using the Newsboy model.
2.1 Objective function
The objective function of the water allocation model aims to maximize the comprehensive benefits of water use. Here, the Newsboy model for water allocation is developed, and the objective function for net benefits under the constraints of total water use is described.
In the model, x amount (in cubic metres, m3) of water is allocated to a water-use sector for a specified time period, the gross benefit and cost of each cubic metre of water are a and b, respectively, under T; thus, the net profit is a − b. Then c is the compensation for each cubic metre of excess water when the water allocation amount exceeds T.
How does the Newsboy model coordinate available water resources, water demand, T and water allocation amounts and maximize water-use profits? For a certain period, initial water allocation amount (after reservoir regulation, see below) is defined as r, water demands as D, water allocation amount as x, water allocation benefit as, and compensation for extra water amount over T as
. Consequently, there are three cases for water allocation considering T as follows:
Case 1: . Initial water allocation amount (r) can fully satisfy water demand (D), while the water allocation amount is restricted by T. Thus, the water allocation amount equals the water demands,
; meanwhile, compensation should be made for the excessive water-use amount over
,
, and net benefit is determined by:
Case 2: . Initial water allocation amount (r) cannot satisfy water demand (D), while T is less than the water demand but more than the initial water allocation amount. The allocated water amount equals the initial water allocation amount; x = r,
,
and net benefit is determined by:
Case 3: . Initial water allocation amount (r) cannot satisfy water demand (D), while it exceeds T. Thus, the water allocation amount is restricted by constrained water-use amount and equals initial water allocation amount;
,
,
and net benefit is determined by:
According to the net benefit objective functions of the above-mentioned three cases, the total net benefit objective function of the Newsboy model for water allocation is considered as:
where or
) are the number of calculation zones and the time step (month) in the allocation model, respectively;
,
and
are the total numbers of months in Case1, Case2 and Case3, respectively;
is the number of water-use sectors in a region. Water-use sectors in different calculation zones correspond to “multiple demanders” defined in the classic Newsboy model.
2.2 Constraints for water allocation
Constraints for water allocation mainly include water balance for a calculation zone, reservoir storage, and in-stream ecological flow.
Water balance for a calculation zone:
(5)
where is the discharge from zone (k – 1) to zone k in time step i (month); and
reflects the hydraulic connection of reservoir t and zone k, with values ranging from 0 to 1;
is water demand to be supplied by reservoir t to zone k in time step i;
is the sum of the water yield produced in the watersheds located up to zone k;
and
are, respectively, the total supplied water and return water ratio for water-use sector j of zone k in time step t;
and
are, respectively, water loss of zone k and its outflow in time step i.
(2) Water balance for reservoir storage:
where is the initial storage of reservoir t in time step i;
,
and
are, respectively, the inflow into reservoir, the spilled water from the reservoir and water loss in time step i;
,
and
are, respectively, the minimum and maximum storages, and maximum supply capacity of reservoir t in time step i.
(3) Constraint for in-stream ecological flow:
where is the available water resources amount of zone k in time step t; and
, and
are, respectively, the minimum and maximum in-stream ecological flows of zone k in time step t. In general, ecological baseflow, water demand for preventing saline water intrusion (particularly in the river flowing into the sea), logy in the estuary, hydropower and shipping water-use are considered to set up a suitable ecological flow used in the model.
2.3 The hierarchical analysis method
The hierarchical analysis method aims to decompose a large-scale system with a hierarchically-organized structure into independent subsystems (Haimes and Li Citation1993). Under this hierarchical structure, subsystems usually have different and sometimes conflicting concerns (Yan and Haimes Citation2011). With this decentralized approach, the behaviour of each subsystem at a lower level is analysed and comprehended by the systems analyst and the obtained information is conveyed to fewer subsystems at a higher level. The multiple conflicting and non-commensurable objectives in the hierarchical system are coordinated through the step-by-step toleration obligation, which is a research method of reaching the objective gradually based on the theory of multiple objective optimization and, finally, the needs of the overall system are satisfied. The hierarchical analysis method has been applied in a variety of fields including water resources management (Chen et al. Citation2006).
2.4 Initial water allocation amount
In this study, the initial water allocation amount (r) is estimated with the hierarchical analysis method based on decomposition and coordination of the large-scale system theory, considering the principles of equity and efficiency, and the priority of each water-use sector. These principles can be explained by the matrix of water allocation rules (). In , four water-use sectors are presented, including domestic, industry, agriculture and ecology. There are four ranks of water shortage for each water-use sector: safe, bad, worse and worst. The values of a row vector in the matrix are the ratios of water allocation amount to water demand for a water-use sector. Domestic water use is the most important and should be satisfied first. Its ratio of water allocation amount to water demand is therefore the highest among all the water-use sectors.
Table 1. Matrix of water allocation rules.
The hierarchical analysis method for the initial water allocation amount consists of three steps: First, the whole water resources system is divided into a water demand system and water supply system. The output of the water supply system, the water supply amount, is considered as the input of the water demand system, while the water demand system puts forward the water demand requirement to the water supply system. Then, an estimate is given for water supply amount, which helps to balance and coordinate the water demand and supply systems. An iterative process for the adjustment of the benefit coefficient and weight of each water-use sector is conducted to maximize the total benefits (Chen et al. Citation2006). Finally, the optimal water allocation schemes are provided for the decision maker.
In this paper, the decision variables including and
in the constraints (Section 2.2) as well as the state variables () are considered as inputs for the hierarchical method, which is used to find the initial water allocation amount for each water-use sector (r). Then r is considered in the objective function (Section 2.1) and, under the regulation of the Newsboy model (Equations (1)–(4)), the optimal water allocation amount (x), as a decision variable, is finally selected from r, T and D based on maximized comprehensive benefits ().
Table 2. Main state and decision variables of the proposed water allocation model.
3 Case study: the Dongjiang River (DjR) Basin, South China
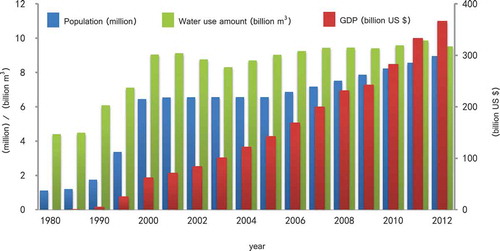
The Dongjiang River () originates from Jiangxi Province in central China. The river flows southwest for 520 km until its confluence with the Pearl River at the Pearl River Delta. The watershed covers approx. 35 340 km2, with 88.8% of its total drainage area in Guangdong Province in South China. Annual precipitation and discharge in the DjR Basin vary greatly, both spatially and temporally (). The majority of precipitation occurs during the spring months, accounting for 83% of the total annual precipitation. The average annual water resources amount to 32.66 × 10⁹ m3, while its current water supply capacity is over 10 × 109 m3. Both GDP (gross domestic product) and population in the DjR Basin have increased rapidly over the past 30 years, due to which, the total water-use amount has increased significantly (). By the end of 2014, the water withdrawal from the DjR for off-stream water-use purposes was over 9 × 10⁹ m3, which is very close to the available water resources amount (10.66 × 10⁹ m3) in dry years. Agricultural water use accounted for 45.8% of total water consumption in 2014. The DjR provides water supplies for domestic, industrial and environmental use in the cities of Heyuan, Huizhou, Dongguan, Guangzhou, Shenzhen, Meizhou and Shaoguan, with a total population of more than 30 million (He et al. Citation2013, Yang et al. Citation2016). In particular, the development of Hong Kong has made water security in the DjR Basin more evident because the river provides 80% of its water supply. The growing water demands due to the fast growth in GDP and population along with the uneven distribution of water resources pose a great challenge for the water supply in the DjR Basin.
Figure 2. Sketch map of the DjR Basin, South China.
Figure 3. Spatial and temporal distribution of precipitation and discharge in the DjR Basin, South China (1959 –2012).
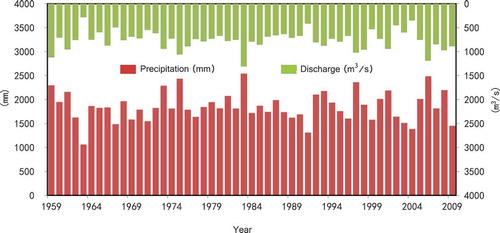
Figure 4. Chart of economic and social development in the DjR Basin, South China (1980–2012).
To implement the Newsboy model for water allocation under total water-use constraint, the DjR Basin water network was built, as shown in , in which nodes represent the places with a water balance equation constraint. Many pumping stations and water diversion projects in each zone are simplified to a single water pumping station or water diversion project by combining the capacities of water extraction projects for the purpose of computing. In this study, the DjR Basin was divided into eight calculation units, including 16 modelling zones (), according to the distribution of river systems of the DjR Basin.
Figure 5. Diagram of reservoir–river-water allocation system for the DjR Basin, South China.
In the case study, 2020 was chosen as the planning year, and data used in the model included monthly inflow, evaporation and characteristic values of three large reservoirs for the period 1956–2000. The monthly inflows of each zone in the DjR Basin were also collected. Five water-use sectors were considered, namely domestic, agriculture, industry, service and ecology (off-stream).
Monthly water demands for each water-use sector were obtained from the water resources comprehensive plan of Guangdong Province (approved by the People’s Government of Guangdong Province, 2011), as shown in . In , agriculture water demands under five types of precipitation frequency (50, 75, 90, 95 and 97%) are listed to reflect possible agricultural water use in a normal water year and in an extremely dry year, mainly considering the uncertainty of available water resources in the future (Chen et al. Citation2006). Schemes of T were provided with the decomposition scheme of constrained total water-use quota of Guangdong Province (Hydrology Bureau of Guangdong Province, 2011), and schemes of low (Scheme A) and high (Scheme B) domestic T () were taken, for instance, to investigate how different sets of T play out in water allocation results. Net benefit and compensation per cubic metre in the objective function are determined according to the following principles.
Table 3. Water demand (106 m3) for each water-use sector in the DjR Basin, South China, for 2020. P: precipitation frequency.
Table 4. Scheme sets of low (A) and high (B) domestic constrained water-use amount in the DjR Basin, South China, for 2020 (106 m3).
Based on historical water efficiency indicators and the future development of society and the economy, the total agricultural output value divided by agricultural water-use amounts is equal to the net benefit per cubic metre for agricultural water use, which is used as a reference for ecology water use. The net benefit per cubic metre for domestic and industrial water use is equal to water price. Compensation per cubic metre is determined with a local penalty rate or issued by the government, based on the net benefit of each water-use sector.
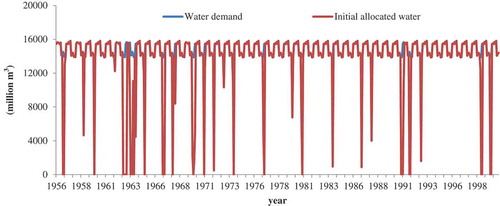
The first step in the proposed framework provides an initial water allocation amount to each zone in the DjR Basin by using the hierarchical analysis method. For example, the initial monthly water allocated to Shenzhen is shown in . The results of this step are used as inputs for the next step, which gives the optimal water allocation amount to maximize total water-use benefit by using the Newsboy model under the total water-use constraint.
Figure 6. Monthly initial allocated water to Shenzhen city using the hierarchical analysis method.
4 Results
4.1 Water deficit ratio in the DjR Basin
Water allocation and demand under the aforementioned five types of precipitation frequency as well as annual average were chosen based on the long time series of water allocation results to analyse the water deficit situation in the planning year (). On the whole, water allocation amount for each water-use sector under Scheme A is close to that of Scheme B. Water deficit ratio of the DjR Basin in a normal water year was below 7%, while in an extremely dry year (with a frequency of 97%), water shortage was severe, with a water deficit ratio of more than 55%, affirming that emergency measures such as reserved water supply source, water saving and water conservation are required to meet water demands in the DjR Basin under severe water shortage conditions.
Table 5. Analysis of water allocation and demand in the DjR Basin, South China, for 2020.
In Scheme A, the water deficit ratio (6.45%) with a precipitation frequency of 75% is larger than that (3.24%) of a precipitation frequency of 90% (). This might be related to selection of the typical year corresponding to a specific precipitation frequency. There is a small difference in total water demands under these two precipitation frequencies; however, water supply is not only restricted by the total available water resources amounts, but also affected by its annual distribution. The annual distributions of available water resources of years with the same precipitation frequency may vary. The DjR Basin is influenced significantly by the monsoon season and has an uneven spatial and temporal distribution of precipitation ().The ratio of runoff under rainy and dry conditions can be as high as 40. Hence, the spatial and temporal distribution of water resources does not match the regional water demands during some periods, particularly under intense water-use conditions. This approximately accounts for a seasonal water shortage. As indicated in , for a typical year with a precipitation frequency of 90%, its available water resource is less than the typical year with a precipitation frequency of 75%; however, the annual distribution of its available water resource better matches the water demands during some periods. Therefore, it has a larger water supply amount compared to the typical year with a precipitation frequency of 75%.
4.2 Time periods for water use over the constrained water-use quota
It can be seen from that time periods for water use over T of Scheme A under five types of precipitation frequency are fewer than time periods of Scheme B. In particular, with a precipitation frequency of 97%, the time period for water use over T of Scheme A is 59 months, while that of Scheme B is 66 months; in general, the time periods for water use over T under this precipitation frequency are greater than those of the other five precipitation frequencies for both Scheme A and Scheme B. Moreover, the difference between time periods for water use over T of these two schemes under the precipitation frequency of 97% is larger than that of the other precipitation frequencies. Therefore, it can be concluded that, in an extremely dry year, different schemes of T will have a distinct effect on the time periods for water use over T, which indicates that total water-use constraint will have a great impact on water resources management in a severe water shortage situation. For example, when Scheme A is adopted in the extremely dry year, there will be more time periods for water use over T. Therefore, for each water-use sector, there are two possible options: one is to reduce water use according to T and avoid punishment or compensation; the other is to meet water demands to maximize total benefits at the cost of compensation. However, for the governor, it will force the water-use sectors to promote water saving, punish the water-use sector whose water use over T exceeds the current total constraint, and finally guarantee the basic water demands for each water-use sector.
Table 6. Net benefits for each water-use sector in the DjR Basin, South China, for 2020 (million US$).
4.3 Net benefits
shows that net benefits under Scheme A are greater than under of Scheme B. These results indicate that more net benefits can be gained when a scheme of low constrained domestic water-use quota is adopted by the water resources management under the constrained total water-use policy. also indicates that the total net benefits of the five water-use sectors in a dry (precipitation frequency, P of 95%) or extremely dry (P = 97%) year are greater than those of any other typical year with a lower precipitation frequency. That is because, when compared to a typical year with a lower precipitation frequency, the available water resources in a year with P = 97% are less (highest water deficit ratio of 56.94% for Scheme A, 57.08% for Scheme B), and the water-use amount of each sector, especially industrial and agricultural water use, is obviously influenced by T. Under water-use constraint, the water allocation amount for each water-use sector will most likely exceed T (with the largest time periods for water use greater than T being 59 months for Scheme A and 66 months for Scheme B), leading to greater compensation for the extra water-use amount. However, limited water resources are used to maximize the benefits for production purposes, and the net benefits from productive water-use sectors are larger, which offsets the compensations and then contributes to the largest total net benefits of water use.
Moreover, the net benefits of agricultural water use have a greater fluctuation than domestic water use (average change rate of 5.9 and 1.5, respectively, with an average change rate of 0.3) under the five types of precipitation frequency. Comparison of the fluctuations in agricultural and domestic water use is reasonable and relevant according to the priority of each water-use sector. Domestic water use should be satisfied under any precipitation frequency and have a high water supply guarantee rate, while industrial and agricultural water use are considered subsequently. Therefore, the fluctuation of the net benefits of domestic water use is less when compared to industrial water use. also shows that both schemes A and B (for P = 90%) have the lowest total benefits compared to the other precipitation frequencies, the reasons being that both schemes A and B have the lowest water deficit ratio, water-use amounts over T are greater, and compensation for excessive water-use amounts has a stronger impact on the decrease of net benefits for each water-use sector (see Equations (1)–(3)) in Section 2.1). As mentioned in the analysis of the allocation results above, the comparison of the fluctuation of net benefits for each water-use sector under five types of precipitation frequency illustrates how the different schemes of T contribute to the net benefits of water use under the constrained total water-use policy.
5 Discussion
The water deficit ratios and net benefits under these five different types of precipitation frequency from the case study indicate that the water allocation results are reasonable and close to reality. It can be inferred from this case study that the Newsboy model for water allocation can provide a water governor with more realistic strategies based on maximum profits, and provides evaluation of the impacts on water allocation of different schemes of T that would be unavailable using previous water allocation models. Moreover, it also shows the time periods during which water allocation amount is greater than T and then gives a water over-use warning for each water-use sector, as well as provide a baseline for the water resources management by punishing the water-use sector whose water use exceeds T, while alerting other water users in the water distribution network under total water-use constraint. Another advantage of the Newsboy model over previous water allocation models is its ability to reflect the dynamic change of water prices and fees in the water markets based on water-use net benefit (see Section 2.1). This enables us to handle the adjustment of water allocation amount in water resources management when water price and cost information is readily available. As for the DjR Basin, its precipitation has increased slightly but has fluctuated greatly in recent years (He et al. Citation2016), accompanied by increasing off-stream water demands, which may exacerbate water shortage in terms of seasonal drought and pose an urgent need to adapt this proposed new framework to conduct adaptive water management under the total water-use constraint.
This study investigated the impact of T on water management in terms of water allocation by applying the proposed new framework; however, the water management system is complex and effective water management is not easy (Veale and Cooke Citation2017). The engagement of water-use sectors and the commitment of the water governor should be integrated to buffer water conflicts and balance regional development of the basin. It is important to note that the water allocation results obtained by the proposed new model rely on a set of assumptions that should be evaluated carefully. The Newsboy model operates based on the assumption that unsold newspapers can be returned to the publisher and the newsboy will be compensated; based on this, the proposed model in the current study operates mainly based on the assumption that the water-use sector whose total water use is in excess of T will be punished and will have to pay compensation for the excessive water use. To make these assumptions reasonably realistic, very detailed representations of the basin and extensive data from various information sources were interpreted and used (Section 3). The robustness of the results was also analysed by comparing the impacts of two different schemes of T on water allocation under the total water-use constraint. According to the water allocation results, for example, time periods for water use over T and net benefits are more sensitive to the assumption of different schemes of T when compared to water deficit ratio. From a policy making perspective, this assumption reveals that a reasonable scheme of T made by the water governor is key to applying the proposed new framework to water management in highly intensive water-use regions.
The determination of some key parameters is important in the objective function of the proposed new model. For instance, the net profit on each cubic metre of water and the compensation for each cubic metre of water in excess of T, which could also have impacts on the water allocation results, are dynamic and usually are not easy to determine, and this may limit the application of the proposed new model. However, it can easily be addressed when water-use market information, water-use policy and regulations, and statistical water-use data are available. For the DjR Basin, the compensation for each extra cubic metre of water over T can be jointly issued by the Price Bureau, Department of Finance, and the Department of Water Resources of Guangdong Province. If the penalty rules are made by these provincial functional departments, then the Dongjiang Basin Authority and the local water authorities are responsible for supervision and implementation of the penalty rules, to make water-use sectors comply with the constrained total water-use policy and to guarantee the stability of the proposed new framework.
The Newsboy model provides critical information about net benefit and compensation per cubic metre needed for optimizing water allocation in a fully developed river basin. Therefore the concept of the Newsboy model can be extended to other basins with high-intensity water use like the DjR Basin. Special attention should be given to the effect of water-use cost change and defining the initial water allocation amount in a simple way. Additionally, this study considers the randomness of water allocation that available water resources amounts and water demands under five types of precipitation frequency were respectively chosen based on the observed long series of flow and precipitation to reflect the uncertainty of inflows and demand in the case study. The adaptive control technique can be used to adjust the simulated regional flow from a hydrological model when observed flow data are unavailable. The common probability distribution functions for the water demands and available water resources in the Newsboy model for water allocation should also be developed in future study.
6 Conclusions
This paper developed a framework of water allocation under total water-use constraint using the Newsboy model to adapt the constrained total water-use policy implemented in China. A constrained water-use quota as well as the initial water allocation amount were considered in the objective function. These variables were coordinated by using the Newsboy model to maximize comprehensive water-use benefit and help make a water-use decision. The framework was then tested in the case study of the DjR Basin, South China.
The case study of the Newsboy model for water allocation shows that water deficit ratios in the DjR Basin are over 55% under both Scheme A and Scheme B, and emergency measures such as reserved water supply source and water saving are needed to guarantee the basic water demands of each water-use sector. Time periods for water use in excess of T under the high domestic total water-use constraint (Scheme B) are larger than those under the low domestic total water-use constraint (Scheme A). Furthermore, there is a distinct difference between time periods for water use exceeding T under these two schemes in extremely dry years. Net benefits under Scheme A are greater than those of Scheme B. The net benefits of agricultural water use fluctuate more than those of domestic water use. Compared to water deficit ratio, time periods for water use over T and net benefits are more sensitive to the scheme of T. It is essential for water governors to make a reasonable scheme of T when applying the proposed new framework to adaptive water management. In summary, the proposed new framework can reflect how different schemes of constrained water-use quota affect the net benefits of each water-use sector, provide a base for water over-use warning, and finally suggest a reasonable strategy for water-use decision making under the total water-use constraint. The framework is relevant since it gives us the opportunity to analyse water allocation schemes responding to the policy of the government and to rigorously study the implications of how the scheme of T works. Successive investigations will reduce the uncertainties of the inputs for the proposed new model and enhance its application in other fast developing basins, and improvement of the limitations of these assumptions in the model will enable robust strategies for adaptive water resources management.
Acknowledgements
Data to support this article were obtained from the Hydrology Bureau of Guangdong Province and the Center for Water Resources and Environment, Sun Yat-sen University. In addition, our cordial gratitude is extended to the reviewers for their careful review, their pertinent and valuable comments and suggestions to the paper. Thanks are also due to Ms Olga Rodriguez, Texas A&M AgriLife Research Center at El Paso, for proofreading, which greatly improved the quality of this paper.
Disclosure statement
No potential conflict of interest was reported by the authors.
Additional information
Funding
References
- Arrow, K.A., Harris, T.E., and Marschak, J., 1951. Optimal inventory policy. Econometrica, 19, 250–272.
- Athanasiadis, I., et al., 2005. A hybrid agent-based model for estimating residential water demand. Simulation—Transactions of the Society for Modeling and Simulation International, 81 (3), 175–187. doi:10.1177/0037549705053172
- Beh, E.H.Y., Maier, H.R., and Dandy, G.C., 2015. Adaptive, multi objective optimal sequencing approach for urban water supply augmentation under deep uncertainty. Water Resources Research, 51, 1529–1551. doi:10.1002/2014WR016254
- Bekchanov, M., et al., 2015. Potential gains from water rights trading in the Aral Sea Basin. Agriculture Water Resources Management, 152, 41–56. doi:10.1016/j.agwat.2014.12.011
- Brown, C.W., et al., 2015. The future of water resources systems analysis: toward a scientific framework for sustainable water management. Water Resources Research, 51, 6110–6124. doi:10.1002/2015WR017114
- Chang, F.J., Wang, Y.C., and Tsai, W.P., 2016. Modelling intelligent water resources allocation for multi-users. Water Resources Management, 30 (4), 1395–1413. doi:10.1007/s11269-016-1229-6
- Chen, X.H., Chen, Y.Q., and Lai, G.Y., 2006. Optimal allocation of water resources in Guangzhou City, South China. Journal of Environmental Science and Health Part A: Toxic/Hazardous Substances Environmental Engineering, 41 (7), 1405–1419. doi:10.1080/10934520600657198
- Condon, L.E. and Maxwell, R.M., 2013. Implementation of a linear optimization water allocation algorithm into a fully integrated physical hydrology model. Advances in Water Resources, 60, 135–147. doi:10.1016/j.advwatres.2013.07.012
- Davijani, M.H., et al., 2016. Multi-objective optimization model for the allocation of water resources in arid regions based on the maximization of socio-economic efficiency. Water Resources Management, 30 (3), 927–946. doi:10.1007/s11269-015-1200-y
- Ding, S., 2013. Uncertain multi-product newsboy problem with chance constraint. Applied Mathematics and Computation, 223, 139–146. doi:10.1016/j.amc.2013.07.083
- Galán, J.M., López‐Paredes, A., and Del Olmo, R., 2009. An agent‐based model for domestic water management in Valladolid metropolitan area. Water Resources Research, 45, 5. doi:10.1029/2007WR006536
- George, G., et al., 2011. An integrated hydro-economic modelling framework to evaluate water allocation strategies I: model development. AgricultureWaterResourcesManagement, 98, 733–746. doi:10.1016/j.agwat.2010.12.004
- GürayGüler, M., 2014. A note on: “The effect of optimal advertising on the distribution-free newsboy problem”. International Journal of Production Economics, 148, 90–92. doi:10.1016/j.ijpe.2013.11.021
- Haimes, Y.Y. and Li, D., 1993. Hierarchical multiobjective analysis for large-scale systems: review and current status. Automatica, 24 (1), 53–69. doi:10.1016/0005-1098(88)90007-6
- He, Y., et al., 2016. Quantifying the changing properties of climate extremes in Guangdong province using individual and integrated climate indices. International Journal of Climatology. doi:10.1002/joc.4739
- He, Y.H., Lin, K.R., and Chen, X.H., 2013. Effect of land use and climate change on runoff in the dongjiang basin of South China. Mathematical Problems In Engineering, 2013, 1–14. doi:10.1155/2013/471429
- Hillman, B., Douglas, E.M., and Terkla, D., 2012. An analysis of the allocation of Yakima River water in terms of sustainability and economic efficiency. Journal of Environmental Management, 103, 102–112. doi:10.1016/j.jenvman.2012.02.017
- Hoekema, D.J. and Sridhar, V., 2011. Relating climatic attributes and water resources allocation: a study using surface water supply and soil moisture indices in the Snake River basin, Idaho. Water Resources Research, 47. doi:10.1029/2010WR009697
- Homayoun, M.F., Ganji, A., and Khalili, D., 2010. Two solution methods for dynamic game in reservoir operation. Advances in Water Resources, 33, 752–761. doi:10.1016/j.advwatres.2010.04.001
- Kogan, K. and Lou, S., 2003. Multi-stage newsboy problem: a dynamic model. European Journal of Operational Research, 149, 448–458. doi:10.1016/S0377-2217(02)00450-2
- Li, N., et al., 2015. Economic impacts of total water use control in the Heihe River Basin in Northwestern China – an integrated CGE-BEM modeling approach. Sustainability, 7, 3460–3478. doi:10.3390/su7033460
- Liu, D.D., Chen, X.H., and Lou, Z.H., 2010. A model for the optimal allocation of water resources in a saltwater intrusion area: a case study in Pearl River delta in China. Water Resources Management, 24 (1), 63–81. doi:10.1007/s11269-009-9437-y
- Madani, K., 2010. Game theory and water resources. Journal of Hydrology, 381, 225–238. doi:10.1016/j.jhydrol.2009.11.045
- Mahjouri, N. and Ardestani, M., 2010. A game theoretic approach for inter basin water resources allocation considering the water quality issues. Environmental Monitoring and Assessment, 24, 63–81. doi:10.1007/s10661-009-1070-y
- Manzoni, S., et al., 2014. Optimal plant water-use strategies under stochastic rainfall. Water Resources Research, 50 (7), 5379–5394. doi:10.1002/2014WR015375
- Masih, I., et al., 2009. Analyzing streamflow variability and water allocation for sustainable management of water resources in the semi-arid Karkheh river basin, Iran. Physics and Chemistry of the Earth, 34, 329–340. doi:10.1016/j.pce.2008.09.006
- Milano, M., et al., 2013. Modeling the current and future capacity of water resources to meet water demands in the Ebro basin. Journal of Hydrology, 500, 114–126. doi:10.1016/j.jhydrol.2013.07.010
- Morse, M.P. and Kimbal, G.E., 1951. Methods of Operations Research. Cambridge, MA: MIT Press.
- Mostard, J. and Teunter, R., 2006. The newsboy problem with resalable returns: a single period model and case study. European Journal of Operational Research, 169, 81–96. doi:10.1016/j.ejor.2004.04.048
- Murray, A.T., et al., 2012. Spatial optimization models for water supply allocation. Water Resources Management, 26 (8), 2243–2257. doi:10.1007/s11269-012-0013-5
- Nouiri, I., et al., 2015. Multi-objective optimization tool for integrated groundwater management. Water Resources Management, 29 (14), 5353–5375. doi:10.1007/s11269-015-1122-8
- Patrick, 2014. The cycles and spirals of justice in water-allocation decision making. Water International, 39 (1), 63–80. doi:10.1080/02508060.2013.863646
- Ponte, B., et al., 2016. Intelligent decision support system for real-time water demand management. International Journal of Computational Intelligence Systems, 9 (1), 168–183. doi:10.1080/18756891.2016.1146533
- Porse, E.C., Sandoval-Solis, S., and Lane, B.A., 2015. Integrating environmental flows into multi-objective reservoir management for a transboundary, water-scarce river basin: rio Grande/Bravo. Water Resources Management, 29 (8), 2471–2484. doi:10.1007/s11269-015-0952-8
- Rogers, J.W. and Louis, G.E., 2007. A financial resource allocation model for regional water systems. International Transactions in Operational Research, 14, 25–37. doi:10.1111/itor.2007.14.issue-1
- Salazar, J.Z., et al., 2016. A diagnostic assessment of evolutionary algorithms for multi-objective surface water reservoir control. Advances in Water Resources, 92, 172–185. doi:10.1016/j.advwatres.2016.04.006
- Saleth, R.M., 2011. Water scarcity and climatic change in India: the need for water demand and supply management. Hydrological Sciences Journal, 56 (4), 671–686. doi:10.1080/02626667.2011.572074
- Tillman, D., et al., 2005. Simulating development strategies for water supply systems. Journal of Hydroinformatics, 7 (1), 41–51.
- Veale, B. and Cooke, S., 2017. Implementing integrated water management: illustrations from the Grand River watershed. International Journal of Water Resources Development, 33 (3), 375–392. doi:10.1080/07900627.2016.1217503
- Wang, Z.Q., et al., 2015. Optimal water resources allocation under the constraint of land use in the Heihe River Basin of China. Sustainability, 7, 1558–1575. doi:10.3390/su7021558
- Wolters, W., et al., 2016. Issues and challenges in spatial and temporal water allocation in the nile delta. Sustainability, 8, 383. doi:10.3390/su8040383
- Yan, Z.Y. and Haimes, Y.Y., 2011. Risk-based multiobjective resource allocation in hierarchical systems with multiple decision makers. Part I: theory and methodology. Systems Engineering, 14 (1), 1–16. doi:10.1002/sys.v14.1
- Yang, L.M., Chan, F.K.S., and Scheffran, J., 2016. Climate change, water management and stakeholder analysis in the Dongjiang River basin in South China. International Journal of Water Resources Development. doi:10.1080/07900627.2016.1264294.32
- Zechman, E.M., 2011. Agent‐based modeling to simulate contamination events and evaluate threat management strategies in water distribution systems. Risk Analysis, 31 (5), 758–772. doi:10.1111/j.1539-6924.2010.01564.x
- Zhao, R.H. and Chen, S.Y., 2008. Fuzzy pricing for urban water resources: model construction and application. Journal of Environmental Management, 88, 458–466. doi:10.1016/j.jenvman.2007.03.004