
ABSTRACT
The regional-scale consistency between four precipitation products from the GPCC, TRMM, WM, and CMORPH datasets over the Arabian Peninsula was assessed. Their macroscale relationships were inter-compared with soil moisture and total water storage (TWS) estimates from AMSR-E and GRACE. The consistency analysis was studied with multivariate statistical hypothesis testing and Pearson correlation metrics for the period from January 2000 to December 2010. The products and GRACE estimates were assessed over a representative sub-domain (United Arab Emirates) with available in situ well observations. Next, geographically temporally weighted regression (GTWR) was employed to examine the interdependencies among the peninsula’s hydrological components. The results showed GPCC-TRMM recording the highest correlation (0.85) with insignificant mean differences over more than 90% of the peninsula. The highest GTWR predictive performance of TWS (R2 = 0.84) was achieved with TRMM forcing, which indicates its potential to monitor changes in TWS over the arid peninsular region.
Editor A. Castellarin Associate editor S. Kanae
1 Introduction
The development of accurate and reliable precipitation products has received much attention over recent years, particularly multi-input derived products from ground observations, satellite remote sensing, and climate model simulations (Rafieeinasab et al. Citation2015, Stocker et al. Citation2015, Wang and Lin Citation2015, Wen Citation2015). The global long-term spatial patterns of annual precipitation have been found to be in good agreement among numerous products, although marked differences were often revealed regionally (Costa and Foley Citation1998, Adler et al. Citation2001, Fekete et al. Citation2004). The consistency among existing precipitation products has not been studied thoroughly in the Middle East and North African region (MENA), and particularly in arid regions such as the Arabian Peninsula (Milewski et al. Citation2015). This can be attributed mainly to the scarcity of dense and reliable observation networks and the absence of long records of rainfall observations (Ghebreyesus et al. Citation2016a, Wehbe et al. Citation2017).
The assessment of precipitation products can be conducted at global or regional scales. The comparison of global overland precipitation estimates from the Tropical Rainfall Measurement Mission (TRMM), Global Precipitation Climate Center (GPCC), and the University of Delaware Willmott-Matsuura (WM) datasets by Liu (Citation2015) showed climatology agreement in terms of spatial distribution, zonal means as well as seasonal variations, but large discrepancies were found for light rain. The analysis of precipitation products globally tends to depict overall changes in variability of precipitation estimates with no specific focus on the link with prevailing local conditions (Fekete et al. Citation2004, Liu Citation2015), which could be achieved by conducting regional analyses, like the one we are proposing in this study.
In the Arabian Peninsula region, Almazroui (Citation2011) conducted a regional analysis over Saudi Arabia for the period 1998–2009 for a ground-based calibration of the TRMM product with raingauge measurements. The correction resulted in an approximately 0.9 correlation coefficient on a monthly scale, indicating the reliability of TRMM usage in water-related studies in the region. Also, El Kenawy and McCabe (Citation2016) studied rainfall climatology, anomalies, and trends over Saudi Arabia using gauge-based products from the Asian Precipitation Highly-Resolved Observational Data Integration Towards Evaluation of Water Resources (APHRODITE), Climatic Research Unit (CRU), and GPCC, among others. Their work suggested that the monthly GPCC product showed the most accurate rainfall estimates over the regional scale of Saudi Arabia. To our knowledge, there are only a few studies that have addressed the inter-comparison of precipitation products in the Arabian Peninsula. The scarcity of rainfall records in the Arabian Peninsula hampers thorough verification of the existing products. To overcome the shortage of in situ records of precipitation, it is relevant to assess them first by analyzing their consistency and second by comparing them to estimates of other hydrological variables such as soil moisture and water storage. Such analysis could be particularly relevant for regions like the Arabian Peninsula, where in situ observations are scarce.
The regional response of the surface and groundwater storage, as terrestrial water components, to rainfall, as a climate input, can reveal important spatio-temporal dynamics of precipitation records. Yan et al. (Citation2010) applied an integrated, remote sensing-based approach to improve estimations of renewable water resources in the arid to semi-arid areas of the Sinai Peninsula and the Eastern Desert of Egypt. Their approach successfully incorporated the Special Sensor Microwave Imager (SSM/I), Landsat Thematic Mapper (TM), Advanced Very High-Resolution Radiometer (AVHRR), Advanced Microwave Scanning Radiometer (AMSR-E), Advanced Spaceborne Thermal Emission and Reflection Radiometer (ASTER), and TRMM datasets to determine precipitation, soil moisture, reservoir volume and stages, and flows in large river channels with the application of a hydrological model. For the same study area, Milewski et al. (Citation2009) used an integrated remote sensing data extraction model (RESDEM) for analysis of an ensemble of remote sensing datasets, including TRMM, SSM/I, AVHRR, MODIS, QuikSCAT, and AMSR-E. Milewski et al. (Citation2015) also assessed the four TMPA products: 3B42 V6, V7temp, V7, and RTV7, using a raingauge network in Northern Morocco. The 3B42 V7 was found to be the most consistent with the gauge observations based on their spatially interpolated Pearson correlation results, while overestimation was recorded across all four products. Zhang et al. (Citation1999) used a distributed parameter model (TOPOG_IRM) on a 1.6 km2 watershed in southeast Australia for soil moisture and groundwater recharge estimations. Their simulations showed that the spatial patterns of soil moisture and recharge and their response to precipitation were determined mainly by soil types, which are uniform over large areas with insignificant spatial heterogeneity in the case of the Arabian Peninsula (see ). Ghebreyesus et al. (Citation2016b) stated that accounting for soil moisture is essential for the closure of the water balance in arid watersheds. Kirchner (Citation2009) addressed the estimation of precipitation “backward” from estimates of streamflow fluctuations, which relates with climate and geomorphic variables (Krakauer and Temimi Citation2011). Various studies on the surrounding areas of the Arabian Peninsula have involved remote sensing data coupled with models to perform large-scale monitoring. Ahmed et al. (Citation2011) showed that the observed TWS anomaly variations from the Gravity Recovery and Climate Experiment (GRACE) platforms are largely controlled by elements of the hydrological cycle, namely, runoff, infiltration, and groundwater flow, and have not been obscured by noise, as previously thought.
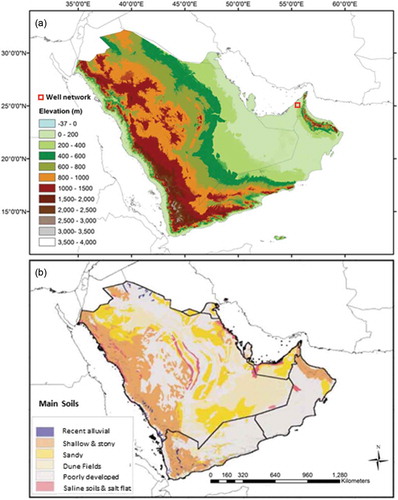
Figure 1. (a) GTOPO30 derived elevations and well network location, and (b) soil map (from De Pauw Citation2002).
The present study compares a series of four globally gridded precipitation datasets from Willmott-Matsuura – WM (Willmott and Robeson Citation1995, Willmott et al. Citation2001), the Global Precipitation Climate Center – GPCC (Arkin and Xie Citation1994), the Tropical Rainfall Measuring Mission – TRMM TMPA (Huffman Citation1997), and the National Oceanic and Atmospheric Administration Climate Prediction Center (NOAA CPC) Morphing Technique – CMORPH (Joyce et al. Citation2004). The aim is first to cross-examine their statistical difference in means and second to investigate their consistency with AMSR-E soil moisture (Njoku Citation1999, Njoku et al. Citation2003) and GRACE water storage anomalies (Swenson and Wahr Citation2006, Landerer and Swenson Citation2012) through multivariate geographically temporally weighted regression (GTWR) proposed by Huang et al. (Citation2010). The products are also tested against in situ well observations over a representative sub-domain in the UAE. Results outline the most regionally consistent rainfall products and the extent to which their inherent discrepancies impact the response of soil moisture and water storage estimates.
2 Study domain and datasets
The Arabian Peninsula extends over 3 237 500 km2, ranking it the largest peninsula in the world, and has a population of around 77 million (Groucutt and Petraglia Citation2012). Due to its predominant hyper-arid climate, this region has become increasingly subject to water stress, which has been augmented by increasing water demand due to significant population growth and increased living standards. Analysis of the peninsula’s digital elevation model GTOPO30 (DAAC Citation2004) shows that altitudes vary from the lowest point in the Matfi salt flat, south of Qatar, to over 3500 m at the peninsula’s highest peaks in Yemen (). Recharge mechanisms are highly dependent on the existing topography and soil textures. Most soils across the Arabian Peninsula are poorly developed, shallow, and enriched in lime, gypsum, or salts, which reflects the aridity of the climate. Sand dunes and sheets of transported materials cover the majority of its area. The soils are formed by the breakdown of geological materials subsequently deposited by wind and water. De Pauw (Citation2002) conducted an agro-ecological study in the Arabian Peninsula. He developed several soil maps showing that shallow and stony soils cover the mountainous areas of the western highlands of Midian, Hijaz, and Asir in Yemen and the Hajjar and Mussandam Mountains in Oman, which may favor lateral flow rather than recharge of the deep aquifer (). Also, large areas of gravel plains were found, especially in eastern Kuwait and south of the Hajjar Mountains, which may foster local recharge.
Four rainfall datasets were selected for the study: (1) the TRMM 3B42 research-derived daily product (Huffman and Bolvin Citation2013). The algorithm applied to this product is the Version 7 TRMM Multi-Satellite Precipitation Analysis (TMPA), which is a major improvement over the previous Version 6, especially in terms of daily resolution (Chen et al. Citation2013, Milewski et al. Citation2015); (2) the CMORPH (CPC Morphing Technique) high-resolution daily precipitation product (Joyce et al. Citation2004). This product has been validated and shown to be comparable to TRMM, particularly in wet regions (Laws et al. Citation2003, Haile et al. Citation2013); (3) the WM gridded monthly precipitation product (Version 3.01) (Willmott and Robeson Citation1995, Willmott et al. Citation2001), where the 3.01 Version has been utilized in a number of assessment studies (Fekete et al. Citation2004, Chokngamwong and Chiu Citation2008, Yatagai et al. Citation2012); and (4) the GPCC Full Data Reanalysis product derived from quality-controlled station data (Arkin and Xie Citation1994).
For analysis of the agreement of precipitation products with other hydrological variables, the level 3 AMSR-E soil moisture product was used (Njoku Citation1999, Njoku et al. Citation2003). This product has been incorporated with rainfall products in a number of hydrological studies (Robock et al. Citation2000, Reichle et al. Citation2007). In addition, in this study, GRACE water storage anomalies (Swenson and Wahr Citation2006, Landerer and Swenson Citation2012) were compared to the selected precipitation products. The GRACE Tellus Land product was based on the RL05 spherical harmonics (maximum degree/order: n = 60) after removing atmospheric pressure and mass changes. A destriping filter was applied to the data to minimize the effect of correlated errors whose telltale signals are N-S stripes in GRACE monthly maps. A 300-km wide Gaussian filter was also applied to the data. The data were scaled by multiplication of scaling coefficients obtained from the NCAR CLM4 numerical land-hydrology model. The measurement errors have already been scaled, so no further multiplication was necessary for the error estimate (Landerer and Swenson Citation2012). The inter-comparison of the aforementioned key hydrological parameters on the regional scale has been shown to reveal significant macroscale interactions (Awange et al. Citation2014). For comparison between the rainfall products and both AMSR-E and GRACE products, an overlapping duration (see ) from June 2002 to December 2010 was used.
Table 1. Dataset description.
The Advanced Microwave Scanning Radiometer–Earth Observing System (AMSR-E) land surface emissivity product, developed by Norouzi et al. (Citation2011) from January 2003 to December 2007, was used to analyze the sensitivity to soil moisture over the peninsula. Land surface emissivity estimates for this dataset were retrieved at the vertically and horizontally polarized (V-pol and H-pol) frequencies of 10.65 and 36.5 GHz (Norouzi et al. Citation2015b). Ancillary data used in the emissivity retrieval, such as surface skin temperature and cloud mask, were obtained from the International Satellite Cloud Climatology Project (ISCCP) (Rossow and Schiffer Citation1999). Atmospheric properties were obtained from TIROS Operational Vertical Sounder (TOVS) observations to determine the small upwelling and downwelling atmospheric emissions as well as the atmospheric transmission. It is worth noting that soil moisture was also inferred from low C and X band frequencies (6.9–10.7 GHz) AMSR-E data. Assessment of the consistency between emissivity at different frequencies and soil moisture from low-frequency readings should indicate the level of sensitivity of the soil moisture product to the penetration depth of the microwave signal. Moreover, microwave land surface emissivity has been considered in a number of studies as a surrogate for soil types in the Arabian Peninsula (Prigent et al. Citation1997, Norouzi et al. Citation2015a). The precipitation, soil moisture, water storage, and land surface emissivity products are detailed in .
In situ well observations collected over a sub-domain of the study area () were used to locally verify the GRACE anomalies and to examine the sensitivity of their response to the four precipitation products. The test sub-domain over the UAE is also arid and exhibits climate and weather conditions that are typical of arid regions and the rest of the peninsula (AlSarmi and Washington Citation2011, Ouarda et al. Citation2014, Sherif et al. Citation2014). Given the lack of such observations across the entire Arabian Peninsula, an agreement between well observations and both GRACE anomalies and precipitation products over the test site () in the UAE could be counted as a representative analysis of the entire peninsula. The records included monthly water depths (in meters) of 39 wells, extending from January 1989 to September 2014. Wells in the UAE are located near a network of small dams and flood wave breakers built on major wadis to maximize groundwater recharge and protect cities against inundations. The elevation of each well with respect to sea-level was also documented. After subtracting the well elevations, monthly water table elevations for each well were determined starting January 2002, to coincide with the temporal coverage of GRACE. Next, a monthly spatial average of the water table variations across the wells was computed over the test site. The response of the observed water table levels was investigated against the various precipitation products over the test site. Finally, monthly water storage anomalies were derived from the spatial average using the same storage reference period as GRACE, that is, January 2004 to December 2009 according to Swenson (Citation2012).
Numerous steps were taken to process the datasets, scale them to a common spatial and temporal reference, and remove potential errors. First, the global products were geographically subset using a land mask of the Arabian Peninsula. The daily temporal resolution of the TRMM and CMORPH products was resampled to monthly by calculating the cumulative monthly sum on a pixel-to-pixel basis. Next, their spatial aggregation from 0.25° to 0.5° was carried out to match the resolutions of the GPCC and WM rainfall products. The same spatial aggregation was applied to the AMSR-E soil moisture product as well. For comparisons with the GRACE readings, all products were resampled to 1° resolution using the global method of least square polynomial fitting. GRACE data are reported as total water storage anomalies. Consequently, and for the sake of consistency among the analyzed datasets, the products were normalized.
3 Methodology
A spatial average time series of rainfall over the study domain was derived from each product. The spatial averages were derived as the ratio of the accumulated pixel-per-pixel monthly sum to the total number of pixels over the peninsular region. The one-way analysis of variance (ANOVA) test was applied as the first step to assess the overall agreement of the datasets, while accounting for wet and dry months by dividing the time series above and below their ensemble means, respectively. The dry (June–September) and wet (November–April) seasons for much of the Arabian Peninsula are consistent with the region and typical hydrological regimes; however, accurate details on the seasonal rainfall distribution for the Arabian Peninsula using long-term data are generally not available in the literature (Almazroui et al. Citation2012). For example, large amounts of rainfall are observed over the northern Arabian Peninsula during the wet season from the Mediterranean and in the southern portion during the dry season from Indian Ocean Monsoons (Breed et al. Citation2005, Almazroui et al. Citation2012, Ouarda et al. Citation2014, Sherif et al. Citation2014). Therefore, in the present study, we quantitatively investigate the consistency of the products with respect to rainfall amounts by making use of the monthly ensemble mean of all data points over the Arabian Peninsula, rather than generally unstable temporal seasonality definitions.
The analysis was extended over the peninsula using the two-sample Student’s t-test between each product pair (six pairs) and classical Pearson correlation analysis on a pixel-per-pixel basis. Next, the consistency of the precipitation products and validity of the GRACE readings were investigated locally with the well observations over the UAE. This was followed by the consistency analysis at the regional scale using both the GRACE and AMSR-E products with each of the precipitation products within a fully distributed multivariate regression model (GTWR) configuration.
3.1 One-way ANOVA test
The ANOVA from Tamhane (Citation1977) is a hypothesis-testing technique used to determine whether there are any significant differences between the means of three or more groups. As useful as the ANOVA test is, it can only be applied if a number of conditions are met, namely, independent simple random samples (SRS), normally distributed populations, and equal standard deviations, i.e. the sample standard deviation is no more than double that of another, according to Tamhane (Citation1977).
The spatial averages are, in fact, independent SRS since they are distinct precipitation product spatial averages between 2000 and 2010. The Kolmogorov-Smirnov statistical hypothesis testing technique (Lilliefors Citation1967) was used to investigate the normality of the derived spatial averages. The test returned a failure to reject the null hypothesis of distribution normality at the 5% significance level for each of the four spatial average vectors.
Based on , the third condition is fulfilled since no sample has more than twice the standard deviation of another. The ANOVA test utilizes the F-statistic, which is the ratio of the group variability to the within-group variability. The null hypothesis of equal product means was rejected for a p-value ≤ 0.05 (5% significance level).
Table 2. Standard deviations of the four rainfall products’ spatial average time series.
3.2 Spatial Student’s t-test
The two-sample t-test utilizes the Student’s test statistic “t” (Plackett and Barnard Citation1990) to test the difference between two population means µ1 and µ2 when the population variances are unknown (see Equation (1)). The samples must be random, independent, and the populations normally distributed or the sample sizes equal to or greater than 30, all of which are applicable to the datasets used here.
where represents the sample standard deviation and
represents the standard error (see Equation (3)), determined as follows.
The pooled estimate of the standard deviation is:
where n and s represent the sample size and standard deviation, respectively.
And the standard error for the distribution is:
with n1 + n2 – 2 degrees of freedom.
The two-sample t-test was conducted between every combination of two products (six combinations) on a pixel-per-pixel basis. If the test p-value was less than the 5% significance level, the null hypothesis of equal means was rejected for that pixel.
3.3 Spatial correlation analysis and lag time determination
The Pearson correlation coefficients (PCCs) (Benesty et al. Citation2009) were calculated on a pixel-by-pixel basis between the precipitation products to further explore their spatial pattern of agreement. Also, the correlation metrics were determined between the rainfall products and both the AMSR-E and GRACE (time-lagged correlations) products to investigate the spatial consistency of their response to the different precipitation drivers. We expect instantaneous responses of the soil moisture product to the rainfall products, as the ASMR-E soil moisture retrievals are sensitive to the top soil layer of rapid wettability. However, a delayed response is expected between the rainfall products and the GRACE product due to the impact of soil permeability on groundwater flow. This lag is also subject to spatial variability with the differences in soil types, geological stratification, topography, and evapotranspiration rates across the peninsula. The lag time was determined through cross-correlation analysis (Knapp and Carter Citation1976) as the argument of the maximum correlation, which represents the point in time where the time series of GRACE anomalies are best aligned with the precipitation retrievals.
3.4 Geographically temporally weighted regression (GTWR)
The geographically and temporally weighted regression (GTWR) technique was applied to relate water storage anomalies inferred from GRACE to key hydrological components such as precipitation and soil moisture, and other influential factors. Such regression would be very relevant to eventually estimate variability in water storage from variables that are available at spatial resolution higher than GRACE (Wehbe et al. Citation2017).
Traditional regression modeling approaches, such as ordinary least square regression (OLS), fail to account for spatiotemporal interdependencies among the studied variables. Fotheringham et al. (Citation2003) proposed geographically weighted regression (GWR) to account locally for spatial autocorrelations through location-specific weighting in the original regression equation, expressed as:
where denotes the two-dimensional coordinates of the observation i in space,
represents the intercept value, and
represents a set of values of parameters at point i. The coefficients in the GWR model are dependent on location rather than assumed to be constant. Hence, the variability in the parametric estimations captures the existing spatial non-stationarity in the data structures. Although the GWR technique accounts for spatial non-stationarity and, therefore, provides more accurate model representations for certain spatial data in various environmental applications, the temporal non-stationarity remains neglected in the above framework.
To avoid this limitation, geographically and temporally weighted regression (GTWR) was developed as a local linear regression model that can account for both spatial and temporal non-stationarity (Huang et al. Citation2010). The GTWR from Huang et al. (Citation2010) provides a local weighting scheme by simultaneously combining the methodologies of GWR and temporally weighted regression (TWR), extending Equation (4) as follows:
The estimation of weightings for each space-time observation i can be expressed as:
where is the spatiotemporal weight matrix based on the Euclidean distance and Gaussian distance decay-based functions in space-time domains. Therefore, the elements in the spatiotemporal weight matrix can be represented as
, where
and
denote the time-weighted and space-weighted elements (between observations i and j), respectively, expressed as:
with the temporal Euclidean distance between the observations as ; and
with the spatial Euclidean distance as .
The variable h is a non-negative parameter known as the bandwidth. In the present study, the cross-validation (CV) approach proposed by Cleveland (Citation1979) was employed to choose the optimal model bandwidth by minimizing the model residuals between the training and testing data. The Euclidean distance is quoted in degrees (lat-lon grid) and time in months. The fully distributed GTWR model is developed over the peninsular region as follows:
where represents the total water storage anomalies from GRACE, P denotes each of the precipitation products, SM represents AMSR-E soil moisture, and Elev represents the GTOPO-derived elevations at each point i in the peninsula at a 0.5° resolution. Each precipitation product was independently tested in the GTWR while the remaining parameters remained unchanged. Consequently, a series of four GTWR models were developed.
4 Results
4.1 ANOVA test on spatial average of precipitation products
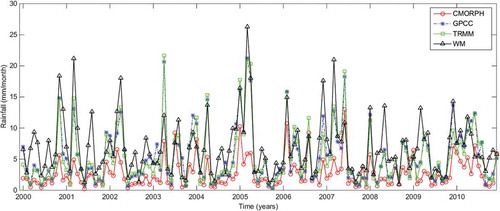
shows the time series of the spatial averages for the four precipitation products over the Arabian Peninsula. The datasets exhibit similar temporal variations including seasonality, with a record peak monthly precipitation in January 2005, where WM recorded 26 mm, followed by 21 mm from TRMM and GPCC, and 10 mm from WM. The WM and CMORPH datasets seem to persistently overestimate and underestimate, respectively, the recorded rainfall by TRMM and GPCC.
Figure 2. Monthly spatial average rainfall time series over the Arabian Peninsula (2000–2010).
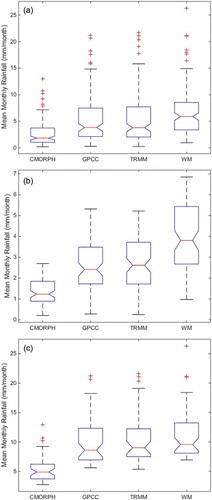
shows the box plots of the spatially averaged monthly rainfall products over the Arabian Peninsula for all months, dry months (below the ensemble mean), and wet months (above the ensemble mean). For the dry months, GPCC and TRMM () vary between 0 and 5 mm with a mean of 2.5 mm, while WM and CMORPH showed the highest and lowest variability with 3.5 mm and 1.2 mm, respectively. For the wet months (), TRMM, GPCC, and WM recorded a mean of 10 mm, while CMORPH continued to underestimate with a mean of 5 mm. summarizes the statistical results of the ANOVA test. For wet months, GPCC-TRMM, GPCC-WM, and TRMM-WM recorded p-values > 0.05 of 0.95, 0.31, and 0.66 (see ), while for dry months, only GPCC-TRMM recorded p-values > 0.05 of 0.99 (see ).
Table 3. ANOVA multi-comparison statistics results for all months (a), wet months (b), dry months (c).
Figure 3. ANOVA box plots for mean monthly AP rainfall: (a) all months, (b) dry months, and (c) wet months.
4.2 Spatial Student’s t-test for difference in means of precipitation products
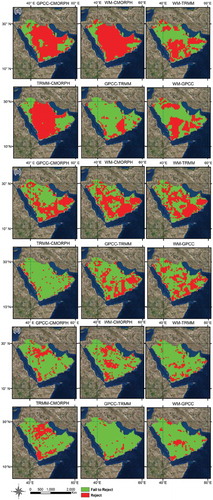
The significance testing for equality of means was extended spatially with Student’s t-test. The results are mapped for all pairwise combinations in . When considering all months (see ), any comparison with CMORPH showed statistically different means over more than 90% of the peninsula. The TRMM-GPCC comparison showed the most spatially dominant equality of means for over 95% of the peninsula, followed by the combinations of these two products with WM, which showed statistical equality of means over around 50% of the peninsula. For the dry months (), the best agreement was achieved between TRMM and CMORPH, while the highest discrepancy was found to be between WM and CMORPH. For the wet months (see ), TRMM and GPCC again showed the largest extent of equal means, while TRMM and CMORPH showed the least. This result was in line with the previously noted overestimation and underestimation biases in the spatial averages of the WM and CMORPH products, respectively. Better agreement across all product pairs was found during wet months, indicating poor performance consistency during light rain events, with the exception of CMORPH-TRMM, which performed comparatively better during dry months. The dominant agreement between GPCC and TRMM products was expected based on their independent assessments and calibration over Saudi Arabia (El Kenawy and McCabe Citation2016, Liu Citation2015).
Figure 4. Student’s t-test results for differences in means between product pairs for (a) all, (b) dry, and (c) wet seasons.
4.3 Spatial correlations between rainfall products
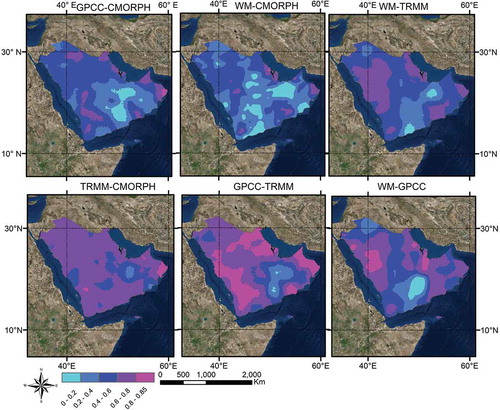
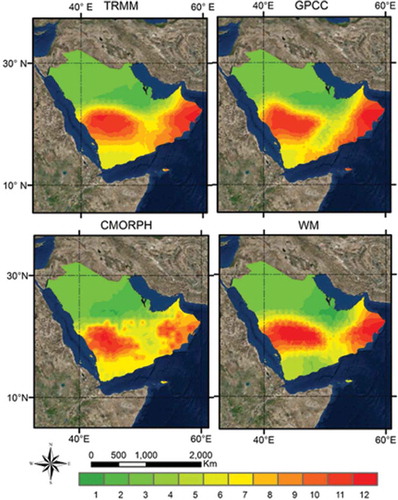
The highest correlations were recorded between TRMM and GPCC products, reaching 0.85 along the eastern and western coasts (see . Almost the entire peninsula showed a correlation greater than 0.6, which was considered a strong agreement as the two products are obtained through different mechanisms, namely remote sensing and ground-based for TRMM and GPCC, respectively. In contrast, the lowest correlations, ranging from 0.2 to 0.5, were observed between the WM remote sensing product and the CMORPH satellite–model blended product. All correlations with the CMORPH product were found to be comparatively lower, with the exception of the spatially dominating 0.6–0.8 correlations between TRMM and CMORPH. The strongest correlations were recorded in the Red Sea coastal area, especially in the Yemeni highlands. This could be attributed to the relatively higher precipitation and mountainous topography present there. Similar patterns were seen on the coast of the Arabian Gulf, especially around Qatar. The lowest correlations of 0.2 to 0.4 were consistently recorded across the products around the Saudi border with Yemen and Oman, where the primary soil type is sand dunes (see ).
Figure 5. Correlation maps between precipitation products.
4.4 Inter-comparison with in situ well observations over the UAE
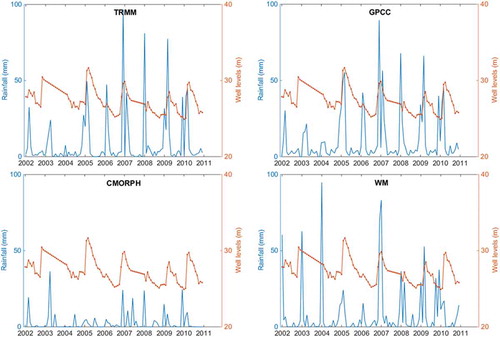
shows the scatter plot of the GRACE product versus the equivalent well observation anomalies over the UAE test site. A statistically significant (5% significance level) correlation of 0.53 was found over the test site, indicating a satisfactory agreement, despite the large difference in spatial extent between the GRACE product (~12 000 km2) and the test site area (~600 km2). It is worth noting that GRACE detects gravitational field changes of the total column of terrestrial water, which may be affected by many factors, particularly oil well pumping which is commonly found across the study domain. The effect of reservoir pumping was neglected, as most of it is located in offshore locations as opposed to inland. shows the time series of TRMM, GPCC, CMORPH, and WM rainfall versus the well levels. The annual peaks (around January) of TRMM and GPCC rainfall consistently match the water-level peaks, with time lags of around 2–4 months, while the peaks of WM and CMORPH show a less consistent impact on the water level time series, especially before 2005. This further corroborated the low accuracy of WM and CMORPH compared to the GPCC and TRMM products.
Figure 6. Scatter plot and correlation between GRACE and corresponding well observation anomalies.
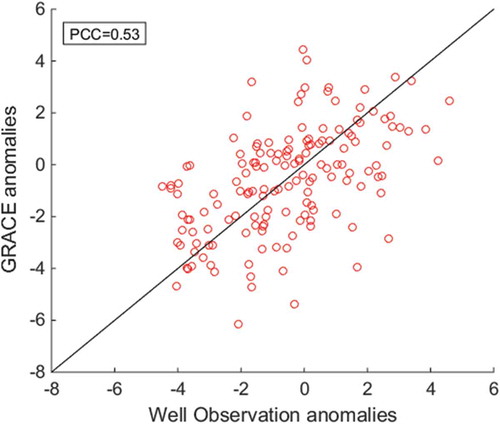
Figure 7. Time series of rainfall products and in situ well observations over the UAE test site.
4.5 Spatial correlations with AMSR-E soil moisture and GRACE water storage
The correlations of the soil moisture product of AMSR-E and precipitation products showed low (<0.4) but statistically significant (5% significance level) correlation results. Inspection of shows that the southern part of the peninsula consisting of Yemen, Oman, and part of Saudi Arabia showed almost no correlations (0–0.1) with the AMSR-E soil moisture estimates across all precipitation products. Higher correlations ranging from 0.2 to 0.3 were consistently recorded along the central and northwestern part of the peninsula with matching spatial patterns, especially for the WM, TRMM, and GPCC products, while the CMORPH product missed part of the correlation pattern along the mid-peninsula belt.
Figure 8. Cross-correlation maps between precipitation products and (a) ASMR-E and (b) GRACE.
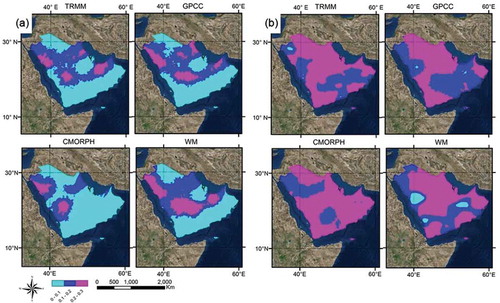
Cross-correlations between the rainfall products and GRACE estimates were found to range from 0.1 to 0.3, as shown in . The results are complemented by the lag times (see to achieve the recorded correlations. The peak correlation of 0.3 was recorded mostly in the low lag time northern part of the peninsula (<6 months), especially with TRMM and GPCC, as the most reliable products. On the other hand, correlations are almost absent over the high lag time southern part of the peninsula (>6 months). The spatial variation in lag times is attributed mainly to the flat versus highland topography of the northern (low lag times) and southern (high lag times) parts of the peninsula, respectively. The spatial discrepancies in lag time variations also showed similarities with the soil-type distribution (see ), as the northern lower lag times were recorded over primarily shallow and stony soils of high permeability, favoring rapid recharge, whereas, the southern higher lag times were recorded over very poorly developed soils and dune fields (moving sands).
Figure 9. Response time (months) maps between precipitation products and GRACE water storage anomalies.
4.6 Geographically and temporally weighted regression (GTWR)
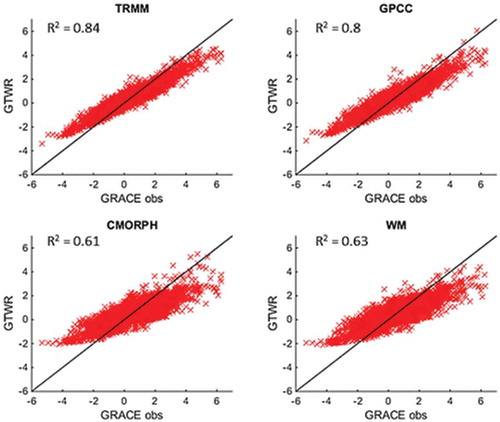
The predicted TWS anomalies from each of the four GTWR model configurations, using the distinct precipitation products as independent variables, are compared to the GRACE TWS observations in . The predicted TWS anomalies show the highest overestimation biases at the lower anomalies compared to the GRACE observations (below −2 cm/month), with the highest deviations recorded by the WM and CMORPH-driven GTWR models. also denotes the goodness-of-fit coefficients (R2), with the highest coefficient recorded by the TRMM product (0.84), followed closely by the GPCC product (0.8), along with the lower performing models driven by the WM (0.63) and CMORPH (0.61) products. Significance testing on the model coefficients showed that rainfall is the main driver of the GTWR configuration, followed by soil moisture, and topography.
Figure 10. GTWR-predicted TWS anomalies from each precipitation product versus GRACE observations.
5 Discussion
The ANOVA and spatial t-test results, along with the correlation metrics among the distinct precipitation products, suggested TRMM and GPCC as the most agreeable and reliable products for rainfall estimates over the Arabian Peninsula. The low performance of microwave-based remote sensing retrievals over desert observed by Norouzi et al. (Citation2015b) was captured over the sand-dune land cover around the Saudi border with Yemen and Oman. The TRMM satellite remote sensing product was more consistent than the GPCC gauge (ground-based) simulated product at low rainfall (dry season). This may be attributed to the absence of a dense gauge network and the outdated count of current raingauge stations across the peninsula to be incorporated in the GPCC product. The particular agreement between the GPCC and TRMM product was expected, given that the former is used for bias correction in the TMPA research product (Huffman et al. Citation2007).
The discrepancies between the precipitation products are primarily attributed to their distinct retrieval mechanisms and calibration techniques. Additionally, the sensors used in the retrieval of precipitation products are on different satellite platforms with different overpass times and observation geometries such as satellite, zenith, and solar angles. Second, the retrieval mechanisms depend on the wavelengths and frequencies, which exhibit varying sensitivity to water vapor. Microwave-based retrieval uses a single channel (e.g. the 22 GHz onboard AMSR-E and AMSR2) or multiple frequencies that sound the atmosphere to determine water vapor profiles. The microwave-based retrieval algorithms rely on overland ice-scattering techniques, hence the warm-rainfall processes without significant ice over the UAE result in the underestimation of the gauge-adjusted microwave algorithms in the CMORPH product (Nesbitt et al. Citation2008). Plus, when microwave sounding channels are used in precipitation retrieval, land surface emissivity often impacts brightness temperature, especially when window channels are used. An accurate estimation of land surface emissivity is required to account for this contribution. The estimation of land surface emissivity over desert is known to be challenging, particularly when the soil types are not well characterized in remote and hyper-arid regions.
The infrared-based retrieval utilizes the top-of-cloud temperature, which indicates vertical development. It is expected that the difference in the physics involved in the precipitation retrievals using microwave (active or passive) and infrared signals should lead to discrepancies in the obtained products. On the other hand, the TMPA research product (e.g., 3B42.V7) algorithm merges ground observations (e.g. gauge-based GPCC) with both microwave and infrared satellite observations. The variable number of stations used per grid in the GPCC product impacts its quality. The improved performance of the GPCC product over the WM product (both gauge based) is due to its higher gauge density, especially over northeastern UAE (Schneider et al. Citation2014).
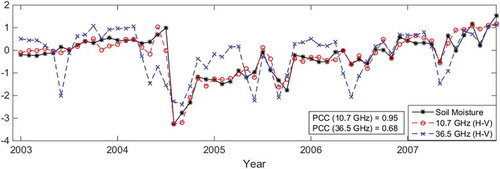
The low correlation between the rainfall products and the AMSR-E soil moisture product is attributed to the relatively coarse spatial resolution used (0.5°) compared to the small extent of most rainfall events across the peninsula. High coastal values of AMSR-E soil moisture are mostly attributed to isolated orographic events of limited geographic extent and short duration, commonly much less than the daily resolution used here. Hence, the locality and temporal intensity of such significant events are not captured by the precipitation products. The high operational frequency of ASMR-E limits the penetration depth to the top skin layer of the soil that is directly exposed to the increasing evapotranspiration rates found by El-Nesr et al. (Citation2010) across the peninsula. Also, the rapid infiltration following a rainfall event and the drying of the top few centimeters of the soil may have caused such low correlations at the monthly scale used here. Deeper penetration was sensed with lower frequencies such as the L-band (Notarnicola et al. Citation2012, Chaouch et al. Citation2013, Fares et al. Citation2013, Temimi et al. Citation2014). Al-Jassar and Rao (Citation2010) found that field-estimated surface soil moisture of up to 5 cm depth was consistently lower than AMSR-E soil moisture estimates. Gruhier et al. (Citation2010) also showed that soil moisture products obtained from satellites generally overestimate soil moisture values under dry conditions. The accuracy of AMSR-E soil moisture retrieval and its sensitivity to soil emissivity over desert regions has also been questionable (Njoku Citation1999, Norouzi et al. Citation2015a, Citation2015b). The polarization differences (H-V) at 10.7 GHz and 36.5 GHz of the AMSR-E/Aqua Monthly Global Microwave Land Surface Emissivity product from Norouzi et al. (Citation2011) were compared to the AMSR-E soil moisture variations from January 2003 to December 2007. Higher correlations of up to 0.95 with soil moisture were recorded at the lower 10.7 GHz frequency (H-V) retrievals across the peninsula. A representative normalized time series of the three retrievals is shown in , with correlations of 0.68 and 0.95 for the 36.5 and 10.7 GHz polarization differences, respectively. This stronger agreement with higher penetration depth (10.7 GHz frequency) explains the low correlations between the precipitation products and the low penetration ASMR-E soil moisture retrievals, which are subject to high evapotranspiration and the surface temperature variability reflected in the 36.5 GHz emissivity product shown in .
Figure 11. Normalized monthly mean variation of emissivity polarization difference (H-V at 10.7 and 36.5 GHz) and soil moisture from January 2003 to December 2007.
Water storage and precipitation are not always directly correlated. Their interaction is highly dependent on a number of variables including topography, soil and subsurface characteristics, vegetation cover, and evapotranspiration (Awange et al. Citation2014). Locations recording the highest cross-correlations (0.3) coupled with low time delays (0–3 months) can serve as a preliminary indication of direct recharge zones. Hence, water storage in the region of central Saudi Arabia, Kuwait, Qatar, and UAE is responsive to direct rainfall recharge. The differences in temporal and spatial resolutions between GRACE and the precipitation products could have impacted the low inter-agreement between the products. Also, a 6-month lag was recorded over the UAE, including the well locations, at a correlation of 0.3 with the GRACE estimates (see , while 2–4-month lags were observed with the well level fluctuations (see . This discrepancy can be attributed to the coarse resolution of the GRACE estimates (1°), covering areas beyond the extent of the rainfall-recharge zones, and the limitation of the point-based well observations. The region of southern Saudi Arabia, Oman, and Yemen seems to receive more indirect recharge from the remotely migrating groundwater component. The findings were in line with previous research on groundwater recharge in Saudi Arabia and the Arabian Peninsula (Alsharhan et al. Citation2001, Sultan et al. Citation2011, Milewski et al. Citation2014). The peninsula’s regional groundwater migration paths were found to be predominantly from the northeast of Saudi Arabia towards the southeast of the peninsula. The GTWR sensitivity testing to precipitation input resulted in a 0.84 goodness-of-fit coefficient between the predicted TWS anomalies and those observed by GRACE, when used in conjunction with the TRMM product. The recorded biases in the CMORPH and WM products through the statistical inter-comparison analyses were directly translated to their corresponding GTWR outputs with much lower performance (≤ 0.63).
6 Conclusion
The performance of global hydrological remote sensing products and their large-scale interdependencies have not been thoroughly addressed over arid regions such as the Arabian Peninsula. In the present study, four globally gridded precipitation products (TRMM, GPCC, CMORPH, and WM) were statistically inter-compared over the peninsular region. Their spatio-temporal interactions with soil moisture (AMSR-E) and total water storage (GRACE) estimates were investigated through multiple GTWR model configurations. The precipitation products and GRACE anomalies were also tested against in situ well observations over a recharge zone in northern UAE, before expanding the methodology to the peninsular scale.
Consistently low correlations (<0.4) were recorded between the four rainfall products and ASMR-E soil moisture values, which could be attributed to high evapotranspiration during the lag between the overpass time of AMSR-E, and therefore the time of soil moisture retrieval, and the overpass time of the different satellites used in the precipitation retrieval. For instance, if a rainfall event that was mapped with a specific satellite actually takes place, say, 2 hours before the overpass time of AMSR-E, a substantial amount of water will either evaporate or infiltrate to deeper soil layers, which AMSR-E frequencies are not sensitive to. This should reduce the agreement between satellite retrievals of precipitation and soil moisture. Overall, there are inherent discrepancies between satellite-based retrievals because of differences in their observation geometry, such as satellite angle, footprint, and overpass time. Despite these discrepancies, their use to verify other products, especially when in situ data are unavailable, remains relevant. Moreover, the mismatch, especially in desert areas, between soil surface temperature and soil microwave brightness temperature, which are both used in the retrieval of AMSR-E product, may impact the accuracy of soil moisture estimates (Njoku Citation1999, Njoku et al. Citation2003, Al-Jassar and Rao Citation2010, Norouzi et al. Citation2015a). Daily correlations are expected to give better results than the monthly scale considered for this study. The lag times and correlations between the rainfall products and GRACE water storage were found to dictate recharge mechanisms, revealing that the region of northern Saudi Arabia and UAE (northern AP) receives most of its water storage from rainfall, while the region of southern Saudi Arabia, Oman, and Yemen (southern AP) receives it from indirect recharge of remotely migrating northern groundwater. The GTWR sensitivity testing showed the highest predictive performance (R2 = 0.84) when forced by the TRMM product, with input precipitation being the primary driving variable, followed by soil moisture and topography. More accurate predictions can be achieved by including additional independent variables, namely, soil type, evapotranspiration, and vegetation cover in the current GTWR setup. The results of this study can aid in large-scale hydrological modeling, dam allocation, and regionally integrated water security planning.
Acknowledgements
The authors would like to thank the UAE Ministry of Climate Change and Environment for providing the in situ well observations over the northern UAE. Also, we thank the providers of the CMORPH (CPC MORPHing technique) high-resolution precipitation (60S-60N) and the global (land) precipitation and temperature Willmott & Matsuura dataset, University of Delaware. The Tropical Rainfall Measurement Mission (TRMM) 3B42 data were provided by the NASA/Goddard Space Flight Center and archived at the NASA GES DISC. The Global Climatology Precipitation Center (GPCC) data were obtained from the NOAA/OAR/ESRL PSD, Boulder, Colorado, USA. AMSR-E data were produced by Remote Sensing Systems and sponsored by the NASA AMSR-E Science Team and the NASA Earth Science MEaSUREs Program. GRACE land data were also provided by the NASA MEaSUREs Program. The authors would like to thank Dr Abdulla Al Mandous, Executive Director of the National Center of Meteorology (NCM), and Alya Al Mazroui, Director of the UAE Research Program for Rain Enhancement Science (UAEREP) at NCM, Abu Dhabi, UAE, for their continued support. The associate editor, Dr Shinjiro Kanae, and the anonymous reviewers are thanked for their valuable comments and suggestions that improved the quality of the paper.
Disclosure statement
No potential conflict of interest was reported by the authors.
Additional information
Funding
References
- Adler, R.F., et al., 2001. Intercomparison of global precipitation products: the third Precipitation Intercomparison Project (PIP-3). Bulletin of the American Meteorological Society, 82 (7), 1377. doi:10.1175/1520-0477(2001)082<1377:IOGPPT>2.3.CO;2
- Ahmed, M., et al., 2011. Integration of GRACE (Gravity Recovery and Climate Experiment) data with traditional data sets for a better understanding of the time-dependent water partitioning in African watersheds. Geology, 39 (5), 479–482. doi:10.1130/G31812.1
- Al-Jassar, H.K. and Rao, K.S., 2010. Monitoring of soil moisture over the Kuwait desert using remote sensing techniques. International Journal of Remote Sensing, 31 (16), 4373–4385. doi:10.1080/01431160903258233
- Almazroui, M., 2011. Calibration of TRMM rainfall climatology over Saudi Arabia during 1998–2009. Atmospheric Research, 99 (3), 400–414. doi:10.1016/j.atmosres.2010.11.006
- Almazroui, M., et al., 2012. Recent climate change in the Arabian Peninsula: seasonal rainfall and temperature climatology of Saudi Arabia for 1979–2009. Atmospheric Research, 111, 29–45. doi:10.1016/j.atmosres.2012.02.013
- AlSarmi, S. and Washington, R., 2011. Recent observed climate change over the Arabian Peninsula. Journal of Geophysical Research: Atmospheres, 116, D11. doi:10.1029/2010JD015459
- Alsharhan, A.S., et al., 2001. Hydrogeology of an arid region: the Arabian Gulf and adjoining areas: the Arabian Gulf and adjoining areas. Elsevier.
- Arkin, P.A. and Xie, P., 1994. The global precipitation climatology project: first algorithm intercomparison project. Bulletin of the American Meteorological Society, 75 (3), 401–419. doi:10.1175/1520-0477(1994)075<0401:TGPCPF>2.0.CO;2
- Awange, J., et al., 2014. Characterization of Ethiopian mega hydrogeological regimes using GRACE, TRMM and GLDAS datasets. Advances in Water Resources, 74, 64–78. doi:10.1016/j.advwatres.2014.07.012
- Benesty, J., et al., 2009. Pearson correlation coefficient. In: Noise reduction in speech processing. Berlin: Springer, 1–4.
- Breed, D., et al., 2005. Precipitation development in convective clouds over the eastern Arabian Peninsula. In: 16th Conference on Planned and Inadvertent Weather Modification (85th AMS Annual), San Diego, CA, 9–13.
- Chaouch, N., et al., 2013. Multi-stage inversion method to retrieve soil moisture from passive microwave measurements over the Mackenzie River basin. Vadose Zone Journal, 12, 3. doi:10.2136/vzj2012.0134
- Chen, S., et al., 2013. Similarity and difference of the two successive V6 and V7 TRMM multisatellite precipitation analysis performance over China. Journal of Geophysical Research: Atmospheres, 118 (23), 13,060–013,074.
- Chokngamwong, R. and Chiu, L.S., 2008. Thailand daily rainfall and comparison with TRMM products. Journal of Hydrometeorology, 9 (2), 256–266. doi:10.1175/2007JHM876.1
- Cleveland, W.S., 1979. Robust locally weighted regression and smoothing scatterplots. Journal of the American Statistical Association, 74 (368), 829–836. doi:10.1080/01621459.1979.10481038
- Costa, M.H. and Foley, J.A., 1998. A comparison of precipitation datasets for the Amazon basin. Geophysical Research Letters, 25 (2), 155–158. doi:10.1029/97GL03502
- DAAC, L., 2004. Global 30 Arc-Second Elevation Data Set GTOPO30. Land Process Distributed Active Archive Center.
- De Pauw, E., 2002. An agroecological exploration of the Arabian Peninsula. Beirut: International Center for Agricultural Research in the Dry Areas. Available from: http://www.icarda.org/
- El Kenawy, A.M. and McCabe, M.F., 2016. A multi‐decadal assessment of the performance of gauge‐and model‐based rainfall products over Saudi Arabia: climatology, anomalies and trends. International Journal of Climatology. 36 (2), 656–674.
- El-Nesr, M., Alazba, A., and Abu-Zreig, M., 2010. Analysis of evapotranspiration variability and trends in the Arabian Peninsula. American Journal of Environmental Sciences, 6 (6), 535–547. doi:10.3844/ajessp.2010.535.547
- Fares, A., et al., 2013. In-situ and remote soil moisture sensing technologies for vadose zone hydrology. Vadose Zone Journal, 12, 2. doi:10.2136/vzj2013.03.0058
- Fekete, B.M., et al., 2004. Uncertainties in precipitation and their impacts on runoff estimates. Journal of Climate, 17 (2), 294–304. doi:10.1175/1520-0442(2004)017<0294:UIPATI>2.0.CO;2
- Fotheringham, A.S., Brunsdon, C., and Charlton, M., 2003. Geographically weighted regression: the analysis of spatially varying relationships. Chichester: John Wiley & Sons.
- Ghebreyesus, D.T., et al., 2016a. A multi-satellite approach for water storage monitoring in an arid watershed. Geosciences, 6 (3), 33. doi:10.3390/geosciences6030033
- Ghebreyesus, D.T., et al., 2016b. Remote sensing applications for monitoring water resources in the UAE using Lake Zakher as a water storage gauge. In: Emerging issues in groundwater resources. Cham: Springer, 145–157.
- Groucutt, H.S. and Petraglia, M.D., 2012. The prehistory of the Arabian peninsula: deserts, dispersals, and demography. Evolutionary Anthropology: Issues, News, and Reviews, 21 (3), 113–125. doi:10.1002/evan.v21.3
- Gruhier, C., et al., 2010. Soil moisture active and passive microwave products: intercomparison and evaluation over a Sahelian site. Hydrology and Earth System Sciences, 14 (1), 141–156. doi:10.5194/hess-14-141-2010
- Haile, A.T., Habib, E., and Rientjes, T., 2013. Evaluation of the Climate Prediction Center (CPC) morphing technique (CMORPH) rainfall product on hourly time scales over the source of the Blue Nile River. Hydrological Processes, 27 (12), 1829–1839. doi:10.1002/hyp.v27.12
- Huang, B., Wu, B., and Barry, M., 2010. Geographically and temporally weighted regression for modeling spatio-temporal variation in house prices. International Journal of Geographical Information Science, 24 (3), 383–401. doi:10.1080/13658810802672469
- Huffman, G.J., 1997. Estimates of root-mean-square random error for finite samples of estimated precipitation. Journal of Applied Meteorology, 36 (9), 1191–1201. doi:10.1175/1520-0450(1997)036<1191:EORMSR>2.0.CO;2
- Huffman, G.J., et al., 2007. The TRMM multisatellite precipitation analysis (TMPA): quasi-global, multiyear, combined-sensor precipitation estimates at fine scales. Journal of Hydrometeorology, 8 (1), 38–55. doi:10.1175/JHM560.1
- Huffman, G.J. and Bolvin, D.T., 2013. TRMM and other data precipitation data set documentation. Greenbelt, MD: NASA, 1–40.
- Joyce, R.J., et al., 2004. CMORPH: A method that produces global precipitation estimates from passive microwave and infrared data at high spatial and temporal resolution. Journal of Hydrometeorology, 5 (3), 487–503. doi:10.1175/1525-7541(2004)005<0487:CAMTPG>2.0.CO;2
- Kirchner, J.W., 2009. Catchments as simple dynamical systems: catchment characterization, rainfall‐runoff modeling, and doing hydrology backward. Water Resources Research, 45, 2. doi:10.1029/2008WR006912
- Knapp, C. and Carter, G., 1976. The generalized correlation method for estimation of time delay. IEEE Transactions on Acoustics, Speech, and Signal Processing, 24 (4), 320–327. doi:10.1109/TASSP.1976.1162830
- Krakauer, N.Y. and Temimi, M., 2011. Stream recession curves and storage variability in small watersheds. Hydrology and Earth System Sciences, 15 (7), 2377. doi:10.5194/hess-15-2377-2011
- Landerer, F. and Swenson, S., 2012. Accuracy of scaled GRACE terrestrial water storage estimates. Water Resources Research, 48, 4. doi:10.1029/2011WR011453
- Laws, K.B., Janowiak, J., and Huffman, G., 2003. Verification of rainfall estimates over Africa using RFE. In: NASA MPA-RT and CMORPH, AMS 18th Conference on Hydrology, Seattle, WA.
- Lilliefors, H.W., 1967. On the Kolmogorov-Smirnov test for normality with mean and variance unknown. Journal of the American Statistical Association, 62 (318), 399–402. doi:10.1080/01621459.1967.10482916
- Liu, Z., 2015. Evaluation of precipitation climatology derived from TRMM multi-satellite precipitation analysis (TMPA) monthly product over land with two gauge-based products. Climate, 3 (4), 964–982. doi:10.3390/cli3040964
- Milewski, A., et al., 2009. RESDEM, a tool for integrating temporal remote sensing data for use in hydrogeologic investigations. Computers & Geosciences, 35 (10), 2001–2010. doi:10.1016/j.cageo.2009.02.010
- Milewski, A., et al., 2014. Geologic and hydrologic settings for development of freshwater lenses in arid lands. Hydrological Processes, 28 (7), 3185–3194. doi:10.1002/hyp.9823
- Milewski, A., Elkadiri, R., and Durham, M., 2015. Assessment and comparison of tmpa satellite precipitation products in varying climatic and topographic regimes in morocco. Remote Sensing, 7 (5), 5697–5717. doi:10.3390/rs70505697
- Nesbitt, S.W., Gochis, D.J., and Lang, T.J., 2008. The diurnal cycle of clouds and precipitation along the Sierra Madre Occidental observed during NAME-2004: implications for warm season precipitation estimation in complex terrain. Journal of Hydrometeorology, 9 (4), 728–743. doi:10.1175/2008JHM939.1
- Njoku, E.G., 1999. AMSR land surface parameters, algorithm theoretical basis document, version 3.0. Pasadena, CA: NASA Jet Propulsion Laboratory.
- Njoku, E.G., et al., 2003. Soil moisture retrieval from AMSR-E. Geoscience and Remote Sensing, IEEE Transactions On, 41 (2), 215–229. doi:10.1109/TGRS.2002.808243
- Norouzi, H., et al., 2011. The sensitivity of land emissivity estimates from AMSR-E as C and X bands to surface properties. Hydrology and Earth System Sciences, 15 (11), 3577–3589
- Norouzi, H., et al., 2015a. Inferring land surface parameters from the diurnal variability of microwave and infrared temperatures. Physics and Chemistry of the Earth, Parts A/B/C, 83, 28–35. doi:10.1016/j.pce.2015.01.007
- Norouzi, H., et al., 2015b. Assessment of the consistency among global microwave land surface emissivity products. Atmospheric Measurement Techniques, 8 (3), 1197. doi:10.5194/amt-8-1197-2015
- Notarnicola, C., et al., 2012. Inferring soil moisture variability in the Mediterranean Sea area using infrared and passive microwave observations. Canadian Journal of Remote Sensing, 38 (1), 46–59. doi:10.5589/m12-011
- Ouarda, T., et al., 2014. Evolution of the rainfall regime in the United Arab Emirates. Journal of Hydrology, 514, 258–270. doi:10.1016/j.jhydrol.2014.04.032
- Plackett, R. and Barnard, G., 1990. Student: a statistical biography of William Sealy Gosset: based on writings by E [gon] S [harpe] Pearson. Oxford: Clarendon.
- Prigent, C., Rossow, W.B., and Matthews, E., 1997. Microwave land surface emissivities estimated from SSM/I observations. Journal of Geophysical Research: Atmospheres, 102 (D18), 21867–21890. doi:10.1029/97JD01360
- Rafieeinasab, A., et al., 2015. Improving high-resolution quantitative precipitation estimation via fusion of multiple radar-based precipitation products. Journal of Hydrology, 531, 320–336. doi:10.1016/j.jhydrol.2015.04.066
- Reichle, R.H., et al., 2007. Comparison and assimilation of global soil moisture retrievals from the Advanced Microwave Scanning Radiometer for the Earth Observing System (AMSR‐E) and the Scanning Multichannel Microwave Radiometer (SMMR). Journal of Geophysical Research: Atmospheres, 112, D9. doi:10.1029/2006JD008033
- Robock, A., et al., 2000. The global soil moisture data bank. Bulletin of the American Meteorological Society, 81 (6), 1281–1299. doi:10.1175/1520-0477(2000)081<1281:TGSMDB>2.3.CO;2
- Rossow, W.B. and Schiffer, R.A., 1999. Advances in understanding clouds from ISCCP. Bulletin of the American Meteorological Society, 80 (11), 2261. doi:10.1175/1520-0477(1999)080<2261:AIUCFI>2.0.CO;2
- Schneider, U., et al., 2014. GPCC’s new land surface precipitation climatology based on quality-controlled in situ data and its role in quantifying the global water cycle. Theoretical and Applied Climatology, 115 (1–2), 15–40. doi:10.1007/s00704-013-0860-x
- Sherif, M., et al., 2014. Analysis of rainfall, PMP and drought in the United Arab Emirates. International Journal of Climatology, 34 (4), 1318–1328. doi:10.1002/joc.3768
- Stocker, E.F., et al., 2015. Global Precipitation Measurement (GPM) Mission: precipitation Processing System (PPS) GPM mission gridded text products provide surface precipitation retrievals. NASA Technical Reports Server (NTRS).
- Sultan, M., et al., 2011. Modern recharge to fossil aquifers: geochemical, geophysical, and modeling constraints. Journal of Hydrology, 403 (1), 14–24. doi:10.1016/j.jhydrol.2011.03.036
- Swenson, S., 2012. GRACE Monthly Land Water Mass Grids NETCDF Release 5.0. Pasadena, CA: Physical Oceanography Distributed Active Archive Center (PO. DAAC). doi:10.5067/TELND-NC005.
- Swenson, S. and Wahr, J., 2006. Post‐processing removal of correlated errors in GRACE data. Geophysical Research Letters, 33, 8. doi:10.1029/2005GL025285
- Tamhane, A.C., 1977. Multiple comparisons in model I one-way ANOVA with unequal variances. Communications in Statistics-Theory and Methods, 6 (1), 15–32. doi:10.1080/03610927708827466
- Temimi, M., et al., 2014. Soil moisture retrieval using ground-based L-band passive microwave observations in northeastern USA. Vadose Zone Journal, 13, 3. doi:10.2136/vzj2013.06.0101
- Wang, X.L. and Lin, A., 2015. An algorithm for integrating satellite precipitation estimates with in situ precipitation data on a pentad time scale. Journal of Geophysical Research: Atmospheres, 120 (9), 3728–3744.
- Wehbe, Y., et al., 2017. Assessment of the consistency among global precipitation products over the United Arab Emirates. Journal of Hydrology: Regional Studies, 12, 122–135.
- Wen, Y., 2015. Towards improved QPE by capitalizing ground-and space-based precipitation measurements. Norman, OK: University of Oklahoma
- Willmott, C.J., Matsuura, K., and Legates, D., 2001. Terrestrial air temperature and precipitation: monthly and annual time series (1950–1999) version, 1.02. Newark, DE: Center for Climate Research,University of Delaware. Available from: http://climate. geog. udel. edu/climate/html_pages/archive. html
- Willmott, C.J. and Robeson, S.M., 1995. Climatologically aided interpolation (CAI) of terrestrial air temperature. International Journal of Climatology, 15 (2), 221–229. doi:10.1002/(ISSN)1097-0088
- Yan, E., et al., 2010. Remote sensing based approach to improve regional estimation of renewable water resources for sustainable development. In: Proceedings of US–Egypt Workshop on Space Technology and Geo-information for Sustainable Development. Cairo, Egypt, 14–17.
- Yatagai, A., et al., 2012. APHRODITE: constructing a long-term daily gridded precipitation dataset for Asia based on a dense network of rain gauges. Bulletin of the American Meteorological Society, 93 (9), 1401–1415. doi:10.1175/BAMS-D-11-00122.1
- Zhang, L., et al., 1999. Estimation of soil moisture and groundwater recharge using the TOPOG_IRM model. Water Resources Research, 35 (1), 149–161. doi:10.1029/98WR01616