
ABSTRACT
Wastewater effluents from irrigation and the domestic and industrial sectors have serious impacts in deteriorating water quality in many rivers, particularly in areas under tidal influence. There is a need to develop an approach that considers the impact of human and natural causes of salinization. This study uses a multi-objective optimization–simulation model to investigate and describe the interactions of such impacts in the Shatt al-Arab River, Iraq. The developed model is able to reproduce the salinity distribution in the river given varying conditions. The salinity regime in the river varies according to different hydrological conditions and anthropogenic activities. Due to tidal effects, salinity caused by drainage water is seen to intrude further upstream into the river. The applied approach provides a way to obtain optimal solutions where both river salinity and deficit in water supply can be minimized. The approach is used for exploring the trade-off between these two objectives.
Editor R. Woods; Associate editor T. Okruszko
Introduction
Improving water allocation strategies for different water uses among different stakeholders is crucial for social and economic development. Designing such strategies for multiple purposes is complex if water scarcity conditions are prevalent. Distribution of river water, whether for irrigation, industrial or domestic use, requires a water quality standard. Seawater intrusion and increasing agricultural and domestic water demands result in salinity increases in many tidal rivers (e.g. the Shatt al-Arab, Nile and Indus Rivers). Managing freshwater inflows is one of the important control measures to maintain salinity fluctuations caused by salinity intrusion into river estuaries to a minimum. However, return flows from irrigation, industrial and domestic effluents increase salinity at their points of discharge and beyond in the downstream direction.
Various methods are now available to model water allocation in river basins. These methods lead to models that are classified into two categories: optimization and simulation models. The determination of an allocation policy is not trivial due to inflow uncertainty and conflicting demands on scarce water resources. Optimization techniques have the ability to deal with multiple conflicting objectives in complex water systems.
Engineering optimization approaches are effective for planning purposes useful for real-time operation systems and complex optimization problems (e.g. Barros et al. Citation2003, Labadie Citation2004, Farthing et al. Citation2012, Kourakos and Mantoglou Citation2013). In water resources, optimization models have capabilities, depending on their sophistication, to perform assessments of the natural, physical and human–water components that characterize a complex river basin system. In particular, integrated hydrological and economic models are well equipped to find optimal water allocation strategies in river basins (McKinney et al. Citation1999, Cai et al. Citation2006). For the task set in this paper, namely to minimize salinization as well as minimize the deficit for irrigation and domestic water supply in a river system, a hydrodynamic salt intrusion simulation model is required to evaluate the optimal water allocation strategies considering salinity variation under tidal influence.
Little is known about salinity management, in general, when there is a combination of different salinity sources in a tidal river. There are, however, a few studies available, but these are limited in their scope and applicability and not applicable to the general multi-factor problems of salinity in a tidal river affected by a combination of irrigation practices, industrial effluents and urban discharges (quantity and type), the quality and quantity of upstream river inflow, and seawater intrusion. Mayer and Munoz-Hernandez (Citation2009) provided a state-of-the-art compilation of integrated models for water resource optimization, and identified the need for the inclusion of human and natural resources impacts of salinization due to wastewater return flows.
Most of the studies in the literature dealing with seawater intrusion only simulate the downstream part of the river, i.e. the estuary, and for that purpose data covering a complete tide cycle were used. It was necessary to use just one day time series of data. The hydrodynamic model was developed based on water level and current velocity and tested for salinity changes following a methodology widely used by other researchers, such as Liu et al. (Citation2004) Trancoso et al. (Citation2009) Vaz et al. (Citation2009), Carrivick et al. (Citation2012) and De Nijs and Pietrzak (Citation2012). Abdullah et al. (Citation2017) developed a one-dimensional (1-D) hydrodynamic and salt intrusion model. The important element in their study is that combined salinity sources have been modelled along a river that is under tidal influence. The salinity is caused not only by sea and river waters, but also by the return flows from different water users. The study looks at salinity gradients caused by combining impacts of tides, return flows and domestic effluents along the river, while dealing with scarcity of data associated with discharges and salinity levels of different sources. For that purpose 10 monitoring stations were used to collect hourly water level and salinity for a complete hydrological year. Two discharge points were used in the model to simulate the impacts of water withdrawals and return flows along the river from both sides. The study concluded that the hydraulic status of the river for one full year is determined not only by the river flow and tidal forces, but also by the operation of the water system as a whole (i.e. water withdrawals and return flows). There was a need to develop the hydrodynamic model and then test it for spatiotemporal salinity changes caused by natural sources and human activities.
The objective of this study is to develop a multi-objective optimization–simulation model to identify efficient alternatives for water allocation at the Shatt al-Arab River (SAR). Such a study is necessary in order to mitigate the impact of high salinity concentrations and fluctuations associated with different salinity sources due to water use along the river. The model is used to account for different upstream inflows and salinity concentrations. Furthermore, optimal water allocations and strategies for different upstream conditions are investigated for irrigation and domestic uses.
Case study
Water resources management comprises scenarios, plans and actions to manage the available water resources in an efficient and equitable manner for the present and the future. It should aim to satisfy current and projected water requirements and at the same time control any likely impacts of floods, droughts and water pollution (Koudstaal et al. Citation1992, Loucks et al. Citation2000). Understanding and monitoring water fluxes between upstream and downstream portions of a river basin is necessary for proper governance of water resources (van der Zaag Citation2007). The Tigris–Euphrates basin, shared by Turkey, Syria, Iran and Iraq, has witnessed the construction of a number of water resources projects which are most often developed unilaterally. There are around 35 dams in operation, eight under construction and nine planned. These developments have altered both the water flow and water salinity patterns. The region most affected by the changes is the Shatt al-Arab River (SAR) basin (Abdullah et al. Citation2015). This tidal river is formed at the confluence of the Tigris and Euphrates rivers and eventually discharges into the Arabian Gulf.
shows the location of the SAR and its tributaries. Currently the Tigris is considered the main tributary to the SAR, while the water from the Euphrates is released into the SAR only during the wet season when it has lower salinity. Before the construction of major projects in the Tigris basin in 1988, the monthly average discharge into the SAR was around 200 m3/s, but it has since reduced significantly, and was 50 m3/s in 2014. Upstream developments not only decreased river discharge but also increased salinity. At the most downstream station in the Tigris, the salinity increased threefold from 0.6 to 1.8 kg/m3 over the period 1980–2002 (Abdullah et al. Citation2015). The SAR salinity changes in space and time. The salinity ranged from 0.25 kg/m3 in the upstream to 40 kg/m3 in the estuary (Abdullah et al. Citation2016). This variation was associated with different salinity sources including irrigation return flows, domestic effluents and seawater intrusion. Drainage water from irrigation and wastewater from domestic sectors discharge directly into the river. Also, the water draining from the surrounding marshes is saline. There are three major marshes in the region: Hawizeh, Hammar, and the central marshes connecting with the SAR through the Sweeb, Garmat Ali and Euphrates rivers (). The observed salinity in these marshes during 2014 ranged from 1.0 to 5.0 kg/m3 (Abdullah et al. Citation2016).
Figure 1. Location of the Shatt al-Arab River and the main features of the system.
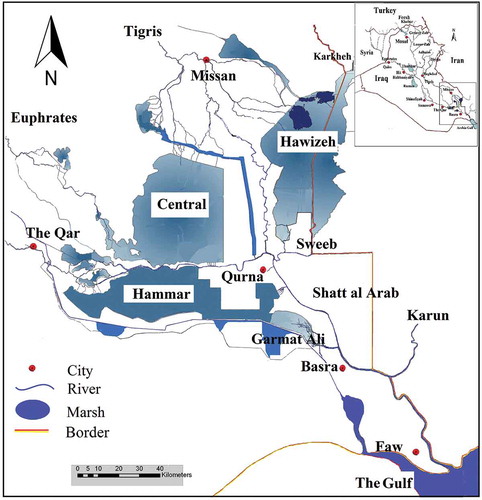
Increased water withdrawals upstream and along the river course have resulted in further seawater intrusion. Combined with wastewater inflow from several sources, this has resulted in salinity levels that are highly unsteady (dynamic) and variable both at seasonal and daily time scales. As a result, large areas of the southern region of Iraq are facing persistent deficit in water availability: a drinking water decline, with worsening prospects of increasing shortages. Salinity in the SAR will further lead to relinquishment of hitherto fertile farmland and colossal economic losses. More details about salinity of the SAR and contributing water bodies in upstream regions can be found in Abdullah et al. (Citation2015), Al-Furaiji et al. (Citation2015) and Brandimarte et al. (Citation2015).
Model development
A multi-objective optimization model was coupled with an existing 1-D numerical simulation model to optimize water allocations in the SAR. Seawater intrusion, return flows and upstream salinity are accounted for to obtain optimized solutions to this class of problems in salinity dynamics. Simulations of different water management practices can be conducted individually or in combination to solve for scenarios leading to minimum impact from salt transport. The following sub-sections describe this approach.
Simulation model
Salinity variation in the SAR was simulated by a 1-D hydrodynamic and salt intrusion model, which is available for use. The set-up, calibration and validation of the model is presented in detail in Abdullah et al. (Citation2017). The model is based on Delft3D and has been calibrated and validated with hourly time series of the SAR water levels and salinity data collected during the year 2014. In 2014, for the first time, 10 monitoring stations were installed to monitor water level, salinity and temperature along the SAR and its estuary. This provided the opportunity to correlate salinity variations to the changes in hydrological conditions and water levels due to combined impacts of tide and river discharge (Abdullah et al. Citation2016).
The combined effects of anthropogenic activities and natural factors on the salinity regime are more dominant during the irrigation season, when it is expected that water from return flows is at its maximum. Therefore, in this study, the selected period for simulations is 26 January–1 April, which corresponds with the irrigation season. The interval range of 8 weeks is also reasonable for attaining management objectives. The boundary conditions during this interval were the river discharge at the upstream boundary and the hourly measured tidal elevation at the downstream boundary. Salinity at the upstream boundary was specified by the minimum and maximum observed river salinity, 0.25 and 1.5 kg/m3, respectively. At the downstream boundary salinity was averaged over the period and was 30 kg/m3. The water and salinity levels at the beginning of the simulation period were specified as the initial conditions. The model was developed with 56 observation points to extract the computed salinity (). Drainage water consists of irrigation return flows and industrial and domestic effluents discharging into the SAR, mainly along its upper portion. Observations in the field and data analysis showed that the maximum impact of the drainage water was at a station near the city of Basrah. This station is located in the midcourse of the river (). The drainage water is represented by an outfall point near Basrah, corresponding to observation point 19 (). The average observed salinity at this station was used as the drainage water salinity (2.7 kg/m3). The flow rate of drainage water was estimated at 20 m3/s (Abdullah et al. Citation2017). This consists of 10 m3/s drainage from the marshes and domestic uses, and a further 10 m3/s from irrigation return flows. The latter value corresponds to 25% of average consumption (40 m3/s), the minimum required drainage volume according to Iraqi standards.
Figure 2. Schematic presentation of observation points 1–56 showing locations of domestic withdrawals (4), irrigation withdrawals (6), and drainage outfall (19).
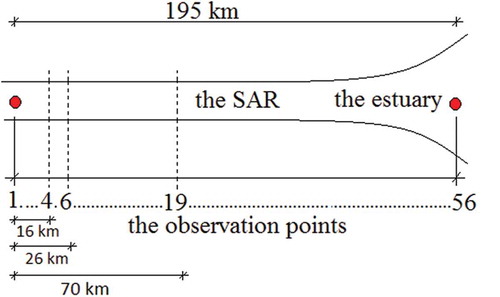
Water withdrawals for both domestic and irrigation uses were represented by two extraction points at distances of 16 and 26 km from the upstream boundary, located at observation points 4 and 6, respectively (). These are the locations suggested by the local water resources authority to divert water for domestic and irrigation purposes.
Optimization model
The optimization technique was used to establish a trade-off between the conflicting objectives of minimizing the water supply deficit and minimum salinity. This study aimed at managing the salinity variation along the SAR taking into account growing water demands and decreasing water inflows. Considering the drainage water components, salinity could be mitigated by releasing more water that would dilute and flush out saline water and also counteract seawater intrusion. Discharging more freshwater into the estuary would deprive other sectors of their source of water. On the other hand, the salinization impact of drainage water could be extended further upstream driven by tidal influence. Salinity in the upstream portion will be under combined effects: the upstream conditions of water quality and quantity and the downstream conditions of drainage water and seawater intrusion. Therefore, the optimization framework was developed as a multi-objective approach to reduce the impact of salinity changes on the ecosystem and water sectors (domestic and irrigation) under different prevailing conditions. The Monte Carlo technique was used as a computational algorithm for the optimization process coupled with the Delft3D simulation model. The Monte Carlo method is a computational algorithm used mainly for optimization, numerical integration and probability distribution. The Monte Carlo optimization technique is used for mathematical programming problems, especially nonlinear systems of equations (Dickman and Gilman Citation1989), and in optimization (Sakalauskas Citation2000, and Guda et al. Citation2001).
Two objective functions were considered. The first objective was to minimize the river water salinity along its course (salinity objective, F1), while the second tackled the deficit in water supply (for irrigation and domestic uses) (supply objective, F2). The optimization problem can be mathematically posed as:
where Save is the average salinity along the river excluding its estuary, averaged over the river stretch between observation points 1 (the upstream end) and 39 (65 km from the river mouth) (this is to avoid high salinity levels caused by seawater intrusion as well as to maintain seawater intrusion at that limit); D is the deficit of water supply from two main water uses, irrigation (ID) and domestic (DD); and the vector of decision variables x lies in the feasible space X determined from the equity and inequity constraints (C) represented mathematically as: 0 ≤ ID ≤ 50, 0 ≤ DD ≤ 10 and 0 ≤ S ≤ 2.1, where the maximum irrigation demand, ID = 50 m3/s, the maximum domestic demand, DD = 10 m3/s, and S stands for salinity. Water is not allowed to be used for consumption if the salinity exceeds the target limit of 2.1 kg/m3 (De Voogt et al. Citation2000). For this reason, an additional constraint is posed during the simulation to verify whether or not this condition is fulfilled. The maximum irrigation demand considered in this study is a combination of that estimated by the Water Resources Authority in Basrah, considering the available agricultural lands, and the maximum domestic demand estimated by the Water Treatment Department in Basrah, based on the current population of the region. The decision variable for the simulation model is the amount of water, A, to be allocated from the supply source to each water user, denoted Ai, where i designates the user. Available water is a function of the supply source, the season and the development scale. Although water availability varies from season to season and year to year depending on climatologic conditions, the river discharge is expressed equal to the low, average and high observed monthly discharge over the last two decades. This is to find the optimal water allocation for different uses for each river flow condition.
Coupling of optimization and simulation models
The multi-objective model, written in MATLAB, links optimization with simulation. presents a framework of the general algorithm. This code contains a rewritten subroutine within the simulation part which contains decision variables. The decision variables are generated randomly in the optimization code. A multi-objective optimization routine runs the simulation model for each decision variable. Salinity dynamics is simulated by the Delft3D model. Consequently, the profile of salinity along the river is analysed to evaluate the objective functions and the constraints, the maximum demands and maximum salinity levels. The optimization–simulation model was developed under different scenarios, in order to investigate the impact of salinity changes corresponding to different salinity and inflow levels in the upstream reaches of the SAR. According to the hydrological data obtained from the Iraqi Water Resources Authority, river discharge for the period 1988–2010 ranged between 20 and 120 m3/s; and the upstream salinity for the year 2014 ranged from 0.25 to 1.5 kg/m3 (Abdullah et al. Citation2015). The duration curve of the discharge for the period 1988–2010 is presented in . In order to assess the sensitivity of the salinity regime in the river to the drainage water considering different upstream conditions, six scenarios were developed using high, average and low river discharge, and maximum and minimum upstream salinity ().
Table 1. Simulated scenarios (Sc) of salt concentration for different upstream conditions.
Figure 3. General framework of the multi-objective optimization–simulation model.
Figure 4. Flow duration curve of the SAR based on 1988–2010.
Results
Simulation-based optimization
The results of salinity distributions at two withdrawal points (for domestic and irrigation supply) and an outfall point (for drainage water) are presented in . The optimization was used to minimize the average salinity along the river. Generally, average salinity increases in all scenarios but with different levels. Contrary to expectation, salinity was found to increase more in the case of minimum upstream salinity (0.25 kg/m3), but not with maximum salinity (1.5 kg/m3). Salinity interval ranges are bigger for both cases of maximum and minimum upstream salinity values. However, the amount of increase differs from one case to another. Hence, in the case of minimum salinity, Save increases by 100, 300 and 700% for high, average and low flow, respectively, whereas, in the case of maximum salinity levels, Save increases by 10, 30 and 60% for high, average and low flow, respectively. The different salinity ranges for different upstream conditions could be attributed to dilution and mixing processes along the river.
Figure 5. Salinity at withdrawals and outfall points (see for locations) for the six scenarios as a function of river-water salinity. Note that the axes have different scales for the different conditions. Grey represents the salinity where river water is not usable.
Upstream conditions are more dominant at the withdrawal points during high and average flow scenarios (Sc1-1–Sc2-2). Despite increases in Save, salinity remains almost constant at both domestic and irrigation withdrawal points, with slight increases during average flow. At the outfall point, however, salinity increases, but differently, during high and average flow in both minimum (0.25 kg/m3) and maximum (1.5 kg/m3) upstream salinity conditions. In the low-flow scenarios (Sc3-1 and Sc3-2), the differences are significant. Save for domestic, irrigation and outfall points could exceed the allowable limit (2.1 kg/m3). The grey domain in represents the salinity where river water is not usable; this increases in the downstream direction and extends further upstream with higher upstream salinity.
illustrates the salinity distribution at withdrawal and outfall points as a function of deficit in water supply. The results show that water demands can be satisfied during high-flow conditions. Drainage water combined with tidal influences has no impact on the salinity levels in the upstream region. However, during average flow conditions, drainage water could only increase salinity in the upstream region with full water supply, whereas, if water supply to domestic and irrigation uses is reduced by about 10 m3/s (16%), upstream salinity levels remain constant. During low-flow conditions, there is no possibility to satisfy all water demands, with deficits of around 7 m3/s (12%) and 20 m3/s (33%) in scenarios Sc3-1 and Sc3-2, respectively. Only if the supply deficit is at least 50% will there be no increases in upstream salinity levels. In contrast, salinity at the outfall point increases with increasing water supply in all scenarios (). For high-flow scenarios, Save rises to 1.1 and 1.9 kg/m3, respectively, for minimum and maximum salinity conditions, while it goes up to 2.5 kg/m3 in the other scenarios.
Figure 6. Salinity at withdrawals and outfall points for six scenarios as a function of water supply deficit. Note that the salinity y-axes have different scales for the different conditions.
The concentration ensemble of the simulations is presented in . Drainage water influences salinity in the downstream reaches under high river discharge. However, its impact extends to the upstream section with average river discharge and increases further with low river discharge. With minimum salinity levels (Sc1-1, Sc2-1 and Sc3-1), the salinity in the river varies more widely compared to maximum salinity levels (Sc1-2, Sc2-2 and Sc3-2). Seawater intrusion, however, varies according to river discharge and water supply. Consistent with expectation, seawater intrudes further upstream in the case of low river discharge and high water withdrawals.
Figure 7. Optimized salinity distribution along the SAR extracted from the 56 observation points (see ). Points D, I and O represent the locations of the withdrawals for domestic water supply, for irrigation water supply, and the outfall for drainage water, respectively (in grey: unfeasible solutions, i.e. average river water salinity >2.1 kg/m3).
The optimal solution
In a multi-objective optimization problem, one cannot get a single optimal solution that fulfills both objective functions simultaneously. Therefore, the aim of multi-objective optimization is not to search for the best solution but to find an efficient solution that minimizes both objective functions. In fact there are infinite numbers of possible solutions (called the Pareto efficiency). A graphical presentation of the two objective functions in the selected criterion space is presented in . The feasible ranges of optimal solutions are bounded by the deficit of water supply (at the upper left corner) and the average river water salinity (at the lower right corner, excluding the grey part). Considering water supply requirements, the grey part indicates that river salinity exceeds the maximum level for irrigation and domestic uses. Each corner represents the optimal benefit of its corresponding individual objective, while all other individual objectives are worse off. Moving from the lower right to upper left points on the convex efficiency front gives different weights to the two objective functions, which represent the trade-off between water demand deficit and average salinity.
Figure 8. Objective space of solutions for each of the six selected scenarios simulated 1000 times (in grey unfeasible solutions, i.e. average river water salinity >2.1 kg/m3).
System performance
To evaluate the water system performance under different upstream conditions, the results of one optimal solution for each scenario are presented in . For that purpose, the middle point of the efficiency front has been chosen that gives equal weight to both objective functions. The figure indicates that the salinity region in the river is influenced by the combined effect of drainage water and seawater intrusion. Tidal influence on the river water salinity extended further upstream with minimum salinity levels under average and low-flow conditions (Sc2-1 and Sc3-1), whereas it has almost the same extent with high river discharge. Therefore, all seawater intrusion distances are almost the same in scenarios Sc1-1 and Sc1-2, at around 30 km. During average flow, the seawater intrusion distance corresponding to minimum and maximum salinity levels increases from 40 to 60 km, and during low flow it increases from 80 to 90 km. One of the main findings is that seawater intrusion in the upstream is greater for low salinity levels of the river as compared to higher salinity levels. This is considered to be due to the difference between salinity of the river water and seawater; higher salinity difference increases the flux of seawater and allows a longer intruded distance. Out of the seawater intrusion domain, the highest salinity levels are at the outfall location, but this is reduced in both upstream and downstream directions.
Figure 9. Longitudinal salinity distribution considering different upstream conditions. Points D, I and O represent the locations of withdrawals for domestic water supply, irrigation water supply, and the outfall for drainage water, respectively.
Conclusions and recommendations
A multi-objective optimization model was developed by incorporating simulation and optimization to determine the impact of drainage water on the natural sources and water sectors under different scenarios. This approach was used to address the issue of river salinity changes considering the upstream salinity sources and the tidal influence downstream. Moreover, the water system performance was evaluated under different upstream conditions taking into account demand requirements and salinity variation. This is to assist the decision-making process for water resources management and development.
A Monte Carlo optimization algorithm was coupled to a Delft3D simulation model within the MATLAB environment. The optimizer code consisted of two objective functions to minimize deficit in water supply and manage the river water salinity to remain in the allowable range (<2.1 kg/m3). The simulation model was used to compute salinity results taking into account the quantity and quality of river and drainage water, water demands and seawater intrusion. The results were then evaluated by the optimization code to produce an efficiency front of optimal solutions.
Limits of water availability for human uses were obtained in terms of their salinity. The model was applied to the Shatt al-Arab River (SAR). Drainage into the SAR of saline water influences the salinity regime in the downstream and upstream reaches most significantly during low river flow. The range of water salinity variation is mainly governed by the salinity levels of the receiving water, where the impact of drainage water increases at lower salinity levels. Moreover, the impact of seawater extended further upstream at the low salinity levels of river water compared to the higher levels. These findings confirm the result of Abdullah et al. (Citation2017), who reported that seawater intrusion is highly correlated with river discharge, where the longer intrusion distance occurs during the dry period. Water demands can only be satisfied under high and average river discharge with salinity in the range 0.45–2.1 kg/m3. However, under low-flow conditions, not all water demands can be met, with deficits of 12 and 33% corresponding to minimum and maximum salinity levels of the upstream source. The results of the simulation-based approach by Abdullah et al. (Citation2017) showed an increase of seawater excursion and salinity along the river associated with different scenarios of water withdrawals and drainage. An optimization-based approach is recommended to determine the optimal water withdrawal and intrusion distance.
The approach presented herein may be used to explore and capture the impact of salinization sources on water sectors and the ecosystem, and is intended to provide an effective tool for supporting water resources planning and management. Ideally, this would be achieved by conserving computation time using a 1-D hydrodynamic model, a reasonably sized grid and time intervals with sufficient resolution, as well as using the simplest Monte Carlo optimization algorithm. Water management of salinity-related problems in rivers requires proper understanding of the discharge–seawater intrusion relationships. Several studies have examined this relationship, e.g. Whitney (Citation2010) and Becker et al. (Citation2010). One important factor in all studies is the impact of freshwater inflow on seawater intrusion. As pointed out by many researchers (see Vaz et al. Citation2009, Das et al. Citation2012), for effective water supply and water demand management an optimization–simulation approach provides better information about water quantity and water quality considering different hydrological conditions, tide impacts, water withdrawals and drained water (Grygoruk and Okruszko Citation2015, Cai et al. Citation2016). To help find more complex patterns for sustainable management of water resources, the existing model can be extended to include more dynamic conditions. For that purpose, further work is required considering dynamic salinization sources such as varying drainage volumes and/or salinity levels, and several outfall points for drainage water. This could guide the decision-making process in determining the optimal location of drainage water outfalls, while minimizing river salinity and seawater intrusion. Practically, the SAR authority is recommended to design an operational system of withdrawals from the system and drainage water into the system based on the salinity changes due to upstream conditions and the tidal cycle. Withdrawal points could be located at the upstream portion and drainage points at the lower portion. During low-flow river discharge conditions, the volume of water withdrawals should not exceed the volume of drainage water flowing into the lower portion to ensure that the excursion distance of seawater further upstream is contained.
Disclosure statement
No potential conflict of interest was reported by the authors.
References
- Abdullah, A.D., et al., 2015. Shatt al Arab River system under escalating pressure: a preliminary exploration of the issues and options for mitigation. International Journal of River Basin Management, 13 (2), 215–227. doi:10.1080/15715124.2015.1007870
- Abdullah, A.D., et al., 2016. Anthropogenic and tidal influences on salinity levels and variability of the Shatt al-Arab River. International Journal of River Basin Management, 14 (3), 357–366. doi:10.1080/15715124.2016.1193509
- Abdullah, A.D., et al., 2017. Analysis of possible actions to manage the longitudinal changes of water salinity in a tidal river. Water Resources Management, 31, 2157–2171. doi:10.1007/s11269-017-1634-5
- Al-Furaiji, M., et al., 2015. Evaluation of water demand and supply in the south of Iraq. Journal of Water Reuse and Desalination. doi:10.2166/wrd.2015.043
- Barros, M.T.L., et al., 2003. Optimization of large-scale hydropower system operations. Journal of Water Resources Planning and Management, 129 (3), 178–188. doi:10.1061/(ASCE)0733-9496(2003)129:3(178)
- Becker, M.L., Luettich, R.A., and Mallin, M.A., 2010. Hydrodynamic behavior of the Cape Fear River and estuarine system: A synthesis and observational investigation of discharge–salinity intrusion relationships. Estuarine, Coastal and Shelf Science, 88, 407–418. doi:10.1016/j.ecss.2010.04.022
- Brandimarte, L., Popescu, I., and Neamah, N.K., 2015. Analysis of fresh-saline water interface at the Shatt Al-Arab estuary. International Journal of River Basin Management, 13 (1), 17–25. doi:10.1080/15715124.2014.945092
- Cai, H., Savenije, H.H.G., and Gisen, J.I.A., 2016. A coupled analytical model for salt intrusion and tides in convergent estuaries. Hydrological Sciences Journal, 61 (2), 402–419. doi:10.1080/02626667.2015.1027206
- Cai, X., Ringler, C., and Rosegrant, M.W., 2006. Modeling water resources management at the basin level, methodology and application to the Maipo River Basin. Washington, DC: International Food Policy Research Institute, Research Report 149.
- Carrivick, J.L., et al., 2012. Numerical modelling of spatio-temporal thermal heterogeneity in a complex river system. Journal of Hydrology, 414–415, 491–502. doi:10.1016/j.jhydrol.2011.11.026
- Das, A., et al., 2012. Impacts of Mississippi river diversions on salinity gradients in a deltaic Louisiana Estuary: ecological and management implications. Estuarine, Coastal and Shelf Science, 111, 17–26. doi:10.1016/j.ecss.2012.06.005
- De Nijs, M.A.J. and Pietrzak, J.D., 2012. Saltwater intrusion and ETM dynamics in a tidally-energetic stratified estuary. Ocean Modelling, 49–50, 60–85. doi:10.1016/j.ocemod.2012.03.004
- De Voogt, K., et al., 2000. Modelling water allocation between a wetland and irrigated agriculture in the Gediz Basin, Turkey. International Journal of Water Resources Development, 16 (4), 639–650. doi:10.1080/713672530
- Dickman, B.H. and Gilman, M.J., 1989. Monte Carlo optimization. Journal of Optimization Theory and Applications, 60 (1), 149–157. doi:10.1007/BF00938806
- Farthing, M.W., et al., 2012. Effects of model resolution on optimal design of subsurface flow and transport problems. Advances in Water Resources, 38, 27–37.
- Grygoruk, M. and Okruszko, T., 2015. Do water management and climate-adapted management of wetlands interfere in practice? Lessons from the Biebrza valley, Poland. GeoPlanet. Earth and Planetary Sciences, 15, 53–67.
- Guda, C., et al., 2001. A new algorithm for the alignment of multiple protein structures using Monte Carlo optimization. Pacific Symposium on Biocomputing, 6, 275–286.
- Koudstaal, R., Rijsberman, F.R., and Savenije, H., 1992. Water and sustainable development. In: International Conference on Water and the Environment: Development Issues for the 21st Century. Dublin, Ireland: World Meteorological Organization, 277–290.
- Kourakos, G. and Mantoglou, A., 2013. Development of a multi-objective optimization algorithm using surrogate models for coastal aquifer management. Journal of Hydrology, 479, 13–23. doi:10.1016/j.jhydrol.2012.10.050
- Labadie, J.W., 2004. Optimal operation of multireservoir systems: state-of-the-art review. Journal of Water Resources Planning and Management, 130 (2), 93–111. doi:10.1061/(ASCE)0733-9496(2004)130:2(93)
- Liu, W.-C., et al., 2004. Modeling salt water intrusion in Tanshui River Estuarine System - case-study contrasting now and then. Journal of Hydraulic Engineering, 130, 849–859. doi:10.1061/(ASCE)0733-9429(2004)130:9(849)
- Loucks, D.P., Stakhiv, E.Z., and Martin, L.R., 2000. Sustainable water resources management. Journal of Water Resources Planning and Management, 126, 43–47. doi:10.1061/(ASCE)0733-9496(2000)126:2(43)
- Mayer, A. and Muñoz-Hernandez, A., 2009. Integrated water resources optimization models: an assessment of a multidisciplinary tool for sustainable water resources management strategies. Geography Compass, 3 (3), 1176–1195. doi:10.1111/geco.2009.3.issue-3
- McKinney, D.C., et al., 1999. Modeling water resources management at the basin level: review and future directions. Colombo, Sri Lanka: International Water Management Institute, System-Wide Initiative on Water Management Paper 6.
- Sakalauskas, L., 2000. Nonlinear stochastic optimization by the Monte Carlo method. Informatica, 11 (4), 455–468.
- Trancoso, A.R., et al., 2009. An advanced modelling tool for simulating complex river systems. Science of the Total Environment, 407, 3004–3016. doi:10.1016/j.scitotenv.2009.01.015
- van der Zaag, P., 2007. Asymmetry and equity in water resources management; critical institutional issues for southern Africa. Water Resources Management, 21 (12), 1993–2004. doi:10.1007/s11269-006-9124-1
- Vaz, N., Dias, J.M., and Chambel Leitão, P.C., 2009. Three-dimensional modelling of a tidal channel: the Espinheiro Channel (Portugal). Continental Shelf Research, 29, 29–41. doi:10.1016/j.csr.2007.12.005
- Whitney, M.M., 2010. A study on river discharge and salinity variability in the Middle Atlantic Bight and Long Island Sound. Continental Shelf Research, 30, 305–318. doi:10.1016/j.csr.2009.11.011