
ABSTRACT
Based on a three-month-scale standardized precipitation index (SPI-3) computed from the available rainfall data of 13 stations of Niger, meteorological drought trends, periodicities and the relationships with 10 oceanic–atmospheric variables were analysed using the Mann-Kendall test, continuous wavelet transform and cross-wavelet analysis, respectively. The results revealed a significant (p < 5%) increase in drought at five of the 13 stations. A common dominant drought periodicity of 2 years was found at all of the stations, whereas significant periodicities varied from 2 to 32 years at six stations. Among the considered climate indices, South Atlantic sea-surface temperature, Southern Oscillation Index, sea-level pressure, geopotential height and relative humidity from the Atlantic basin oscillated in anti-phase relative to the SPI-3 at an inter-annual to decadal time scale from 1960 to 1990. In this period, relative humidity from the Mediterranean basin and zonal wind oscillated in phase with the drought index.
Editor D. Koutsoyiannis Associate editor A. Van Loon
1 Introduction
In the West African Sahel, the most devastating and recurrent natural hazard is drought. Deficiency in precipitation amount – its occurrence, distribution and intensity in comparison with the available water resources and water demand – is among the main causes of drought. Drought can therefore be defined as a period of water shortage that generally occurs when a specific area receives a rainfall amount below its usual levels (Maftei Citation2015). In order to understand the drought phenomenon and its related impacts, drought is classified as (Wilhite and Glantz Citation1985) meteorological, hydrological, agricultural or socio-economic. The first three types relate drought to physical phenomena, such as rainfall deficit, decrease in surface water and groundwater levels, and insufficient soil moisture for crop growth and yield, respectively. Socio-economic drought occurs when any of the first three types of drought starts to affect society and the economy (Mishra and Singh Citation2010).
Due to its geographical position, Niger is a drought-prone country and has experienced the devastating consequences of this natural hazard on several occasions. Between 1900 and 2015, the country experienced a total of 15 droughts (Guha-Sapir et al. Citation2014), with recurrent consequences such as food crisis, livestock losses and the advance of the Sahara Desert. However, it was the prolonged Sahelian droughts of the last three decades of the 20th century (known as the Sahelian big drought) that received the scientific community’s attention worldwide. This drought was significant, and its primary cause was a decrease in the rainfall amount (Dai et al. Citation2004). Numerous studies have linked the rainfall variability over the Sahel region to large-scale climate indices such as the El Niño phenomenon (Janicot et al. Citation1996), tropical sea-surface temperatures (SSTs) (Joly et al. Citation2007), Pacific Ocean SSTs (Hunt Citation2000), Mediterranean SSTs (Rowell Citation2003) or the Atlantic Multi-decadal Oscillation (AMO; Zhang and Delworth Citation2006) among others.
After the 1990s, some wet years (1998, 1999, 2003 and 2013) were observed in the Sahelian countries (Nicholson Citation2013). Therefore, weather experts and hydrologists remain divided on a possible recovery of the Sahelian rainfall regime. L’Hote et al. (Citation2002) studied the persistence of the big drought by analysing a Sahelian rainfall index, and found that the drought was not over at the end of the year 2000. Likewise, Lebel and Ali (Citation2009) confirmed the prevalence of the drought over the West African Sahel. Nicholson (Citation2005) maintained that a rainfall recovery occurred only in the northern Sahel during the period 1998–2003, while the drought continued unchanged in the Western Sahel, with mean rainfall for the period 1990–2007 equal to the mean of the drought period. Another study (Ozer et al. Citation2003) based on station-wise evidence showed that the drought may have ended in the 1990s. As speculation continues about the possible end or persistence of the drought, the population in the Sahel continues to suffer from drought consequences and people are uncertain about the future of their drought climatology.
Although there are many studies investigating drought over the Sahel region (Janicot Citation1992, Ward Citation1992, L’Hôte et al. Citation2002, Le Barbe et al. Citation2002), few have characterized meteorological drought in terms of intensity, trend, periodicity and the evolution of its teleconnection with ocean–atmosphere dynamics. Besides, most of the previous studies have considered a single mean value of rainfall over the whole Sahel region, underestimating the strong spatio-temporal variability (Chappell and Agnew Citation2004, Held et al. Citation2005, Badr and Zaitchik Citation2014). Moreover, conventional statistical methods have been the most common methods used for drought modelling over the region (D’Amato and Lebel Citation1998, L’Hote et al. Citation2002, Greene et al. Citation2009). However, the inevitable presence of noise and serial correlation in hydro-climatic data makes it difficult to apply a conventional statistical approach for parameter modelling (Labat Citation2005).
Nowadays, one of the most efficient tools in time series analysis is the wavelet transform (WT), proposed theoretically by Grossmann and Morlet (Citation1984). Since then, it has been successfully applied to perform discontinuity detection, long-term evolution detection and identification of pure frequencies in time series. Subsequently, WT has gained popularity in hydro-climatic time series analysis. Joshi et al. (Citation2016) analysed trend and dominant periodicity in drought variables in India by applying discrete WT combined with the Mann-Kendall test and continuous WT. Byun et al. (Citation2008) studied the periodicities of drought in Korea using wavelet analysis and spectrum analysis. Partal and Kucuk (Citation2006) used discrete WT to find which periodicities are mainly responsible for the trend in annual precipitation measurements in the Marmara region (Turkey). Ozger et al. (Citation2009) used continuous WT (CWT) to identify the dominant oscillations of drought indices and their temporal variations. Dash et al. (Citation2013) applied cross-wavelet analysis to study the teleconnection between the tropics and two regions of the Antarctic.
In the literature, among the numerous studies analysing drought, few have investigated drought periodicities associated with climate indices at different time scales. The objectives of this study are to: (1) estimate drought trends using the Mann-Kendall and trend-free pre-whitening Mann-Kendall tests; (2) determine dominant and significant periodicities in drought using CWT; and (3) analyse the relationship between 10 climate indices and drought occurrence using cross-wavelet analysis.
While most of the previous studies have used CWT and cross-wavelet transform to analyse periodicities associated with drought variability, or simply to investigate the connection between drought and a climate index, in this study, CWT was used in conjunction with cross-wavelet analysis to determine which climate indices are responsible for drought periodicities. This paper presents insight into the estimation of meteorological drought parameters in Niger, as well as the identification of ocean–atmosphere dynamics that can be used as drought predictors.
2 Material and methods
2.1 Study area
Niger is a landlocked country bordered by Algeria and Libya to the north, Chad to the east, Nigeria and Benin to the south, and Mali and Burkina Faso to the west. The country covers an area of 1 266 000 km2, of which 500 000 km2 is desert. The population is estimated at 18.5 million, with one of the highest demographic growth rates (3.9% per year) (INS-Niger Citation2016). The human development index is very low (0.353) (UNDP Citation2016) and the country is ranked among the less developed of the world. Its fragile economy is based mainly on rain-fed agriculture and livestock raising. Three out of four Nigeriens draw their income from the land. Hence, recurrent droughts severely affect people’s standard of living.
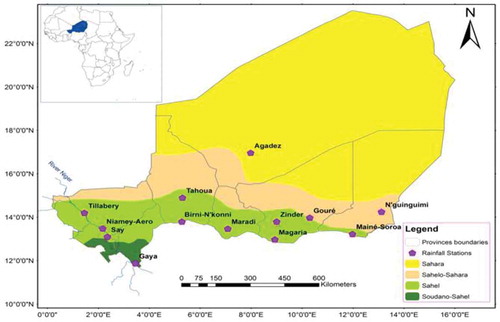
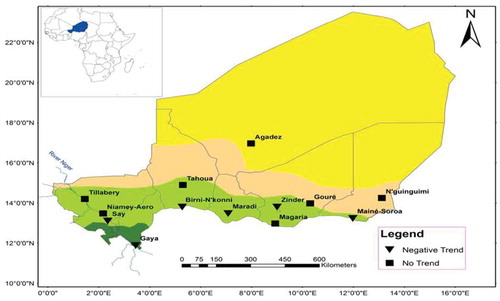
From an eco-climatic viewpoint, the country is divided into four principal zones (): hyper-dry Sahara climate in the north; semi-arid Sahara-Sahelian climate in the central south; Sahel climate in the south; and humid Soudano-Sahelian climate dominating a small portion of the southwest. Rainfall is season dependent and linked to the movement of the Inter-Tropical Convergence Zone (ITCZ). The rainy season is short (June–September) and 80% of the rain is recorded between July and September. The River Niger is the unique permanent watercourse of the country. Nevertheless, the hydrographic network is characterized by an important network of watersheds and several seasonal watercourses. Lake Chad – shared with Chad, Nigeria and Cameroon – constitutes an important water resource for the country.
Figure 1. Map of Niger and the rainfall stations used in the study.
2.2 Data description
The data used in this paper comprise monthly precipitation amounts taken from long time series of 13 rainfall stations distributed across the country (, ) and the monthly data of 10 oceanic–atmospheric indices. The rainfall data were provided by the National Meteorological Service of Niger. Also, high-resolution grids of monthly rainfall data (at 0.5° resolution) from the Climate Research Unit (Harris et al. Citation2014) were used.
Table 1. Climate stations used in the study.
The three-month-scale standardized precipitation index (SPI-3) of each rainfall station was computed by fitting the accumulated rainfall amount for the period July–September to the gamma two-parameter probability distribution; the parameters of the distribution were computed using the maximum likelihood method. The distribution was then transformed to the standard normal distribution resulting in the value of the SPI-3 (McKee et al. Citation1993). Drought classes were classified according to the SPI values (McKee et al. Citation1993) and are given in .
Table 2. Drought classification based on SPI values.
Additionally, the monthly data of 10 climate indices, retrieved from the National Oceanic and Atmospheric Administration (NOAA Citation2013), were used to investigate the link between drought occurrence in Niger and the ocean–atmosphere dynamics. These data are the most commonly used climate indices for rainfall teleconnection analysis over the Sahel region, and have been used in previous studies (e.g. Janicot et al. Citation2001, Badr and Zaitchik Citation2014, Gonzalez et al. Citation2015). A summary description of the climate indices is given in .
2.3 Trend analysis
In time series analysis, several parametric and nonparametric tests exist for trend detection. Nonparametric tests do not consider the distribution of the series; they are appropriate for series that are not normally distributed and can be performed with missing data, thus are suitable for hydrological time series (Caloiero et al. Citation2011). One of the most common nonparametric tests for trend and abrupt change detection in hydrological time series is the Mann-Kendall (MK) test. The MK test assumes the null hypothesis (H0) that the time series data originate from a population with independent and identically distributed random variables. The alternative hypothesis (H1) considers that the time series has a monotonic trend (Kendall Citation1975). Among the inconveniences of this method are its inefficiency against serial correlation (Yue et al. Citation2002) and its dependency on the sample size (Adamowski et al. Citation2009). Details on the MK statistics can be found in e.g. Hamed (Citation2008), Caloiero et al. (Citation2011), and Onyutha et al. (Citation2016).
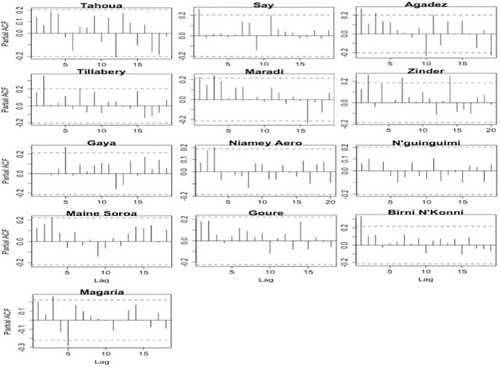
In this study, the trend analysis was performed using the MK test. The trend-free pre-whitening MK test (TFPW-MK; Yue et al. Citation2002) was used to overcome the serial correlation issue, while Sen’s slope estimator was applied to assess the magnitude of the trend. The autocorrelation function (ACF) and partial autocorrelation function (PACF) were used to check the presence of serial correlation in the SPI-3 series.
2.4 Periodicity analysis: continuous wavelet transform (CWT)
Periodicity is a key factor in the analysis of hydro-climatic time series. In drought modelling, the periodicity can be defined as the tendency of a characteristic to be recurrent or periodic at regular time intervals. In recent years, the application of WT has gained popularity for periodicity detection in hydrological time series. The WT can provide a comprehensive time scale localization of a transient process. The continuous WT (CWT) is commonly used for periodicity analysis, and the Morlet wavelet is preferred among the various wavelet families since it can effectively delineate the characteristics of hydro-climatic variables (Joshi et al. Citation2016).
Given a time series , the CWT time–frequency transformation
using the Morlet wavelet, is given by:
where is the complex conjugate of the mother wavelet
, t stands for time, a is the scale parameter and τ is the time step.
The Morlet wavelet can be expressed as (Torrence and Compo Citation1998):
where represents the dimensionless frequency and
the time parameter.
The Fourier transform of the Morlet wavelet is given by:
where is the central frequency of the mother wavelet.
To analyse periodicities in the SPI-3 series, global wavelet spectra, which are obtained by averaging the CWT power spectrum, are used. The power spectrum was computed in the software RStudio (Team Citation2015) using the WaveletComp package (Roesch and Schmidbauer Citation2014).
2.5 Relationship between Sahelian drought and climate indices: cross-wavelet transform (XWT)
Against the presence of nonstationary components in a time series, the use of classical cross-correlation is erroneous (Labat Citation2005). Other limitations of conventional cross-correlation are its ineffectiveness against nonlinear and non-ergodic series. Cross-wavelet transform (XWT) is a tool that overcomes all these issues. Moreover, it can detect correlation between two time series for different time scales (Sang Citation2013). It has been applied to understand the connections between hydro-climatic data.
The wavelet cross spectrum of two time series X and Y, having wavelet transforms and
, respectively, is defined as (Torrence and Compo Citation1998):
where s is the wavelet scale, n = 1, …, N, with N representing the length of the series X and Y, and stands for the complex conjugate of
.
The cross-wavelet power is the absolute value of the wavelet cross spectrum. For the statistical significance of the wavelet power estimation, the reader is referred to Cook et al. (Citation2016). The theoretical distribution of the cross-wavelet power with background power
and
is defined as (Torrence and Compo Citation1998):
where is the confidence level associated with a probability p, σX and σY are the standard deviations of the series X and Y, and v is the degree of freedom. For v = 1 (real wavelets), Z1 (95%) = 2.182, and for v = 2 (complex wavelets), Z2 (95%) = 3.999. Parameter Pk represents the background power.
The cross-wavelet analysis was carried out in RStudio software using the “biwavelet” package (Gouhier et al. Citation2016).
3 Results
3.1 Trend and periodicity analysis
The three-month scale standardized precipitation index (SPI-3) was used to characterize meteorological drought in Niger. The SPI-3 of the 13 rainfall stations studied was computed using the gamma two-parameter distribution (see Section 2.2), and the results are presented in . The presence of serial correlation in the SPI-3 series was checked by plotting their ACFs and PACFs (Section 2.3), as shown in and , respectively. A close look at and reveals the presence of a significant autocorrelation in the SPI-3 series at all of the stations except Tahoua, N’Guinguimi and Gouré. The MK test was applied to detect trend in the SPI-3 series with no serial correlation, while the TFPW-MK test was applied to the auto-correlated SPI-3 series. Sen’s slope was then computed to estimate the intensity of the trend. The results of the trend analysis are presented in for the MK test and in for the TFPW-MK test.
Table 3. Description of the climate indices. Data source: NOAA/ESRL.
Table 4. Results of trend analysis with Mann-Kendall test.
Table 5. Results of trend analysis with the trend-free pre-whitening MK test.
Figure 2. Computed SPI-3.
Figure 3. ACF of the SPI-3 series.
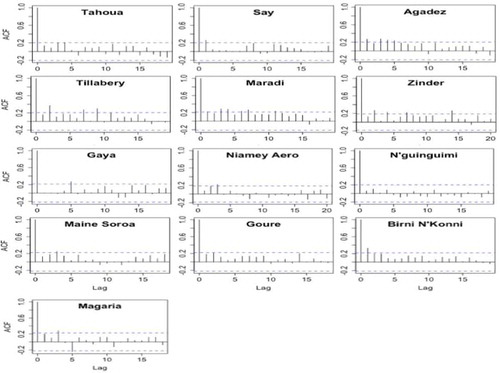
Figure 4. Partial ACF of the SPI-3 series.
Additionally, a drought trend map, showing the drought condition at the 13 stations is illustrated in . The results of the trend analysis reveal the presence of a negative trend, significant at the 5% level, at five of the 13 rainfall stations. The other eight stations also present a downward trend, but above the 5% level of significance; thus they were considered as stations with no trend. The trend analysis has shown no upward trend in the drought indices.
Figure 5. Drought trend map.
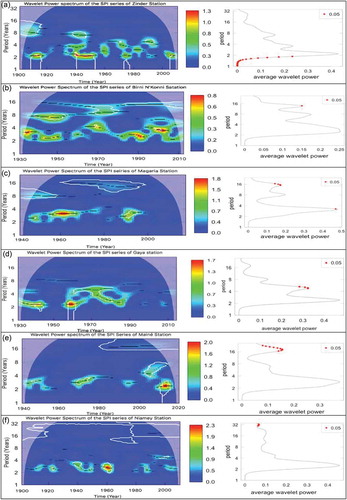
As for the drought periodicity analysis, the wavelet power spectrum and the average wavelet power of the SPI-3 were computed and plotted. Dominant and significant drought periodicities were found at six of the 13 stations, namely at Zinder, Birnin N’Konni, Magaria, Gaya, Mainé Soroa and Niamey, as illustrated in . A significant common drought periodicity of approximately 2 years, occurring between the late 1950s and 1990, can be observed (). However, the 2-year periodicity is only significant (p > 0.05) at Zinder station ()). After the 1990s, a drought periodicity of 13 and 5 years was observed at Birni N’Konni ()) and Gaya ()) stations, respectively. At Magaria station, three significant periodicities were found, varying from 3 years for the period 1955–1970 and in the 1990s, to 16 years for 1960–2000 ()). Mainé Soroa station displayed a significant drought periodicity of 16 years between 1980 and 2014 ()), while Niamey-Aero station had the highest periodicity, with 32 years, occurring between 1905 and 2014 ().
Figure 6. Wavelet power spectrum and average wavelet power of the SPI-3 series of the stations: (a) Zinder, (b) Birnin N’Konni, (c) Magaria, (d) Gaya, (e) Mainé Soroa and (f) Niamey.
3.2 Cross-wavelet analysis between SPI-3 and climate indices
The teleconnection analysis between drought occurrence in Niger and the oceanic–atmospheric phenomena was performed by considering 10 climate indices. The monthly climate indices were lagged from zero to 18 months relative to the SPI-3. Lag zero corresponds to July of the same year as the SPI-3, while lag 18 corresponds to January of the previous year to the SPI-3. Thus, the cross-wavelet spectrum between each individual variable and the SPI-3 was computed for each lag period. The results of the cross-wavelet analysis are presented in and .
Table 6. Cross-wavelet analysis between SPI and the climate indices: Southern Oscillation Index (SOI); relative humidity from the Mediterranean basin (RH Med.); sea-level pressure (SLP); zonal wind (Zon. Wind); and sea-surface temperature (SST).
Table 7. Cross-wavelet analysis between SPI and the climate indices: meridional wind (Mer. Wind); geopotential height (GpH); Atlantic Multi-decadal Oscillation (AMO); air temperature (Air temp); and relative humidity from the Atlantic basin (RH Atl.) .
In total, 130 wavelet power spectra were computed (i.e. 13 rainfall stations for each of the 10 climate indices). However, since all the details are shown in and , only the cross-wavelet spectra for selected rainfall stations are presented in the subsequent figures for each climate index (– below). In these cross-wavelet spectra, the 5% significance level against red noise is represented by a thick contour and the relative phase relationship is represented by arrows, with in-phase pointing right, anti-phase pointing left, SPI-3 leading pointing up, and the climate index leading pointing down. As can be seen in these figures, most of the climate indices display significant common oscillations with the SPI-3. An exception is observed for the air temperature and the Atlantic Multi-decadal Oscillation, for which only the SPI-3 series of two stations (Gaya and Magaria) exhibited common powers in the period 1960–1980 ().
Figure 7. Cross-wavelet transform SOI–SPI-3: (a) Tahoua, (b) Gaya, (c) N’Guinguimi and (d) Say.
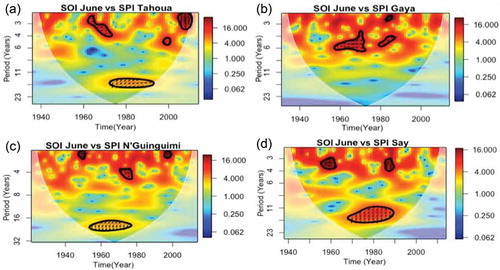
Figure 8. Cross-wavelet transform RH–SPI-3: (a) Agadez, (b) Tillabery, (c) Gouré and (d) Maradi.
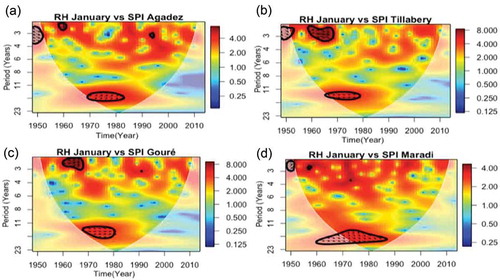
Figure 9. Cross-wavelet transform SLP–SPI-3: (a) Say, (b) Zinder, (c) Mainé Soroa and (d) Niamey-Aero.
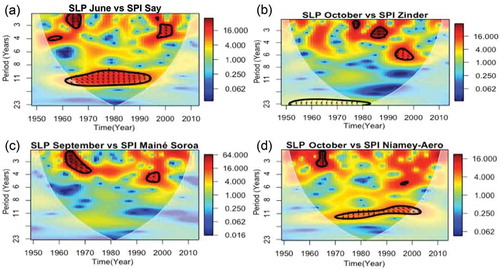
Figure 10. Cross-wavelet transform Zonal Wind–SPI-3: (a) Magaria, (b) Birni N’Konni, (c) Tahoua and (d) Gaya.
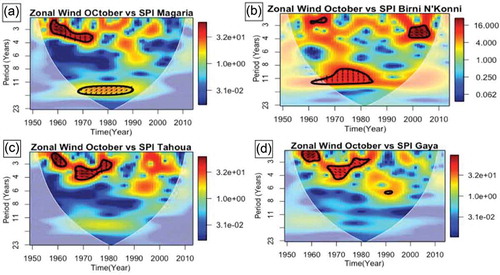
Figure 11. Cross-wavelet transform SST–SPI-3: (a) N’Guinguimi, (b) Mainé Soroa, (c) Tillabery and (d) Zinder.
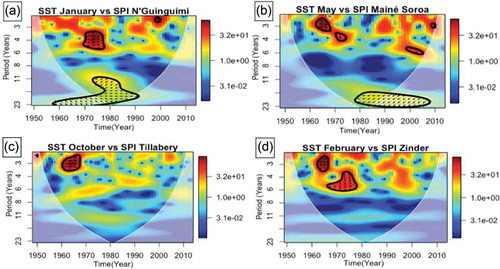
Figure 12. Cross-wavelet transform Meridional Wind–SPI-3: (a) Gouré, (b) Maradi, (c) Say and (d) Niamey-Aero.
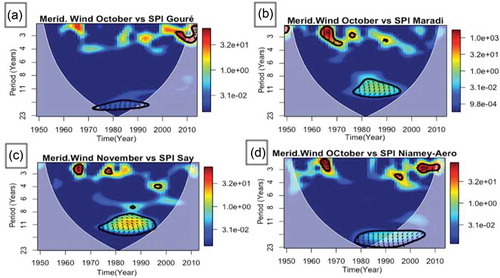
Figure 13. Cross-wavelet transform Geopotential Height–SPI-3: (a) Magaria, (b) Agadez, (c) Gaya and (d) Tahoua.
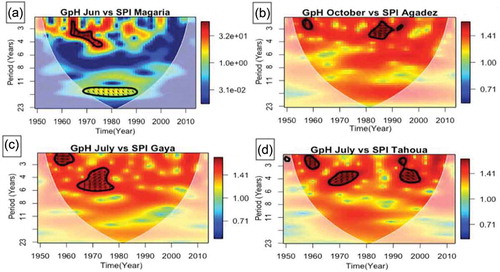
Figure 14. Cross-wavelet transform AMO–SPI-3: (a) Gaya and (b) Magaria.
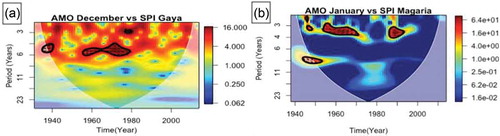
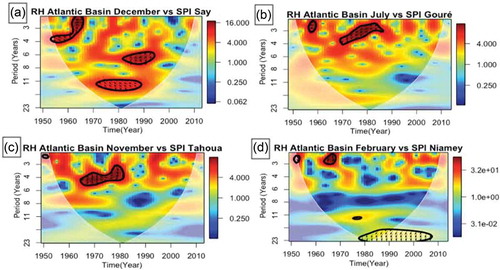
Figure 15. Cross-wavelet transform RH Atlantic basin–SPI-3: (a) Say, (b) Gouré, (c) Tahoua and (d) Niamey-Aero.
4 Discussion
4.1 Trend and periodicity
A close look at the SPI-3 bar chart () shows a decay in the series corresponding to the abrupt change in the rainfall series that occurred between 1960 and 1970. At Say, Maradi, Tillabery and Birni N’Konni stations, the SPI-3 values shifted completely from positive to negative values, being mostly below −0.99, explaining the prolonged drought condition. At the other stations, some positive values of SPI-3 greater than 0.99 (wet spell) in alternation with negative values were observed after 1990. Since the SPI is a drought index based only on precipitation values, the results obtained here confirm how the rainfall pattern over the country has varied since the 1960s without a significant recovery.
As for the Mann-Kendall trend analysis, the absolute value of the two-tailed critical Z value at the 5% level of significance is (Kendall Citation1975). Thus for a
value < 1.96, the null hypothesis is accepted at the 5% level of significance (Gilbert Citation1987). Otherwise, the null hypothesis is rejected, and the trend sign corresponds to the
sign. For serially correlated SPI-3, before assuming the presence of trend, the Sen’s slope value must be in the TFPW confidence interval ().
From the results presented in and , negative trends were detected at five of the 13 stations (). The downward slope of the trend is slight, but it nevertheless confirms the persistence of the drought conditions at these stations. Furthermore, all the values are negative, so no upward trend in the SPI-3 values was detected. However, important improvements in drought intensities were observed at Magaria, Gouré and N’Guinguimi stations () after the 1990s. For this period, the SPI-3 values of all of the stations are greater than the SPI-3 values for the drought period, but less than the values observed for the pre-drought period (before the 1960s). This proves the non-recovery of drought conditions over Niger, confirming the findings of L’Hote et al. (Citation2002) and Lebel and Ali (Citation2009).
During the Sahelian prolonged drought (1970s and 1980s), the dominant drought periodicity was 2 years at six of the 13 stations. After 1990, the drought periodicity varied between 2 and 32 years, depending on the station. This is clear evidence of a significant improvement in drought conditions over the country in terms of frequency.
Additionally, the relationship between drought occurrence over the country and each of the oceanic–atmospheric indices is inferred from the XWT results as follows.
4.2 Cross-wavelet transform
4.2.1 SOI–SPI-3
In the period between the late 1960s and the 1980s, a dominant common power was found between the Southern Oscillation Index (SOI) and the SPI-3 series at all of the 13 stations. The two variables oscillated in anti-phase with a significant (p = 0.05) common power at inter-annual to decadal time scales (, ). In other words, the warm phase of El Niño (strong El Niño) likely intensified dry spells in the country during the Sahelian drought. The difference in the time scale of the common power spectrum, as well as the dissimilarity in the lag period observed at the stations, reflects the spatio-temporal variation of the El Niño Southern Oscillation (ENSO) effects over the country. After the 1990s, the ENSO influence was reduced to an insignificant level as no significant common power was found between SOI and SPI-3. Although the indirect influence of ENSO on the rainfall pattern over the Sahel was shown by Nicholson (Citation1997), the present results clearly show the period of occurrence, the time scale and the spatio-temporal variation of this teleconnection at the country scale.
4.2.2 RH–SPI-3
Between the 1970s and the late 1980s, the relative humidity (RH) from the Mediterranean basin displayed significant (p < 5%) common oscillations with the SPI-3 at different time scales (inter-annual to decadal) depending on the rainfall station (, ). From theses results, it is clear that RH from the Mediterranean basin was an important source of humidity for Niger during the Sahelian drought. The positive link between RH of the Mediterranean basin and the Sahelian rainfall, at the decadal time scale, was also revealed by Rowell (Citation2003). However, this connection has become insignificant since the late 1980s.
4.2.3 SLP–SPI-3
The sea-level pressure (SLP) between 15°–70°N and 60°W–60°E exhibits dominant common power, with anti-phase oscillations with the SPI-3 at inter-annual to decadal time scales (, ) during the Sahelian drought. Hence, SLP has also contributed to the prolonged drought. Haarsma et al. (Citation2005) linked the SLP anomalies to the large-scale circulation of the surface air temperature (SAT), inferring that augmentation in SAT over the Sahara with respect to the neighbouring oceans reduces the SLP over the Sahara, therefore increasing Sahelian rainfall. This confirms the negative link between the SLP and the SPI-3 over Niger.
4.2.4 Zonal wind–SPI-3
Zonal wind (Sahel Easterly Jet) exhibits the same phase oscillations with the SPI-3 at inter-annual to decadal time scales. At most of the rainfall stations, the time scale of this link is about 2–4 years (). Additionally, a time scale relationship of 9–14 years was found at Say and Birni N’Konni stations in the period between the 1960s and the late 1980s (). In other words, an increase in this index positively influences rainfall over Niger at inter-annual to decadal time scales.
4.2.5 SST–SPI-3
Inter-annual to multi-decadal dominant oscillations were found between SST from the South Atlantic and the SPI-3 series during the Sahelian drought period. The time scales of the common powers vary in the ranges 3–6 years and 16–23 years, depending on the station (), and the two variables oscillated in anti-phases (). These results agree with Hastenrath (Citation1990) on the negative influence of the SST of the South Atlantic on Sahelian rainfall, but only at the decadal time scale. The multi-decadal time scale relationship is clear evidence that, in the post-Sahelian prolonged drought era, increase in the SST may continue to negatively influence rainfall patterns over the country.
4.2.6 Meridional wind–SPI-3
Between these variables, dominant common oscillations occurred from inter-annual to bi-decadal time scales (). Meridional wind and SPI-3 oscillated in anti-phase between approximately 1975 and 1995 at all of the 13 stations. The common power intensity was progressively reduced in the late 1990s and completely disappeared after the year 2000 (). In other words, at inter-annual to bi-decadal time scales, meridional wind contributed to drought in the country between 1975 and 1995, but its impact became insignificant after this period.
4.2.7 Geopotential height–SPI-3
The dominant common power between SPI-3 and geopotential height (GpH) occurs at the 3–6-year time scale (), and the two variables oscillated in anti-phases between the late 1960s and the late 1970s (). The GpH may be considered as one of the main driving forces of the Sahelian prolonged drought.
4.2.8 AMO–SPI-3
The Atlantic Multi-decadal Oscillation (AMO) does not exhibit dominant common power with the SPI-3. Among the 13 rainfall stations considered in this study, the SPI-3 of only two stations displays common power with the AMO. These rainfall stations are Gaya, with a phase oscillation, and Magaria stations, which have an anti-phase oscillation at 3–6 years time scale (). A classical cross-correlation between these two variables revealed significant correlation (p < 5%) with a Pearson correlation (R) of 0.24–0.43. Hence, the relationship between AMO and SPI-3 of Niger is likely to be linear.
4.2.9 Air temperature–SPI-3
No common power was found between these two variables. However, the significant and negative linear correlation coefficient (R between −0.48 and −0.20) found between SPI-3 and air temperature confirms the quasi-linearity of this link.
4.2.10 RH Atlantic basin–SPI-3
The cross-wavelet analysis discloses the presence of common power that oscillates in anti-phase between RH from the Atlantic basin and SPI-3. The RH of the previous year to the SPI-3 oscillates in opposite angle phases with the SPI-3 at inter-annual to decadal time scales (). The common power is mostly observed in the period between the late 1960s and the late 1980s, and at some stations it is prolonged until the 2000s ().
From a comparison made between the drought periodicities at six of the 13 stations, the time scales of the teleconnection between the SPI-3 and the different climate indices, as well as the period of occurrence, we can infer the following: at Zinder and Magaria stations, a significant periodicity of 2 years was detected, and SST and SLP oscillated in anti-phase with the SPI-3 at a time scale of 2–4 years (1964–1990) and 2–5 years (1962–1990), respectively. This demonstrates that the SST of the South Atlantic and SLP are responsible for the 2-year periodicity at Zinder station. The same comparison done for Gaya station discloses that SST, SLP and SOI are responsible for the 5-year drought periodicity at that station during the Sahelian prolonged drought. For Mainé Soroa station, the 16-year period is due to the GpH and the RH from the Atlantic basin, while at Magaria rainfall station, SLP is responsible for the 3-year periodicity, and the 16-year periodicity is credited to SOI, SST, GpH and RH from the Atlantic. Finally, the 32-year period at Niamey station does not match with the time scale of the teleconnection of the SPI-3, and their periods of occurrence differ.
At inter-annual to decadal time scales, there have been changes not only in the teleconnection between the climate indices that contributed to drought in the region, but also in the relationship between climate indices that bring rainfall over the country. Hence, the climate indices that were found in this study to be highly linked with drought may not be skilful predictors when used alone in nonlinear drought forecasting models. For effective drought prediction, these indices should be combined with the impact of anthropogenic activities (such as wood cutting, over-grazing, greenhouse gas emissions, aerosol emissions, land degradation and urbanization) that are likely to explain the variability in the teleconnection between drought and oceanic–atmospheric variables.
5 Conclusions
Meteorological drought, characterized by three-month standardized precipitation index (SPI-3), trends and periodicities over Niger, as well as its connection with climate indices, were investigated.
From the trend analysis, a downward trend with a slight slope was found at five of the 13 rainfall stations considered in the study. This result confirms that drought conditions over the country are not over, and can be classified from stationary to deteriorating depending on the station. The periodicity found in the SPI-3 varies from 2 years for the Sahelian drought to multi-decades in the post-drought era. Although drought has reduced in terms of frequency since the Sahelian prolonged drought, it remains unabated in terms of intensity.
Additionally, most of the climate indices considered in this study exhibited a strong connection with drought characteristics over the country between the late 1960s and the 1990s. The SOI, SLP, South Atlantic SST, GpH, meridional wind and relative humidity from the Atlantic basin are the indices that significantly contributed to enhance drought conditions in Niger during the Sahelian persistent drought of the 1970s and 1980s. In the same period, relative humidity from the Mediterranean basin and zonal wind likely contributed to enhance wet spells over the country, whereas the impact of the AMO and air temperature were neutral at inter-annual to decadal time scales.
Since the 1990s, the Sahelian countries have not experienced prolonged and extended droughts. Moreover, droughts in this region are spatially less extended in comparison to the 20th-century Sahelian droughts. However, since the 1980s, the same climate indices have been used as drought predictors in forecasting models over the Sahel region, while underestimating the variability of their influence. Climate change effects have undoubtedly modified the teleconnection between drought in the Sahel and the oceanic–atmospheric dynamics. Therefore, for effective drought forecasting, climate indices as predictors should be combined with the impacts of human activities.
Acknowledgements
The authors thank the anonymous reviewers as well as the Editor and Associate Editor for the thorough assessment of the present paper, and for their valuable comments and suggestions that helped to improve this paper. The National Meteorological Service of Niger provided the monthly rainfall data. The climate indices data were provided by the NOAA/OAR/ESRL PSD, Boulder, Colorado, USA, from their website: http://www.esrl.noaa.gov/psd/.
Disclosure statement
No potential conflict of interest was reported by the authors.
References
- Adamowski, K., Prokoph, A., and Adamowski, J., 2009. Development of a new method of wavelet aided trend detection and estimation. Hydrological Processes, 23 (18), 2686–2696. doi:10.1002/hyp.v23:18
- Badr, H.S. and Zaitchik, B.F., 2014. Application of statistical models to the prediction of seasonal rainfall anomalies over the Sahel. Journal of Applied Meteorology and Climatology, 53, 614–636. doi:10.1175/JAMC-D-13-0181.1
- Byun, H.R., et al., 2008. Study on the periodicities of droughts in Korea. Asia-Pacific Journal of Atmospheric Sciences, 44 (4), 417–441.
- Caloiero, T., et al. 2011. Trend detection of annual and seasonal rainfall in Calabria (Southern Italy). International Journal of Climatology, 31 (1), 44–56. doi:10.1002/joc.2055
- Chappell, A. and Agnew, C.T., 2004. Modelling climate change in West African Sahel rainfall (1931–90) as an artifact of changing station locations. International Journal of Climatology, 24 (5), 547–554. doi:10.1002/(ISSN)1097-0088
- Cook, B.I., et al. 2016. Spatiotemporal drought variability in the Mediterranean over the last 900 years. Journal of Geophysical Research-Atmospheres, 121 (5), 2060–2074. doi:10.1002/2015JD023929
- D’Amato, N. and Lebel, T., 1998. On the characteristics of the rainfall events in the Sahel with a view to the analysis of climatic variability. International Journal of Climatology, 18 (9), 955–974. doi:10.1002/(SICI)1097-0088(199807)18:9<955::AID-JOC236>3.0.CO;2-6
- Dai, A., et al., 2004. The recent Sahel drought is real. International Journal of Climatology, 24, 1323–1331. doi:10.1002/joc.1083
- Dash, M.K., et al. 2013. Variability in the ENSO-induced southern hemispheric circulation and Antarctic sea ice extent. International Journal of Climatology, 33 (3), 778–783. doi:10.1002/joc.3456
- Gilbert, R.O., 1987. Statistical methods for environmental pollution monitoring. New York: Van Nostrand Reinhold Company Inc.
- Gonzalez, D.L., et al., 2015. On the data-driven inference of modulatory networks in climate science: an application to West African rainfall. Nonlinear Processes in Geophysics, 22, 33–46. doi:10.5194/npg-22-33-2015
- Gouhier, T.C., Grinsted, A., and Simko, V., 2016. R package biwavelet: conduct univariate and bivariate wavelet analyses (Version 0.20.10). Available from: http://biwavelet.r-forge.r-project.org
- Greene, A.M., Giannini, A., and Zebiak, S.E., 2009. Drought return times in the Sahel: a question of attribution. Geophysical Research Letters, 36, 4. doi:10.1029/2009GL038868
- Grossmann, A. and Morlet, J., 1984. Decomposition of Hardy function into square integrable wavelets of constant shape. Journal Mathematical Analysis, 5, 723–736.
- Guha-Sapir, D., Below, R., and Hoyois, P. 2014. EM-DAT: international disaster database [online]. Brussels, Belgium: Université Catholique de Louvain. Available from: www.emdat.be [Accessed 20 Nov 2014].
- Haarsma, R.J., et al., 2005. Sahel rainfall variability and response to greenhouse warming. Geophysical Research Letters, 32, 4. doi:10.1029/2005GL023232
- Hamed, K.H., 2008. Trend detection in hydrologic data: the Mann-Kendalll trend test under the scaling hypothesis. Journal of Hydrology, 349 (3–4), 350–363. doi:10.1016/j.jhydrol.2007.11.009
- Harris, I., et al. 2014. Updated high-resolution grids of monthly climatic observations – the CRU TS3.10 Dataset. International Journal of Climatology, 34 (3), 623–642. doi:10.1002/joc.3711
- Hastenrath, S., 1990. Decadal-scale changes of the circulation in the tropical Atlantic sector associated with Sahel drought. International Journal of Climatology, 10, 459–472. doi:10.1002/(ISSN)1097-0088
- Held, I.M., et al. 2005. Simulation of Sahel drought in the 20th and 21st centuries. Proceedings of the National Academy of Sciences of the United States of America, 102 (50), 17891–17896. doi:10.1073/pnas.0509057102
- Hunt, B.G., 2000. Natural climatic variability and Sahelian rainfall trends. Global and Planetary Change, 24, 107–131. doi:10.1016/S0921-8181(99)00064-8
- INS-Niger, 2016. Tablo de bord social. Niamey, Niger: Institut Nationale de la Statistique du Niger.
- Janicot, S., 1992. Spatiotemporal variability of west african rainfall. Part II: associated surface and airmass characteristics. Journal of Climate, 5, 499–511. doi:10.1175/1520-0442(1992)005<0499:SVOWAR>2.0.CO;2
- Janicot, S., Moron, V., and Fontaine, B., 1996. Sahel droughts and ENSO dynamics. Geophysical Research Letters, 23, 515–518. doi:10.1029/96GL00246
- Janicot, S., Trzaska, S., and Poccard, I., 2001. Summer Sahel-ENSO teleconnection and decadal time scale SST variations. Climate Dynamics, 18, 303–320. doi:10.1007/s003820100172
- Joly, M., et al., 2007. African monsoon teleconnections with tropical SSTs: validation and evolution in a set of IPCC4 simulations. Climate Dynamics, 29, 1–20. doi:10.1007/s00382-006-0215-8
- Joshi, N., et al., 2016. Analysis of trends and dominant periodicities in drought variables in India: a wavelet transform based approach. Atmospheric Research, 182, 200–220. doi:10.1016/j.atmosres.2016.07.030
- Kendalll, M.G., 1975. Rank correlation methods. 4th ed. London, UK: Griffin.
- L’Hote, Y., et al. 2002. Analysis of a Sahelian annual rainfall index from 1896 to 2000; the drought continues. Hydrological Sciences Journal-Journal Des Sciences Hydrologiques, 47 (4), 563–572. doi:10.1080/02626660209492960
- Labat, D., 2005. Recent advances in wavelet analyses: part I. A review of concepts. Journal of Hydrology, 314, 275–288. doi:10.1016/j.jhydrol.2005.04.003
- Le Barbe, L., Lebel, T., and Tapsoba, D., 2002. Rainfall variability in West Africa during the years 1950-90. Journal of Climate, 15, 187–202. doi:10.1175/1520-0442(2002)015<0187:RVIWAD>2.0.CO;2
- Lebel, T. and Ali, A., 2009. Recent trends in the Central and Western Sahel rainfall regime (1990–2007). Journal of Hydrology, 375 (1–2), 52–64. doi:10.1016/j.jhydrol.2008.11.030
- Maftei, C., 2015. Extreme weather and impacts of climate change on water resources in the dobrogea region. USA: Information Science Reference.
- McKee, T.B., Doesken, N.J., and Kleist, J., 1993. Relationship of drought frequency. Eighth conference on applied climatology. Department of atmospheric science Colorado State University. Anaheim, California: American Meteorological Society, 179–186.
- Mishra, A.K. and Singh, V.P., 2010. A review of drought concepts. Journal of Hydrology, 391 (1–2), 204–216. doi:10.1016/j.jhydrol.2010.07.012
- Nicholson, S., 2005. On the question of the “recovery” of the rains in the West African Sahel. Journal of Arid Environments, 63 (3), 615–641. doi:10.1016/j.jaridenv.2005.03.004
- Nicholson, S.E., 1997. An analysis of the ENSO signal in the tropical Atlantic and western Indian Oceans (vol 17, pg 345, 1997). International Journal of Climatology, 17 (9), 1008. doi:10.1002/(SICI)1097-0088(199707)17:9<1008::AID-JOC117>3.0.CO;2-9
- Nicholson, S.E., 2013. The West African Sahel: a review of recent studies on the rainfall regime and its interannual variability. ISRN Meteorology, 2013, 1–32. doi:10.1155/2013/453521
- NOAA, 2013. National oceanic and atmospheric administration [online]. Available from: http://www.noaa.gov [Accessed 5 Feb 2017].
- Onyutha, C., et al., 2016. Analyses of rainfall trends in the Nile River Basin. Journal of Hydro-Environment Research, 13, 36–51. doi:10.1016/j.jher.2015.09.002
- Ozer, P., et al. 2003. DISCUSSION of “Analysis of a Sahelian annual rainfall index from 1896 to 2000; the drought continues” The Sahelian drought may have ended during the 1990s. Hydrological Sciences Journal – Journal Des Sciences Hydrologiques, 48 (3), 489–492. doi:10.1623/hysj.48.3.489.45285
- Ozger, M., Mishra, A.K., and Singh, V.P., 2009. Low frequency drought variability associated with climate indices. Journal of Hydrology, 364 (1–2), 152–162. doi:10.1016/j.jhydrol.2008.10.018
- Partal, T. and Kucuk, M., 2006. Long-term trend analysis using discrete wavelet components of annual precipitations measurements in Marmara region (Turkey). Physics and Chemistry of the Earth, 31 (18), 1189–1200. doi:10.1016/j.pce.2006.04.043
- Roesch, A. and Schmidbauer, H., 2014. WaveletComp: computational wavelet analysis. R Package Version, 1.0. Available from: https://CRAN.R-project.org/package=WaveletComp
- Rowell, D.P., 2003. The impact of Mediterranean SSTs on the Sahelian rainfall season. Journal of Climate, 16, 849–862. doi:10.1175/1520-0442(2003)016<0849:TIOMSO>2.0.CO;2
- Sang, Y.F., 2013. A review on the applications of wavelet transform in hydrology time series analysis. Atmospheric Research, 122, 8–15. doi:10.1016/j.atmosres.2012.11.003
- Team, R., 2015. RStudio: integrated development environment for R. Boston, MA: RStudio, Inc.
- Torrence, C. and Compo, G.P., 1998. A practical guide to wavelet analysis. Bulletin of the American Meteorological Society, 79 (1), 61–78. doi:10.1175/1520-0477(1998)079<0061:APGTWA>2.0.CO;2
- UNDP, 2016. Human Development Report 2016. New York, NY: United Nations Development Programme.
- Ward, M.N., 1992. Provisionally corrected surface wind data, worldwide ocean atmosphere surface fields, and Sahelian rainfall variability. Journal of Climate, 5 (5), 454–475. doi:10.1175/1520-0442(1992)005<0454:PCSWDW>2.0.CO;2
- Wilhite, D.A. and Glantz, M.H., 1985. Understanding: the drought phenomenon: the role of definitions. Water International, 10 (3), 111–120. doi:10.1080/02508068508686328
- Yue, S., et al. 2002. The influence of autocorrelation on the ability to detect trend in hydrological series. Hydrological Processes, 16 (9), 1807–1829. doi:10.1002/hyp.1095
- Zhang, R. and Delworth, T.L., 2006, Impact of Atlantic multidecadal oscillations on India/Sahel rainfall and Atlantic hurricanes. Geophysical Research Letters, 33(17). doi:10.1029/2006GL026267